Copyright Sociological Research Online, 2002


Geoff Payne and Judy Roberts (2002) Opening and Closing the Gates: Recent Developments in Male Social Mobility in Britain
Sociological Research Online, vol. 6, no. 4, <http://www.socresonline.org.uk/6/4/payne.html>

To cite articles published in Sociological Research Online, please reference the above information and include paragraph numbers if necessary

Received: 27/9/2001      Accepted: 25/2/2002      Published: 28/02/2002

Abstract

Sociological understanding of social mobility in Britain has depended heavily on the 1972 Nuffield Mobility Study. In the virtual absence of more recent data, analysis has drawn on this single study with its reliance on cohorts of males as the indicator of changes in mobility. One of the central conclusions has been that relative mobility rates, the key marker of class inequalities, remain unchanged. A new analysis of data from recent British Election Surveys shows that these conclusions should not be empirically generalised to the last quarter of a century, and that British society has experienced both periods of greater ?openness? and 'closure'. Several conceptual reservations follow once the limitations of the 'Nuffield tradition' have been identified. In particular, a case is made for closer attention to labour market processes and rates of absolute mobility.

Keywords:
Absolute Mobility; British Election Survey; British Society; Nuffield Mobility Study; Occupational Transition; Relative Mobility; Social Change; Social Class; Social Mobility

Introduction

1.1
The reason why social mobility has consistently been a core topic in British sociology for nearly half a century is because it offers an important purchase on social class inequalities. Indeed, mobility analysis could be said to have been an integral contribution to many early models of the British class structure (e.g. Bottomore 1965; Parkin 1971; Giddens 1973; Westergaard and Resler 1975), while in the more recent debate about the supposed 'death of class' (Lee and Turner 1996) social mobility has been one of the key processes identified as demonstrating the continuity of class differences in life chances. The gateways to joining higher social classes also control social destinies, and how wide they open is a central question.

1.2
Mobility has even re-emerged on the political agenda. In the phoney war that preceded last year's General Election, a Cabinet Think Tank actually took some sociological advice on the subject (Aldridge 2001). Tony Blair himself argued that

the mission of any second term must be this: to break down the barriers that hold people back, to create real upward social mobility, a society that is open (Blair 2001:2).

1.3
In the light of this, it is a striking fact that very few new empirical data have been collected on mobility in Britain since the early 1970s. Heath and Payne's (2000) recent contribution, introducing new data from the British Election Surveys ('BES') between 1964 and 1997, is one welcome exception. Otherwise, it is the 1972 Nuffield Mobility Study that has provided the basis for much of our current knowledge and conceptualisation of class mobility

1.4
A glance through the introductory textbooks shows how true this still is (e.g .Giddens 1999;Scott 2000; Roberts 2001). Mobility 'specialists' will of course be familiar with a few other sources (e.g. see <http://www.fss.uu.nl/soc/HG/rc28>; <http://www.nuff.ox.ac.uk/Users/yaish/npsm&g t;; <http://www.ssc.ucla.edu/issr/da /Mobility/abs/searchm.html>;), but most sociologists still rely on analyses of Nuffield data collected 30 years ago - and which deal only with men. Like the aftermath of the 1949 LSE study and the subsequent dearth of fresh data collection until 1972, we have had effectively to wait a whole generation for fresh information on British mobility.

1.5
It is of course true that, on the whole, the changes in mobility rates are not sudden or dramatically large. In general, structural changes in the labour market and class system do not happen very quickly, nor are they very extensive over, say, short term five-year periods. In the same way, mobility patterns do not fluctuate dramatically under normal conditions. We should therefore not anticipate seeing really major changes when the underlying processes of social change are working in the way that can commonly be observed over the last quarter of a century.

1.6
It is also true that there are no absolute criteria for deciding what is a 'large', 'small', or 'significant' change in mobility rates. A change of a few percentage points in the rate of, say, upward mobility when it was running at about 30 percent, may not initially seem very impressive. However, expressed as a percentage of the base rate, a rise of six percentage points in this case would represent a 20 percent increase in the rate (6/30 x 100). When that occurs within a couple of decades, the present authors, at least, are prepared to describe this as a substantial change and one that requires further consideration.

1.7
Even if there are difficulties in being precise about how to describe the scale of change, that is no reason for continuing to use data 30 years out of date, both for a basic account and as the data-set on which new ideas have since been tested. In other fields of sociology when we were providing sociological accounts of social conditions today, we would not be content to use data primarily collected in the early 1970s as the basis for our discussions of, say, the labour force and employment, household and family structures, income inequalities and consumption patterns, housing or health, political and social attitudes, or education and training. Yet each of these topics plays a part in the processes that constitute social mobility. We simply do not know very much about the current patterns of mobility in contemporary society, other than what the Nuffield Mobility Study has told us.

1.8
This paper is a step towards remedying this. It uses British Election Survey (BES) data, and data re-worked from the original 1972 study, to update our knowledge, and to show that patterns of mobility really are different 30 years later, and therefore that class inequalities have changed and continue to change. However, the paper's intention is go further, showing ways in which the basic model of mobility enshrined in what one might call the 'Nuffield Tradition' is methodologically flawed and an unreliable way of understanding contemporary social mobility in Britain.

Mobility Traditions

2.1
Intergenerational social mobility has normally been taken to involve a comparison between a social (class) origin and a social (class) destination (see Heath 1981; Breen and Rottman 1995). Social origin has typically been defined as the class of the head of household when the respondent was at minimum school leaving age, using occupation as the basis for allocation to a social class. The destination has been taken as the current class of the respondent, again based on occupation. In practice, this has meant comparing the class of the father with that of a son (some of the limitations of this reliance on male mobility data will be addressed below). Where a high proportion of people are found in different destination classes from their origins, this is generally taken as indicating an open society with relatively little systematic class inequality. An open society is regarded as morally desirable, as well as being 'socially efficient' because those with talents, regardless of background, move to fill those positions which require particular talents for their discharge.

2.2
However, the measurement of rates of mobility is less than straightforward. For a start, an important distinction is usually made between 'absolute mobility' and 'relative mobility'. Absolute mobility is a simple measurement of the number of men moving between classes, usually expressed as a percentage of the total, or of a sub-group of origins in the sample. The absolute rate of upward mobility is normally recognised as increasing over time as a result of more men from manual origins being recruited to help fill expanding white collar employment.

2.3
Relative mobility (or 'social fluidity'), on the other hand, compares the likelihoods of men, originating in different classes, ending up in each others' classes (a very clear introduction to this can be found in Breen and Rottman 1995: 100-9). These likelihoods are calculated as odds-ratios, which Goldthorpe (1987:328), for example, regards as the key indicator of social openness. Among age-cohorts in the 1972 study, odds-ratios were shown to be effectively constant over time, when calculated independent of changes in the occupational distributions. The odds-ratios similarities across the age-cohorts were taken to show that relative mobility was not changing over time, and so class inequalities were also not changing.

2.4
In the Nuffield Tradition, this second measurement is usually juxtaposed to the first, simpler measurement, as part of an argument that more absolute mobility actually produces little or no improvement in class inequality. In other words, the fact that more people are now being socially mobile is not the important thing: what matters are the relative chances of upward mobility balanced against the relative chances of downward mobility. As this latter indicator seems not to be changing, this has provided the grounds for arguing that class inequalities are similarly unchanging, and that social class remains as divisive as ever in Britain.

2.5
The paradox between the increasing proportion of mobile people in society, and the static levels of class inequality in terms of comparative likelihoods of achieving certain class destinations, has been a feature of many subsequent accounts. A review of introductory texts such as those mentioned above will confirm that this is the interpretation that has generally been adopted. Whether or not that was the original intention, it has become part of the Nuffield Tradition, which has dominated British mobility research in the last quarter of a century to such an extent that even those who operated outside of it (like, for example, Bob Blackburn, Ken Prandy and Wendy Bottero, Andrew Miles, Tony Fielding, Fiona Devine, Trevor Noble, Geoff Payne, Peter Saunders, Mike Savage and Muriel Egerton) often found much of their own research agendas structured into a dialogue with Nuffield.

2.6
The Nuffield Tradition is problematic in several ways. First, its over-concentration on male mobility (by dealing mainly with data on men, and by allocating married women to the social class of their partners rather than the class that their own occupations would indicate) does not take due account of changes in female paid employment and social class identity. In particular, it fails to pick up those distinctively female elements of occupational mobility that are connected with the socio-economic changes marking the emergence of post-industrial society. The huge growth of female employment in the vastly expanded service sector of industry should not be ignored. However, leaving women out of mobility analysis is not only a severe limitation in that it ignores such a major sociological feature. It also means that the interaction between male and female employment cannot be properly explored.

2.7
Unfortunately it is not possible to compare mobility rates for women back to the 1972 Nuffield Mobility Study, as there are few data for women, not least those treating women as workers rather than wives. In this paper, with its main purpose of connecting with the earlier work, we therefore concentrate on male mobility, including only some very brief comments on female mobility. The purpose of introducing only this truncated account of female mobility in this paper is a very limited one: to demonstrate its importance for an adequate understanding of male mobility. A fuller treatment of female mobility (on which work is in hand) will be necessary in a subsequent paper: mobility analysis techniques, developed for looking at male mobility, perform less well when applied to women (Payne and Abbott 1990).

2.8
The second problem with the Nuffield tradition is a simple methodological one. As has become widely accepted, using cohorts from within a single survey to identify change, is a less reliable analytical method than comparing surveys taken at different times. This is because the former confounds the fact that older cohorts of people have more complete careers as well as careers shaped by different historical events. When we instead compare data from two or more time points, we can hold age constant and so separate out career stage from historical era. The Nuffield message of constant social inequality is based on the finding that odds-ratios were effectively the same for cohorts of older and younger men surveyed in 1972, not on data collected at different times.

2.9
In other words, the evidence base for the claim of continuing class inequality is very weak, so weak in fact as to impugn its validity. The same point can be made about the core thesis of the international comparison in The Constant Flux (Erikson and Goldthorpe 1992). Quite simply, the Nuffield tradition has misled successive generations of British sociologists into incorrect beliefs about class inequalities and mobility. The elementary methodological flaw at the heart of this problem provides another good illustration of the discipline's need for a proper grounding in quantitative research methods techniques.

2.10
Two further problems with the Nuffield Tradition arise from its use of odds-ratios as a method of identifying changes in class inequality. On the one hand, an odds-ratio requires a simultaneous comparison of four origin-to-destination trajectories: from origin 'a' to destination 'x'; from origin 'b' to destination 'x'; from origin 'a' to destination 'y'; and from origin 'b' to destination 'y'. In other words it can involve a simultaneous consideration of those staying in an advantaged class, with those being upwardly mobile into it, with those being downwardly mobile out of that advantaged class, with those trapped in the disadvantaged class. While the odds-ratio provides a useful summary statistic, it is a very complicated way of thinking about class inequality, as well as containing components (upward mobility; downward mobility; maintaining advantage; suffering continued disadvantage) that can each vary independently, but which collectively can work mathematically to mask changes in each other. It follows that studies which have made extensive use of odds-ratios, such as the CASMIN project (Erikson and Goldthorpe 1992) may well have missed underlying components of mobility. The supposed 'trendless fluctuation' may be an artefact produced by the methods used. The gates between the classes may have been opening in a systematic way, with traffic flowing at different rates in both directions at the same time.

2.11
The second question about using odds-ratios is the risk that it may be mis-used to separate out two issues in mobility that are in fact connected. The problem is not that there are different aspects to mobility, but how we handle them. Thus, if there are numerical changes in the occupational groupings used to index social class, then potential opportunities for mobility will also change. The expansion of white collar work and the contraction of manual work ('occupational transition') create the potential both for more upward mobility, and for more inheritance of advantaged class position among the service class. However, as Runciman (1990) has stressed, the change in occupational distribution does not in itself directly cause the observed mobility changes. Separate social processes of recruitment will determine which of the origin classes benefits most from these new opportunities. Observed mobility will be a product of the two components, and as we shall see, while the most common pattern of occupational transition typically does increase the rate of absolute mobility, this is not inevitably so.

2.12
In taking these two mobility conditions into account, one can either juxtapose them as in the Nuffield Tradition, or seek to explore their interactions. Whereas the Nuffield Tradition proclaims the advantage of the odds-ratio as a means of considering class inequality statistically independent of the distribution of classes, it is arguable that one might in addition wish to explore relative class inequality in a way that explicitly takes the class distributions into account. This is in essence a return to an older debate about how much mobility indices should take into account the marginal distributions of mobility tables, rather than trying to control for them.

2.13
Although perhaps not its intention, the Nuffield approach in practice tends to separate the two components of mobility, the numbers of mobile people, and the odds-ratios of class inequality. It is certainly possible to read some commentaries as seeming to imply that relative mobility is more important than absolute mobility. It is, however, essential to see how the two combine: in other words, how the probabilities of origin-to-destination trajectories operate within specific class distributions. Even at a simple level, the idea of 'absolute mobility' in fact expresses a proportion of people in a destination (or from an origin) relative to other people. For example we might note that 50 per cent of those born in the manual class are still in it, or that 38 per cent of the service class come from the manual class. Each statement only makes sense because we are implicitly comparing our target group with others. Equally, although the odds-ratios used to express 'relative mobility' may be statistically calculated independent of the marginal totals, the numbers of people following particular origin-to-destination trajectories are not sociologically independent of changes in the distribution of origins and destinations.

Data and Methods

3.1
The discussion of the BES data that follows therefore uses three types of measurement: the two Nuffield measures (for continuity of analysis), plus disparity ratios which offer a simpler way of comparing origin-to-destination trajectories and include the changing marginal distributions. Although most of these measurements tend to produce congruent representations of mobility from the data-sets, as always we shall encounter some apparent inconsistencies.

3.2
While it is not quite the same thing as a tailor- made study, the British Election Surveys carried out at each General Election are, as Heath and Payne have noted,

nationally-representative sample surveys of the British electorate, excluding Northern Ireland....The BES is the longest-running academic survey series in Britain..... conducted and coded in closely comparable ways (Heath and Payne, 2000: 257).

3.3
Although advocating a degree of caution, the authors make a strong case for using the BES. Some of the comparability of variables in the older BES data-sets restricts what we can use, while as we shall see, the data from the BES for 1997 are a little surprising, and also require caution in their use. In this paper, the BES data for Britain are compared with the earlier Nuffield data for England and Wales (which introduces a slight bias in the results against the present authors' argument: see Payne 1987a).

3.4
The analysis that follows differs significantly from that offered by Heath and Payne. Whereas they relied exclusively on the BES data, and analysed it in terms of cohorts based on decades of birth, excluding all those under 35 but including those in retirement, our concern with the Nuffield Study findings means that we combine the 1972 survey data on men in 1972 and 1983, with BES data for 1987, 1992 and 1997, including all men aged between 20 and 65 (and 20 to 60 for women). Heath and Payne's method gives a better comparison of 'completed' mobility, but by including men well into their retirement, disguises the effects of more recent socio- economic change. The notion of completed mobility has also been questioned by users of the Longitudinal Study, such as Fielding and Noble.

3.5
For clarity of exposition (and also in keeping with parts of Nuffield practice) we shall use only three social class categories: the service class or 'salariat'; manual workers; and the intermediate class that lies between the two (i.e. Goldthorpe Class Schema classes I & II; VI & VII; and III, IV & V respectively). These will be treated as a single hierarchy, a position that recent work on the new ONS Occupational Classification seems to justify (Rose and O'Reilly 1997, 1998) although this is not essential for much of our argument. The occupations used for determining destination class are those current, or last (when the respondent was not currently in paid employment). For ease of exposition, most of the findings have been presented in the form of graphs showing change over time.

Male Mobility trends since the Nuffield Mobility Study

4.1
Each of the following graphs shows the changes in the levels of various types of mobility.

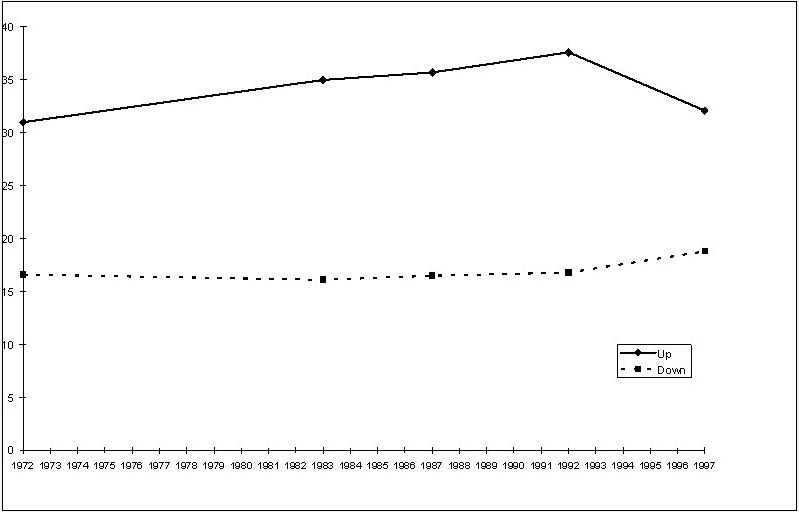
Fig 1: Male Overall Mobility 1972 – 1997(%)

4.2
In Fig. 1, we see that between 1972 and 1997, about 1 in 3 men are in a higher social class than their fathers, and about 1 in 6 are in a lower class Upward mobility does however tend to increase, from 31 per cent in 1972 to 37.6 per cent in 1992, before dipping in 1997. Downward mobility remains little changed, the biggest shift being at the end of the time series. The main trend here is the familiar increase in numbers entering the service class as that class expands, which also allows for high rates of self-recruitment in that class.

4.3
When we disaggregate these core trends, the underlying patterns show themselves to be a little more complicated. For example, class immobility differs between the classes, as Fig. 2 shows.

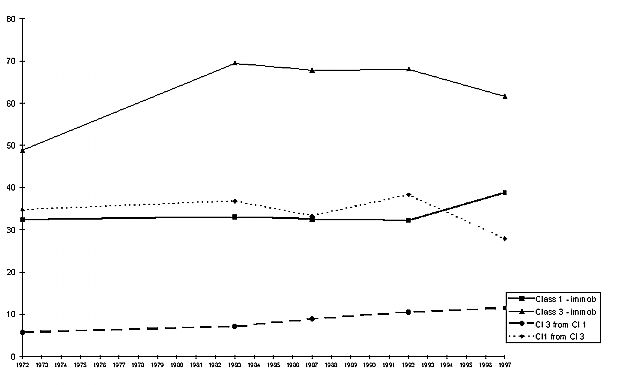
Fig 2: Male Mobility: Service and Manual Classes 1972 – 1997 (%)

4.4
In 1972, the top line shows nearly 50 per cent of those comprising the lower social class had also been born into that class. This jumps sharply to nearly 70 per cent during the 1980s and early 1990s, before dropping to just over 60 per cent in 1997. This seems to indicate that the manual class, which we know is contracting, has for the most part been largely self-recruited; its members representing an increasingly isolated category. In terms of conventional views of class formation, this points towards a potential for the development of a distinctive class culture. However, it is also true that the proportion of the manual class recruited from the service class, though small, rises systematically (the lower line), from 5.7 per cent to 11.5 per cent. This would seem to reflect not so much greater downward mobility per se, but rather that what downward mobility there is becomes an increasing proportion of the shrinking manual class.

4.5
Among the service class there is less sign of fluctuation in self-recruitment, with the level hovering at 32 or 33 per cent until rising to nearly 39 per cent in 1997. The proportion of the service class coming from the manual class , on the other hand, does fluctuate a little, initially rising, dipping in 1987, recovering in 1992, and then by 1997 dropping sharply to below its 1972 level. Taken together, these two trends would seem to suggest that changes in employment opportunity in the service class are met by differential access rates for the sons of the other classes, rather than by any changes in take-up by the sons of service class families.

4.6
As well as these observed movements ('absolute mobility'), we can calculate the comparative probabilities of specific origin-to-destination trajectories occurring, as an indication of class inequalities ('relative mobility').

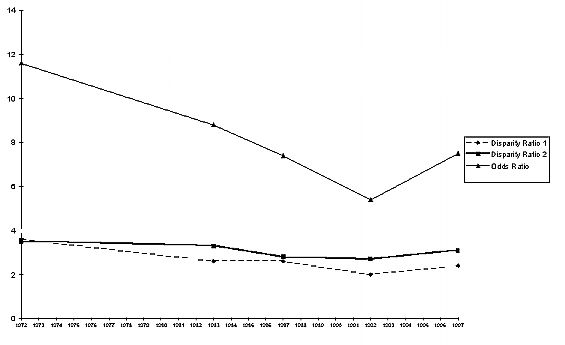
Fig 3: Male Comparative Mobility Coefficients 1972 – 1997

4.7
The lowest line in Fig. 3 shows the disparity ratio for access to service class destinations, between men born in the service class and those born in the manual class, declining until 1992, i.e. indicating a fall in class inequality of access. Thus in 1972, service class sons were about 3.5 times more likely to get service class destinations than were the sons of the manual working class. By 1992, this inequality was down to about twice as likely. Its logical partner, the comparative likelihood of ending up in the manual class for originators in the service and manual class, follows a similar pattern (as the next line up shows). The same basic trend also applies to the odds-ratio for the same origins and destination, but with a steeper change in value, as the upper line shows.

4.8
Although the changes in this particular odds-ratio are the most dramatic (not least because it is always two or three times larger than any of the other odds-ratios), it is not alone in showing a decline from 1972 to 1992, and then a rise. The other odds- ratios describing the advantage of starting in a higher social class generally follow this pattern: in the period to 1992 the fall is systematic for five-sixths of the points, and almost all then increase in 1997. Slightly less coherence emerges from the disparity ratios, where three in four observations fit this pattern. In other words, for the greater part of the quarter century since the Nuffield Mobility Study, relative class inequalities between the three classes and for all destinations have tended to decline, even if in each case, men from the higher social class are still typically more than twice as likely to achieve the better, rather than the less desirable, outcome than their lower class comparators. The gates of access to the higher social classes have opened wider, but those closest to the gates (e.g. sons of the service class) were first through, and equally, show no signs of wishing to travel in the other direction. Whereas we earlier identified the emergence of a second generation 'rump' of manual workers, and strong service class self-recruitment, this co-exists with a decline in class inequality.

Interpreting Male Mobility Trends 1972-1992

5.1
What do these results mean for the British mobility scene? If we deal first with the period from 1972 to 1992, before turning to 1997, the data for the transitions we have examined show two clear changes. On the one hand, the proportions of males being mobile have increased; on the other hand, the comparative probabilities of being mobile have also changed in the direction of greater class equality. These results indicate that Britain became a more open society in this period, even though it was still some way from a state of complete equality of opportunity. Even measured conservatively across three classes, 55 per cent of men were in a different social class than the one in which they had been born (this figure tends to be higher if mobility is measured across a greater number of classes, such as the seven used in the original Nuffield Mobility Study). Over half of the men born in the manual class were upwardly mobile in 1992, compared with just under 39 per cent in 1972. Service class sons' advantages as shown in disparity ratios drops to 2.0 or even lower, while the average reduction in odds-ratios was about one-third, giving the average advantage from being born in a higher social class down from 3.6 to around 2.4. These are substantial changes in a single generation.

5.2
These results are not easily compatible with the Nuffield Tradition. We must be cautious in making this claim, because much of the Nuffield case draws on log-linear models that incorporate the odds-ratios, and is dependent on cohort analysis ending in 1972. Nonetheless we would expect robust finding to be manifest in the analyses we have demonstrated, and they are not.

5.3
Thus it would be difficult to see how we could produce summary evaluations from Figs 1 to 3 that would sound like the conclusions of John Goldthorpe in Social Mobility and Class Structure in Modern Britain when he acknowledges rises in the proportions of mobile males as part of structural change but adds:

When we go on to consider relative mobility rates, and in this way abstract from the effects of this changing structural context, it is then the degree of stability rather than of change that is the more striking. Overall, in fact, a model of 'constant social fluidity' would seem to fit our data rather well …..Systematic shifts were evident in the pattern of absolute mobility rates, of a kind that would be expected from the nature of the changes occurring in the occupational structure. But relative mobility rates, which we take as our indicator of the degree of openness, remained generally unaltered: and the only trends that could arguably be discerned (apart from over the early stages of the life-cycle) were indeed ones that would point to a widening of differences in class chances (Goldthorpe 1987: 86, 328).

5.4
Nor would Marshall's verdict seem to be compatible with our own, even though his comments were addressed in part to international comparisons of mobility rates:

We may have mistaken changes in the shape of the class structure for changes in social fluidity or the degree of openness. In most advanced societies, the post-war years from the 1950s saw…..a growth of professional, managerial and administrative positions. This helped generate substantial rates of mobility (especially upward mobility) overall. But more 'room at the top' has not been accompanied by greater equality in the opportunities to get there….In sum, the growth of skilled white-collar work has increased opportunities for mobility generally, but the distribution of those opportunities across the classes has stayed the same (Marshall 1997: 5).

5.5
Instead, our results seem to have more in common with a later, emerging revision of the Nuffield Tradition. Breen's discussion of his re-survey of mobility in Northern Ireland, for example notes:

a marked tendency for all the odds-ratios in the later tables to be closer to unity than they were in the earlier tables. In other words, a rather weaker association between origins and destinations prevailed in Ireland in 1996 than in 1973 (Breen 2000: 403).

5.6
Even Heath and Payne, whose methods as we noted earlier mean they missed much of the change identified here, also report cautiously that the outcome of their parallel analysis of cohorts of older men in the BES data

is at some variance with the conclusions reached by Goldthorpe et al. (1980) and Goldthorpe and Payne (1986) who had found that fluidity had remained constant across birth cohorts in Britain....(This) may simply reflect the different time periods covered. It is possible that, over the longer time-period available to us, there has been a real, albeit small, increase in the openness of British society that was not visible over the shorter time-period covered by Goldthorpe's work (Heath and Payne 2000, 273-5).

5.7
As observed at the start of this paper, the original interpretation of mobility drawn from the Nuffield work has been reproduced in introductory text books, indeed repeated in successive editions for the last 25 years, and has dominated the profession's interpretation of class and mobility. The new BES data must therefore be seen as a fundamental change to our understanding, rather than just a minor up-dating. Applying the odds-ratio (as the key criterion for measuring social openness advocated by the Nuffield Tradition) to the BES data shows that between 1972 and 1992, Britain became a markedly more open society.

Male Mobility: the Period 1992-1997

6.1
However, as we pointed out above, these conclusions are based on the data for 1972 to 1992: the 1997 survey produced countervailing results. This requires further consideration, because something different seems to be happening around this time point. The distinctive differences between the period up to 1992, and the 1997 survey, must at least initially raise the question of whether we have entered a new mobility era, or whether there is something artefactual in the 1997 data, for example the processes of the data collection or coding.

6.2
With minor fluctuations, the BES data for the period up to 1992 shows an expansion of male white-collar employment. These changes are shown in Table 1, but the table also shows how this trend disappears in the 1997 data.


Table 1: Male Class Distributions 1972-1997 (%)
SonsFathers
123123
197226.425.448.214.528.557.0
198333.626.739.717.929.652.5
198734.826.338.918.731.450.0
199238.424.337.321.227.251.6
199736.428.934.623.635.041.4

6.3
The left -hand panel shows the class distributions from the random samples of sons, with the service class expanding (except for 1997), the manual class contracting, and the intermediate class fluctuating. The abrupt contraction of the service class is somewhat unexpected, because its expansion has been a long-term effect, and one that conceptually seemed integral to the continuing emergence of post-industrial society. It is this service class expansion that has been generally accepted as having fuelled the growth of absolute mobility. However, while the theory of post-industrialism posits an expansion of service sector professions, this cannot go on indefinitely. As Noble (2000) has recently argued, the idea that the service class cannot infinitely expand is an important one for mobility analysis. Although he projects the end of service class growth further into the future, and is mainly concerned with a plateau effect rather than a proportional contraction, Noble's basic position, that a new, less open mobility regime is likely to result, is clearly plausible. The 1997 data could be read as the start of this new situation, with a contraction of the service class being associated with the falls in measured mobility that we have observed.

6.4
In partial support for this view is the fact that, as Iganski et al. (2000) have noted, the Labour Force Survey data for 1999 and 2000 showed virtually no growth in the professional, managerial and senior administrative socio- economic groups compared with earlier in the 1990s. Instead, there has been a continued expansion of other white-collar work (which the authors suggested was reflected in the way that the improving socio-economic position of minority ethnic groups shifted from gains across all white-collar occupations including professional and managerial work, to gains only in intermediate levels of white- collar work). This is particularly true for female employment: as we shall see below, at least some of the apparent decline in the service class is due to looking at only male employment, and ignoring the recent rise of the 'service class woman'.

6.5
It follows that we should not be too sceptical about the 1997 BES data even if the reversals of occupational and mobility trends were unexpected. Further data, such as the 2001 BES, and the Census, will no doubt in due course clarify if Britain has entered a new employment and class structural regime, and it will be possible to debate whether these are cyclical changes or were a more direct result of a long period of Conservative Government policies. Faute de meiux, pending that clarification we intend to proceed, with this note of caution, to analyse the 1997 data at face value as they are reported in the BES data-set.

6.6
As a first step. the changes in the sons' class distribution need to be coupled with what has been happening in the fathers' distribution. The right- hand panel of Table 1 shows the fathers' distribution (which unlike the sons' distribution, is not based on a random sample) being broadly similar. However, among the fathers, the service class proportions continue to grow from 1992 to 1997, while the manual class does not fall in 1992 but then contracts much more sharply by 1997. The idea that the fathers' distribution changes later than that of the sons makes sense: new economic conditions are likely to have more impact on those first entering the labour market than on those established some way into their careers.

6.7
Much of the debate about mobility trends (e.g. see Payne 1987b) has made a great deal of the expansion of white-collar work, and the difference in class distributions between fathers and sons, being sources of potential mobility. This has typically been presented in terms of historical trends in the sons' occupations and classes, rather than the fathers'. However what the BES data in Table 1 demonstrate is that the process of occupational transition also operates among the older generations, albeit with a time lag. A lag effect means that a new pattern among sons can emerge to coincide with the continuation of the old pattern among the fathers. In this case, the sons' service class proportion contracts while the fathers' expands.

6.8
As a result, between 1992 and 1997 the interaction between the fathers or origin distribution, and the sons or destination distribution, sets up new mobility potentials. The number of men who notionally could be upwardly mobile from a contracting manual class declines, while there is at the same time a fall in the proportion of positions in the service class to be filled if upward mobility is to take place. Thus a comparison of service and manual classes in Table 1 shows that in 1992, just over half of the sons had been born into the manual class, and so could compete with the 21.2 per cent of sons born in the service class for the 38.4 per cent of jobs that were in the service class jobs. By 1997, manual sons were only just over 40 per cent of the sample, competing with a slightly increased proportion of service class sons (23.6 per cent) for the notionally available service class job stock which was down to 36.4 per cent. The figures are balanced by an expansion of intermediate class origins and destination. The upshot is a reduction in social mobility as measured by both absolute and relative methods. The mobility 'gates' have begun to close again. We are not currently aware of this regime being discussed before in the literature. Because Heath and Payne (2000) deal only with men aged over 35, and including much older retired men in their cohorts, they miss this new pattern.

6.9
The apparent contraction of professional, managerial and administrative employment seen in Table 1 is of course dependent on the data being only for the male work force. One of the limitations of the Nuffield Tradition's concentration on men is that any mobility discussion couched in terms of the labour market is necessarily restricted. Mobility research needs to consider female mobility both in its own right and in terms of the labour market as a whole.

Female Social Mobility

7.1
We have already indicated why we cannot do full justice to female social mobility in this paper. However, to explore how male class distributions, based on groupings of occupations, are associated with mobility patterns, necessitates at least brief consideration the whole of the labour market, rather than just the male part of it. Although we do not present the evidence here, our preliminary analysis suggests four indicative 'headline' findings. On the basis of a comparison between fathers' classes and those of their daughters (i.e. allocating women to a class in their own right on the basis of their employment position, rather than what the Nuffield Tradition calls the 'traditional position' of treating married women as adjuncts of their husbands' social class), it seems that

7.2
For present purposes it is the last of these that most concerns us.

7.3
Table 2 shows daughters and fathers, in the equivalent way to Table 1's sons and fathers (the small differences between the fathers distributions for sons and for daughters are probably due to the difference in the age ranges used).


Table 2: Female Class Distributions 1983-1997 (%)
DaughtersFathers
123123
198317.649.832.620.127.852.1
198720.448.730.920.428.151.5
199226.546.826.723.228.748.2
199732.044.423.627.635.536.9

7.4
While of course the levels are different from male employment, the left-hand panel of Table 2 shows female service class employment not only rising through the 1980s, but continuing to rise in 1997, and by several percentage points. The apparent decline in service class employment found among men is therefore not evidence of an overall decline in the service class per se, but rather turns out to be drawing attention away from an expansion that has been filled by a new generation of women.

7.5
The main point that needs to be stressed here is that unless a mobility analysis includes both men and women, we are likely to produce a distorted account. Furthermore, women's social mobility needs to be understood in terms of their own employment and social class. If married women were categorised to the social class of their partners, as in the Nuffield Tradition, the evidence of the 1992-1997change would disappear. Not only would we observe 'less social mobility' if we relied exclusively on the finding of men being less mobile in the context of an apparently contracting service class, but that male pattern would be projected onto the women as well. The actual growth in female service class employment, and its impact on female social mobility, would be defined out of the picture. We would be left with no explanation of the decline of male mobility, and might even assume that the service class was actually in contraction.

7.6
Furthermore, while the new structural pattern in 1997 may contribute to depressing men's mobility rates, it potentially increases those for women. When women are allocated to a social class on the basis of their own occupations, it becomes clear that between 1992 and 1997, women continued to experience the pattern of expanding service class opportunity, as compared with their fathers, and between surveys over time, which is the most common one in British mobility tables, except for males 1992 to 1997. This familiar distributional pattern is typically associated with rising absolute mobility, particularly upward, and as we have now seen for men, with greater equality in relative mobility. However, given that we have argued that the recruitment processes for women are not identical to those for men, we wish to stress that we are not at this point saying that female mobility outcomes between 1992 and 1997 were typical of the general picture. (Indeed, our preliminary analysis suggests that recent female mobility takes a distinctive pattern, which in turn reinforces our earlier observation that while an expanding service class normally leads to increased social mobility, this is not an inevitable outcome).

Some Concluding Observations

8.1
The patterns of mobility that we have reported suggest that Britain became a more open society between 1972 and 1992 for men but then the picture changed. On the basis of the BES evidence, opportunities for upward mobility for men decreased in the mid-1990s. The changes in openness are demonstrated both by absolute and relative mobility measures. The gate to the service class was pushed wider open for a while, but then swung-to again.

8.2
But what does 'openness' mean in this context? Inter-generational social mobility helps to describe, in aggregate form, the distribution of individual life chances. It also helps to understand the positioning of social classes within society as a whole, and it is important to recognise that 'openness' operates in different ways for different classes. So during much of the last three decades, the service class experienced a consolidation of its position. The contraction of the manual class reduce service class sons' chances of experiencing downward mobility. Service class opportunities on the other hand expanded, but without its sons taking up most of that expansion. If, following Pawson (1993), we combine this mobility experience (of inter-generational security) with other social trends such as rising incomes, relative job security and the growing legitimation of life styles based on individualistic consumption during the years of Conservative Governments, the result is a sense of class well-being that lasted into the mid-1990s.

8.3
The mobility benefits of an open society for the service class prior to the later 1990s can in a narrow sense be said to have been gained without directly inflicting more damage on the manual working class, because upward mobility from the latter was increasing during this time. The working class was also contracting, so that the society-wide chances of being born working class were reduced, and with a higher proportion of those born into it escaping, the chances of being 'second generation working class' were reduced. However, although the proportion of all men who were second generation working class declined, the proportion of working class men who were second generation increased. Those who did not make it through the mobility gates found themselves locked out for a further generation, in a world where they were rapidly ceasing to be the majority and instead were becoming a minority. This, taken with other features of the 1980s and 1990s like high rates of unemployment, de-industrialisation, the growth of consumerism, and the reconstruction of New Labour Party as a party of the middle class, helps to explain the sense of isolation, betrayal and resentment felt by so many young urban males in towns in the North of England. The re-closing of the mobility gates between 1992 and 1997 have added to this problem.

8.4
It is through an examination of underlying processes like mobility that we can seek explanations of such current 'social problems'. Class still matters. Showing that Britain become more open (for a time) does not alter that: it merely provides a better account of what is actually happening on the ground. The Prime Minister's call to increase 'real upward social mobility' misses the point that mobility is largely determined by class structures and sizes, not least that of the service class, rather than by more tractable factors like educational opportunity. Meritocratic aspirations have to come to terms not only with the long evolutionary periods entailed in organisational reforms in the public sector (Paterson 2001), but the intractability of social structures.

8.5
In this respect, the finding that mobility rates do change over time also raises some fresh difficulties for Peter Saunders' (1996) claim that we already live in a largely meritocratic society, in which occupational class achievement is the outcome of the actual social distribution of 'ability' (however defined). If it were true that only the more able of citizens achieved higher social class, while only the less able ended up in a lower class, then why should mobility rates change, particularly in the short-run such as between 1992 and 1997? For this to happen would entail an underlying shift in the distribution of 'ability', to cause the mobility rate changes. It seems unlikely that the differences in mobility patterns reported in this paper are explained by sudden changes in the distribution of 'ability'. At the very least, we have seen that both gender and occupational opportunity in the labour market seem to be related to patterns of mobility, i.e. that social structural explanations are needed rather than heavy reliance being placed on unsubstantiated claims about individual differences in ability.

8.6
We have already drawn attention to the fact that the social structural picture with regard to mobility is contrary to the reading that has been taken from the Nuffield Tradition. The BES data do not just demonstrate that the Nuffield conclusions, if taken as generalisable statements about social mobility, were inadequate. In a more general sense the BES data indicate that levels of class inequality do vary, either increasing or decreasing, and that this seems to be closely connected to changes in the distributions of the classes.

8.7
In other words, while the changing distributions do not 'cause' the mobility outcomes, they have a very strong association with them. We are not just seeing absolute mobility changing with occupational transition, but also relative mobility rates. This means that the level of class inequality is changing, in a way that seems to be connected in some way to the 'shape' of the origin and destination destinations. These associations are not however, inevitable. The mechanisms that govern what appears to be an emerging regularity remain to be explored: what we can say is that mobility outcomes do not on this evidence seem to be as class determined as was earlier believed, in the sense that class advantage in origin does not seem to be constant.

8.8
The underlying point here is that mobility and immobility do not operate in a vacuum, but in real societies with class structures and recruitment processes. Unless there is some kind of wholesale upheaval, the potential for improving mobility rates, i.e. increasing social justice and efficiency in a more open society, is driven both by the pace of structural social change, and the possibility of such change. If the service class expands, this usually associated with more mobility, but not necessarily so: for instance, when there are service class daughters newly able to mobilise and squeeze out the sons of lower classes. But if the service class does not expand, the likelihood of hardening class boundaries is increased. How possible are government policies designed to control the expansion or contraction of the service class, let alone the social rules of recruitment?

8.9
The driving force for increased mobility is not some vague general logic of industrialism (Payne 1999), but rather much more specific elements of the employment structure (and how these are gendered). In particular, the growth or otherwise of professional and managerial jobs seems central to mobility patterns. The argument that mobility rates show no long term trends may work for highly generalised models of industrialism, but it will require fresh scrutiny now that the significance of these employment changes has been identified. The identification of changes in absolute and relative mobility rates, that has been possible from the BES data, opens up a whole new area of debate within mobility and class analysis.

Acknowledgements

The authors gratefully acknowledge the extensive advice and help given by Dr. David Wright, Department of Mathematics and Statistics, University of Plymouth, prior to the preparation of this paper. An earlier version was given at the Cambridge Social Stratification Research Seminar 2001: the authors are grateful to the participants at this and previous Seminars – not least Bob Blackburn – for their helpful comments, together with those of John Scott and SRO's reviewers. Original data-sets were supplied by the ESRC Data Archive at the University of Essex.

References

ALDRIDGE, S. (2001) Social Mobility. London: Cabinet Office Performance and Innovation Unit.

BLAIR, T (2001) The Government's Agenda for the Future. <http:www.pm.gov.uk/news.asp? News/d=1789§ionld=32>. BOTTOMORE, T. (1965) Classes in Modern Society. London: Allen & Unwin.

BREEN, R. (2000) 'Class Inequality and Social Mobility in Northern Ireland, 1973-1996', American Sociological Review, Vol. 65, No. 3, pp. 392-406.

BREEN, R. & ROTTMAN, D. (1995) Class Stratification. Hemel Hempstead: Harvester Wheatsheaf.

ERIKSON, R. & GOLDTHORPE, J. (1992) The Constant Flux. Oxford: Clarendon Press.

GIDDENS, A. (1973) The Class Structures of the Advanced Societies. London: Hutchinson.

GIDDENS, A. (1997) Sociology. (3rd. Edn.) Cambridge: Polity Press.

GOLDTHORPE, J. (1987) Social Mobility and Class Structure in Modern Britain. (2nd. edn.) Oxford: Clarendon Press.

HALSEY, A and WEBB, J. (Eds.) (2000) Twentieth-Century British Social Trends. Basingstoke: Macmillan. HEATH, A. (1981) Social Mobility. London: Fontana.

HEATH, A and PAYNE, C. (2000) 'Social Mobility' in Halsey and Webb, q.v.

IGANSKI, P., PAYNE, G. and ROBERTS, J. (2000) Social Exclusion and Structural Inclusion: the Socio-Economic Experience of Minority Ethnic Groups. Paper presented at the Cambridge Social Stratification Research Seminar, Clare College, Cambridge.

LEE, D. and TURNER, B. (1996) Conflicts about Class. London: Longman.

MARSHALL, G. (1997) Repositioning Class. London: Sage.

NOBLE, T. (2000) 'The mobility transition: Social Mobility trends in the First half of the Twenty-First Century', Sociology, Vol. 34, No. 1, pp. 35-52.

PARKIN, F. (1971) Class Inequality and Political Order. London: MacGibbon and Kee.

PATERSON, L. (2001) 'Education and Inequality in Britain'. Paper to the Social Policy Section, British Association for the Advancement of Science Annual Meeting: Glasgow.

PAWSON, R. (1993) 'Social Mobility' in Morgan, D. and Stanley, L. (eds) Debates in Sociology. Manchester: Manchester University Press.

PAYNE, G. (1987a) Employment and Opportunity. London: Macmillan.

PAYNE, G. (1987b) Mobility and Change in Modern Society. London: Macmillan.

PAYNE, G. (1999) Does Economic Development Modify Social Mobility? Paper presented to the British Sociological Association Annual Conference, Glasgow.

PAYNE, G. and ABBOTT, P. (Eds.) (1990) The Social Mobility of Women. London: Falmer.

ROBERTS, K. (2001) Class in Modern Britain. Basingstoke: Palgrave.

ROSE, D. and O'REILLY, K. (1997) Constructing Classes: Towards a new Social Classification for the UK. Swindon: ERSC/ONS.

ROSE, D. and O'REILLY, K. (1998) The ESRC Review of Government Social Classifications. Swindon: ESRC/ONS.

RUNCIMAN, W. (1990) A Treatise on Social Theory. (Vol. 1) Cambridge: Cambridge University Press.

SAUNDERS, P. (1996) Unequal But Fair. London: Institute for Economic Affairs.

SCOTT, J. (2000) 'Class and Stratification' in Payne, G. (Ed) Social Divisions. Basingstoke: Macmillan.

WESTERGAARD, J. and RESLER, H. (1975) Class in a Capitalist Society.London: Heinemann.

Copyright Sociological Research Online, 2002