Where Happiness Varies: Recalling Adam Smith to Critically Assess the UK Government Project Measuring National Well-Being
by Jan Eichhorn
University of Edinburgh
Sociological Research Online, 19 (2) 6
<http://www.socresonline.org.uk/19/2/6.html>
10.5153/sro.3280
Received: 16 Apr 2013 Accepted: 29 Nov 2013 Published: 31 May 2014
Abstract
This paper provides a constructive critique of the work on the Office for National Statistic's Measuring National Well-being project. Recalling Adam Smith's work on happiness highlights how the work in this project, as well as most of the dominant work in the field remains based on an economic utility model of well-being, failing to distinguish between individual- and aggregate-based levels of analysis and continuing to postulate well-being as a form of utility that essentially is the outcome of market interactions only. Using data from the first wave of Understanding Society, this paper will investigate the appropriateness of the approach empirically. A breakdown of the variation in life-satisfaction shows that ranking a split of the UK into 36 regions has little meaning, as there is hardly any variation of life-satisfaction at the regional level. Using multi-group confirmatory factor analysis (MGCFA), an alternative way of engaging with the cross-regional analysis is presented.
Keywords: Subjective Well-Being, Happiness, Measurement, Adam Smith, Office for National Statistics (ONS), Multi-Group Confirmatory Factor Analysis (MGCFA)
Introduction
1.1 Two decades of happiness research achieved impact beyond academic discourses. In several countries projects have been undertaken to decide on new sets of measures to evaluate the quality of life taking into account a greater variety of indicators than those relying only on GDP and related concepts. Amongst others, countries as dissimilar as Bhutan, with its gross-national happiness project (CBS 2011), and France, having commissioned the famed Stiglitz-report (Stiglitz et al. 2009), declared that policy shall be oriented towards improving lives of people in economic and non-economic ways.1.2 Most importantly, well-being was not only defined in economic terms, but also did it not just reflect the use of objective indicators. Acknowledging that different people may perceive changes in certain objective life-circumstances in different ways and that therefore their well-being may be affected differently, too, the concept of subjective well-being has gained a prominent place in the discussion. Comprehensive analyses of well-being now tend to take into account subjective evaluations by people about their well-being. These can be based on hedonic approaches, focusing on the prevalence of good over bad moods (Kahnemann 1999) and are found in a large variety of studies based in psychological research (Parducci 1995), usually measured through experience sampling methods (Scollon et al. 2003). Alternatively subjective well-being can be approached as a cognitive concept in which individuals explicitly evaluate their happiness or satisfaction with a particular domain or life as a whole (Schwarz and Strack 1999). This approach is particularly prominent in survey-based research, which lends itself easily to investigations relevant for country - or regional-level analysis, often complementary to objective measures (Frey 2008). Furthermore eudaimonic approaches to understanding subjective well-being are more process-oriented and aim to conceptualise how people lead their lives instead of focussing on particular hedonic or cognitive outcomes (Ryff & Keyes 1995), usually with an emphasis on self-determination and autonomy (Ryan et al. 2008).
1.3 In 2010 the government of the United Kingdom joined these efforts and commissioned a project to the Office for National Statistics (ONS) aimed at the development of more comprehensive measures of national well-being, explicitly including subjective indicators (ONS 2010). The project is of considerable effort, making use of public discussion events and an online-survey based consultation. What appears to be rather progressive at first sight requires a more careful look however. Subjective well-being is not a concept that can only be used in one particular way. Its subjective nature makes it impossible and undesirable to understand it as a uniformly applying idea that could not be employed through different frameworks with varying assumptions and implications associated with them.
1.4 This paper aims to highlight that the ONS project indeed favours a particularised notion of subjective well-being. It will be argued that while widening the concept of well-being with the inclusion of subjective measures, the application thereof remains based on the premise of economic utility as the research and analyses presented by the ONS illustrate. This reflects a choice of a particular approach that is not without alternatives, though it often is portrayed as such. The relationship between utility and subjective well-being could be understood in different ways however, where the latter is not assumed as synonymous or the outcome of particular utility functions. Such an understanding distinguishing between happiness and utility explicitly is not actually a new idea. Approaches championing a comprehensive engagement with subjectivity affecting well-being have been proposed by Adam Smith in his Theory of Moral Sentiments (smith 1790/2009) more than two centuries ago. His work already points to the importance of considering that happiness and well-being may be constituted differently for different groups of people in the first place and that mere comparisons of face-value levels thereof can be misleading. It is worth recalling his comprehensive work to provide a framework to identify concerns with the ONS project to better understand how we can use data from it for genuinely meaningful investigations.
Measuring National Well-being in the United Kingdom
Taking subjectivity seriously: the role of utility
1.5 Thanks to happiness research the acceptance for subjective elements in well-being definitions beyond those related to economic indicators has grown substantially. The ONS (see for example Waldron 2010) does not fail to acknowledge this in their working papers providing the review for the project. However, while subjective well-being has been integrated into many studies, this is usually in the form of experienced utility (Kahnemann 1997). Utility is understood as the personal benefit gained by an individual from a particular interaction or a particular behaviour (in particular in the market place). It is acknowledged by these works and the ONS reports that utility is not just derived from market interactions (as proposed by orthodox microeconomic models; Bruni & Porta 2005: 9) but can be measured meaningfully by subjective well-being measures in conjunction with objective measures. While this reflects an extension of research methodology, most studies (including those cited by the ONS) largely retain the general economic model of market interactions (as well as social interactions modeled in market terms) and utility. Utility is defined as something that has a subjective component attributed to the individual, but the place of this subjectivity in the model remains the same: it is the outcome of efficient market interactions (Spence et al. 2011; Evans 2011). This is somewhat paradoxical as these models do not actually reflect an influence of the subjective preferences on the decision making in the first place, but largely analyse the subjective differences as outcomes of actions taken or circumstances persons are found to be in. The economic models do not change, only the estimation of the utility function does through the measurement of a subjective evaluation. An approach taking subjectivity seriously in a genuine way on the other hand would begin by asking why and how different individuals or groups of people construct their subjective understanding of well-being in the first place.
1.6 Utility-driven approaches however use subjective well-being in a more simplistic way: as long as it is measured consistently (for example through a survey question), the interest is in correlating it to other measures (for example income) and to make summary statements about their relationship. A subjective approach would initially investigate whether such an analysis would be meaningful in the first place and challenge a simplistic approach if different groups of people define what they mean by subjective well-being differently.
1.7 Several contemporary researchers have called into question the applicability of orthodox utility models (Frey & Stutzer 2002: i) attempting to model behaviours as ultimately determined post-hoc following an objective demand and supply driven interaction (Frey 2008). However, the debate about this issue is actually not a new one. While the derived utility approach loosely follows ideas proposed by Jeremy Bentham on how to conceptualise utility (Bentham 1789/1996), it is often overlooked that Adam Smith developed a contrasting approach prior Bentham. Smith unfortunately is often misrepresented as early champion of liberal market economies without state intervention assuming that selfish motivations are the only drivers of human interaction. While Smith talks about the merits of markets and specialisation in the famed Wealth of Nations (1776/1999), it would be a gross simplification and inaccurate to portray his thinking solely grounded on a small selection of the writing in this particular book (Rasmussen 2006; Smith 1998; Tribe 1999). Even in the Wealth of Nations (1776/1999), Smith discusses processes of human interaction that are not based on self-interested individuals resulting in the necessity for state institutions' active engagement. Self-interest is an important factor in Smith's work, however it is not the enabler of every activity. It creates the rationale for exchange and therefore provides the foundation for a division of labour and the enhancement of productivity. Smith never argues though, that self-interest alone determines what choices individuals make. On the contrary, he explicitly suggests that individuals may often choose a path of action that does not lead to the maximisation of their utility, because their concerns for norms and the well-being of others matter to them when taking decisions (1790/2009: 18, 31, 44, 47, 49).
1.8 While Smith presents self-interest as relevant and beneficial, in particular with regards to the spirit of entrepreneurship and the material well-being that can be created through it (192), he also stipulates that economic success and happiness are not synonymous (251). Happiness is considered to be conceptually different from wealth (73, 215). Both are important, but they should come in combination. Based on their experiences individuals are able to evaluate their current situation and anticipate what effects their choices may have for their happiness in the future (20, 23, 56, 59) - a conceptualisation very similar to the contemporary happiness research notion of cognitive evaluations of life-satisfaction (Veenhoven 1984). Smith consequentially stipulates that well-being does not simply depend on objectively determined exchanges in market interactions. The subjective evaluations individuals make within this framework, depending both on the societal setting and their personal circumstances are not merely post-hoc realisations. On the contrary, Smith argues explicitly for a reversed order to the mechanism stipulated in the economic understanding of utility: personal preference or taste, based on subjective experiences and resulting anticipations regarding happiness partially determine what choices people will make (1790/2009: 26). Preferences therefore are not derived from utility, but pre-suppose it. Forms of subjective well-being must therefore not simply be treated as outcomes of other processes of which we may want to compare levels for different groups of people as done in most of the ONS papers cited. Instead, subjective well-being as an outcome has to be distinguished from subjective well-being as a motivating and driving factor that determines the interactions we may wish to analyse. A simplistic utility-driven approach sees the level of subjective well-being of a person as the result of a range of prior characteristics. A different approach emphasising variations in constructions of subjective well-being would investigate how differences in how the ways that certain individuals constitute their understanding of well-being may affect their behavioural decisions in the first place. It allows for decisions to not be based on 'objective' indicators, such as education, income, age and similar socio-demographic characteristics, alone. Instead it enables us to conceptualise how differences in decisions may also be based on different personal preferences based on a range of socialising influences. Traditional utility approaches cannot cater for this. The way the ONS reports suggest we engage with subjective well-being measures focuses on utility approaches however: They correlate objective factors with their measures of subjective well-being,[1] but at no point suggest that it would be meaningful to engage with the question whether differences in the construction of well-being affect the validity and comprehensiveness of those analyses. They therefore frame the usage of the data they produce in a utility-driven way.
Society ≠ Sum of its parts
1.9 Ignoring the differences between these SWB conceptualisations has substantial consequences for the approach to further analyses, the indicators employed in them and the framing of the findings that can be achieved. Most importantly, relying on the orthodox approach to positioning utility, leads to an understanding of societal subjective well-being (at any level of aggregation) as the sum of individual amounts of subjective well-being. Following this approach it does not matter whether relationships between certain factors and subjective well-being are found at the individual or any aggregate level, as they are assumed to be equivalent in character. The ONS working papers do not distinguish between individual-level centred and aggregate-level based studies, but rather mix indicators of well-being at different levels without properly engaging with the analytical issues that arise from this. See for example Beaumont (2011) combining individual level measures, such as personal satisfaction with one's partner and overall neighbourhood satisfaction rates without considering whether satisfaction evaluations at the individual level have to be distinguished conceptually from satisfaction evaluations at the aggregate level. This is only feasible as an approach if individual and aggregate models of subjective well-being are conceptually equivalent. Should this equivalence not exist however, conclusions drawn from work relying on these assumptions would be flawed and policy recommendations potentially misleading, as factors may be identified as relevant that would be operating differently at the individual or societal level respectively. Such a finding would require the use of multi-level analysis structures - currently not taken into account in the design of suggested indicators by the ONS (Evans 2011). In such an approach variables reflecting individual-level and context-level would both be considered as well, but their interplay would be carefully analysed to answer questions about whether particular factors operate in the same way at the individual level as they do on the aggregate level or whether context factors may even affect individual-level ones (for example Eichhorn (2012b) has confirmed findings about personal unemployment having a substantial negative effect on personal life-satisfaction, however country-level unemployment rates do not have the same robust effect on the populations of their countries - finding a relationship at one level does not allow to infer its existence for another level of aggregation).
1.10 Again, Smith, expanding his work on the differentiation between wealth and happiness, already discussed the importance of carefully distinguishing between what appears to constitute well-being at the societal level and what may motivate individuals' behaviour. Smith suggests that individuals may sometimes expect that a gain in wealth may inevitably be reflected in a similar increase in happiness (1790/2009: 52, 211). Accordingly he cautions of an overemphasis on wealth orientation that is disconnected from a concern into the domains that are responsible for happiness:
'This disposition to admire, and almost to worship, the rich and the powerful (. . .), is the great and most universal cause of the corruption of our moral sentiments.' (73)
1.11 While material well-being is desirable and self-interest an important element in achieving it, it does not reflect further aspects of well-being in a society. Smith argues that there must be interaction and exchange through forms of reciprocity and care for others in order for a society to persist and function. This can be achieved through self-interested individuals who support each other only because of this, but a society founded only on this principle will always be less happy, he stipulates, then a society in which the interest in others is a principle that guides individuals' behaviour beyond self-interest (104). In a functional society, its members cooperate, in a happy society they do so not just for egoistic reasons, but because they also internalised norms related to care for others. The well-being of a society is therefore more than the aggregation of the utility its members have and conceptually distinct from individual well-being as there are determining factors at the societal level which are different to the factors that allow an individual to be well - both in terms of happiness and material wealth (103, 106, 108).
Variation in well-being levels and the meaning of well-being
1.12 Having seen the problems with the ONS conceptualisations of well-being through a reflection of the theoretical considerations of Adam Smith, we can now proceed to practically identify the key issues in the way the ONS suggests to use subjective well-being measures. First, we need to ensure that the levels of societal aggregation chosen are meaningful for the respectively proposed analyses. For this, substantial variation has to be found in the measure under consideration across the respective societally aggregated units of analyses (which has usually been ignored so far in the course of the development of the ONS project). This is crucial if one of the stipulated aims, namely the comparison between regions according to their levels of subjective well-being (Waldron 2010), ultimately resulting in a ranking, is to be meaningful. Ranking regions that differ only marginally would be of little interest.
1.13 Furthermore though, when engaging properly with differences in subjective orientations and after establishing that variation exists, it needs to be clarified what this variation precisely represents - something that was not discussed in the papers outlining the considerations used when developing the indicators (see for example Tinkler & Hicks 2011). We have to be convinced that the well-being measures which get employed are equivalent conceptually across different aggregate units. Otherwise variation may represent differences in the composition of individuals making up particular aggregate units, systematic differences between these units beyond the composition or a mixture of both. If any policy recommendations are to be derived from research employing these concepts, the identification of the correct mechanisms which could be addressed, is of crucial importance.
1.14 The empirical section of this paper will provide an illustration of this issue. It highlights the problem of arbitrarily selecting societal units for comparison using a simplistic utility-based approach assuming conceptual equivalence between different units of aggregation and thus relying on contrasting measures that merely summarise mean levels of subjective well-being. An illustrative example is presented to show an alternative way of engaging with the question of what constitutes well-being in particular regions in the UK. In doing so, it actively engages with the notion that well-being should be analysed in its own right first, before it is related to assumed objective indicators in utility-based frameworks.
Data and Method
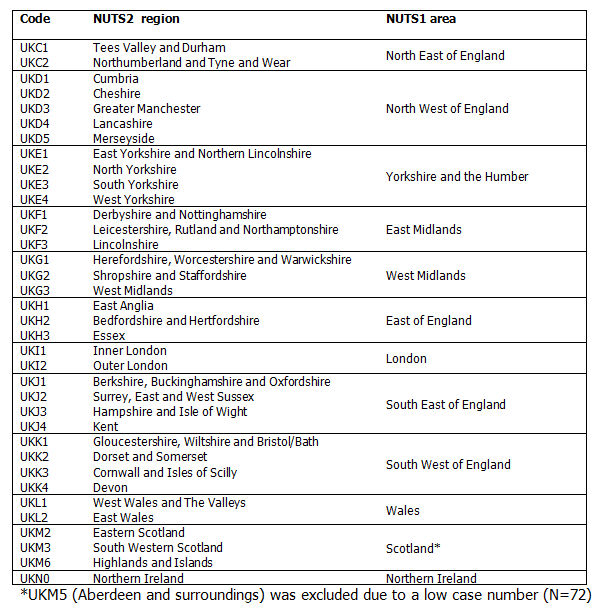
1.15 The work presented here is based on the first wave of the new longitudinal UK survey Understanding Society (2011), which greatly extends the reach of its predecessor the British Household Panel Survey to including over 50,000 in the general questionnaire sample so far. In order to ensure sufficient sample sizes and meaningful aggregate units, the regions for comparison are drawn from the European standardised NUTS2 classification scheme dividing the UK into 37 regions (see Table 1). Out of those only one showed too small a sample size to be usable (72 cases, substantially less after missing values on used variables were accounted for) and could therefore not be included as a comparative area in the analysis (UKM5: North Eastern Scotland, i.e. Aberdeen and surroundings). In all analyses, data is weighted by Understanding Society design weights to ensure adequate representation of the population.
| Table 1. NUTS2 region classification UK |
|
1.16 In order to explore the variation of life-satisfaction across those regions two analyses will be conducted. First, results from a variance component breakdown between the aggregate (regional) and the individual level permits to see the amount of variance that is attributable to the regional level. Second, results from an ANOVA (analysis of variance) post-hoc test will be discussed to show which regions are significantly different from each other in their mean levels of life-satisfaction. Life-satisfaction in Understanding Society is operationalized through the question 'Please tick the number which you feel best describes how dissatisfied or satisfied you are with the following aspects of your current situation. Your life overall.' The response is measured on a 7-points scale (1..7) and responses are approximately normally distributed, although there is of course some censoring at the upper end. However, it has been shown repeatedly that life-satisfaction measures on 10-point and even 4-point scales can be treated robustly as linear variables, in particular when applied in multi-level settings (Ferrer-i-Carbonell and Gërxhani 2004; Pittau et al. 2010) as long as models are not over-complicated.
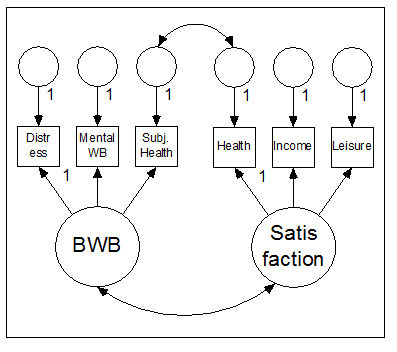
1.17 For the second part of the analysis a multi-group confirmatory factor analysis (MGCFA) approach will be employed.[2] Two latent variables measuring different approaches to conceptualising well-being will be estimated to illustrate the relevance of this approach to both more cognitive evaluations of domains and hedonic manifestations of subjective well-being. The first latent variable will be based on the evaluation of the satisfaction of three domains (satisfaction with one's health, the financial situation one is in and the amount of leisure time one has). The second one will be based on subjective evaluations of body well-being (the results from the General Health Questionnaire distress scale, the score of the short Warwick-Edinburgh mental well-being scale, and a subjective evaluation of one's own general health). While the first variable reflects the explicit satisfaction with different elements of one's life, the second one focuses on subjective measures of one's actual state of physical and mental well-being.[3] Both variables are estimated simultaneously and allowed to correlate with each other. As one would expect, the satisfaction with one's own health and the evaluation of one's general health status are substantially correlated (with r=0.55 overall). The errors of these indicators are therefore also correlated in the model (see Figure 1). After ensuring a sufficient model quality of this model overall, the configural, metric and scalar equivalent versions of the model are estimated in order to identify whether the variables contribute differently to the latent factors for different regions.
| Figure 1. Model visualisation |
|
Results
Life-satisfaction across regions[4]
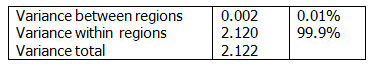
2.1 For any sort of ranking of regions with regards to levels of life-satisfaction making sense it would be necessary to find that there is sufficient variation across those regions. This clearly is not the case. As can be seen from Table 2, only a very minor amount of variance is actually attributable to between-region variation. Nearly all of the variance rests at the individual level. This means that the differences we find between regions here would mainly be attributable to the differences in the composition of individuals in those regions without regional controls.[5]| Table 2. Variance components for life-satisfaction |
|
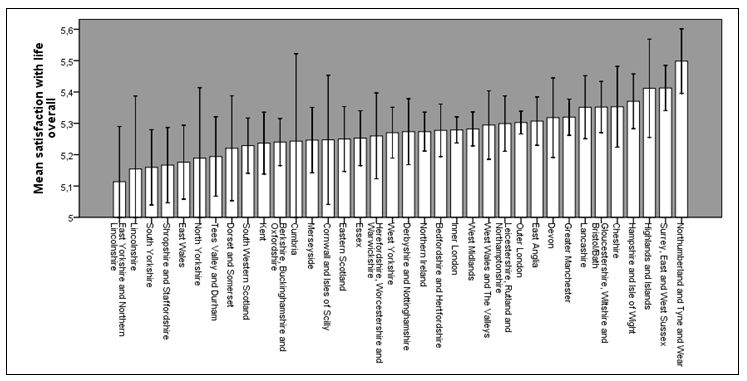
2.2 It is not very surprising then that we do not find many of the regions to have statistically significant differences in their mean levels of life-satisfaction when running an Analysis of Variance (ANOVA).[6] When checking all possible mean comparisons between each region with all other regions, only 'Northumberland and Tyne and Wear' showed any statistically significant differences to a few other regions (two times at the 5%-level and five times at the 10%-level). That means that we would be confident to say that the difference between Northumberland and Tyne and Wear and those seven other regions in life-satisfaction would also be found in the full population based on our sample estimate. In other words Northumberland and Tyne and Wear appears to have a significantly higher level of mean life-satisfaction than the regions with the lowest levels of life-satisfaction. That in turn means that all other regions are not statistically different from each other. In other words, based on our sample we cannot expect to find differences in mean levels of life-satisfaction between 35 of 36 regions in this breakdown. Figure 2 illustrates this well. The 95% confidence intervals for most regions overlap substantially - meaning that there is a high likelihood that the population mean for life-satisfaction of one region falls within the likely range of results for the population mean of nearly any other region. In short, at this level of breakdown of the UK (NUTS2 classification) we hardly find any differences in mean life-satisfaction between regions at all. Reporting a results table with life-satisfaction means, ignoring this and therefore suggesting that some regions would have higher levels of life-satisfaction than others would be highly misleading - as it may imply actual differences between regions that cannot be said to exist based on the data. This however has been done on several occasion in ONS analyses (see for example ONS 2013c).
| Figure 2. Mean scores of life-satisfaction with 95% confidence intervals across UK NUTS2 regions |
|
2.3 When wanting to compare different regions for a particular indicator, for example life-satisfaction, it is crucial to be able to identify a meaningful level of aggregation. The problem with simplistic, orthodox utility-driven approaches is that they often assume a functional equivalence of all levels (as outlined above) and therefore are often used without first considering the appropriateness of a particular level for the comparison. While there are certain levels of aggregation for which mean comparisons of life-satisfaction can be meaningful (ONS 2012a), in this example they clearly are not. When investigating measures of subjective well-being functional equivalence is not given at different levels of aggregation and should not be assumed because of simplistic understandings of well-being and utility.
Configuration of two well-being indicators
2.4 Not finding substantial regional-level variation in life-satisfaction across at this breakdown does not imply that there are no differences with regards to subjective well-being across regions. While life-satisfaction is a useful concept in survey research, it is only one element of a wider construct. Several measurements of well-being have been introduced through survey batteries, all with different foci. Total levels of certain measures may be interesting, but they may not be the only insightful aspect to look at. Apart from varying with regards to the level in different regions, a measure may also vary with regards to what factors majorly contribute to the establishment of it. In other words, in different contexts different factors may be of varying importance for a particular type of subjective well-being. In such an analysis we are also able to investigate whether a particular concept can be considered equivalent across groups or not.
2.5 The model presented here explores two different concepts - one based on satisfaction with different life domains, investigating to what extent they contribute to an overarching factor of SATISFACTION, while the other factor looks at how different forms of subjectively based measures of mental and physical well-being reflect a person's BODY WELL-BEING (BWB). When running the model[7] without any regional differentiation, the model quality results are sufficient to continue the analysis (CFI=0.977, RMSEA=0.036).[8]
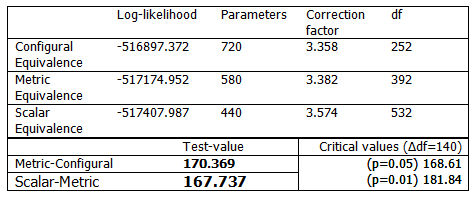
2.6 A multi-group model can be tested for configural, metric and scalar equivalence. Configural equivalence at the basic level allows us to assume that the general factor structure holds across groups, meaning that indeed the three indicators used to constitute each of the two factors (SATISFACTION AND BWB) are related to those factors in all regions. Metric equivalence implies that factor loadings can be considered equal across groups, meaning that the relative importance of indicators for the factors are effectively the same across regions. Finally, scalar equivalence allows to assume item intercepts to be the same, meaning that the estimation of mean values for each of the two factors would be equivalent across regions (thus allowing for comparisons between factor means). Commonly this is assessed using chi-square difference testing. However, in order to be able to use weights in the model a robust maximum likelihood estimator (MLR) has to be used, for which standard chi-square difference testing is inadequate and adjustments are required (Muthén and Muthén 2005). Here the log-likelihood value can be used which functions under chi-square distribution assumptions after scaling adjustments as suggested by Muthén and Muthén (2011).[9]
| Table 3. Equivalence testing for MGCFA on SATISFACTION and BWB |
|
2.7 The results of the equivalence test (see Table 3) are in themselves not fully conclusive. The metric model is just significantly different from the configural model when applying a 5%-significance level and more clearly so when applying a 1%-level. Comparing the scalar to the metric level the difference falls just short of being significant at the 5%-level. Considering that the model quality results were very good already for our base model without any grouping distinction, it is not very surprising to find that the more restrictive models are not substantially worse than the configural one regarding model fit. Furthermore, keeping in mind the marginal nature of the significance values for the differences, it might be worth further exploring whether the difference is mainly attributable to particular regional misspecifications and if so, whether a robust partial metric equivalence could be established. To summarise the results less technically: They suggest that the two well-being concepts presented here (SATISFACTION AND BWB) are rather equivalent across the regions and - potentially after some adjustments - could be used in, for example, a multi-level analysis, if sufficient variation at the regional level could be established. Having said this, it seems that there are some differences between the regions that prevent the assumption of perfect equivalence of factor loadings across all of them. It may therefore be insightful to look into the differences between the regions with regards to the loadings on the two well-being factors (see Tables 4 and 5). In other words we are going to explore whether the constitution of the two well-being indicators differs for people in some regions from others, as our findings from the equivalence tests suggest, instead of relying on simplistic assumptions about equivalence.
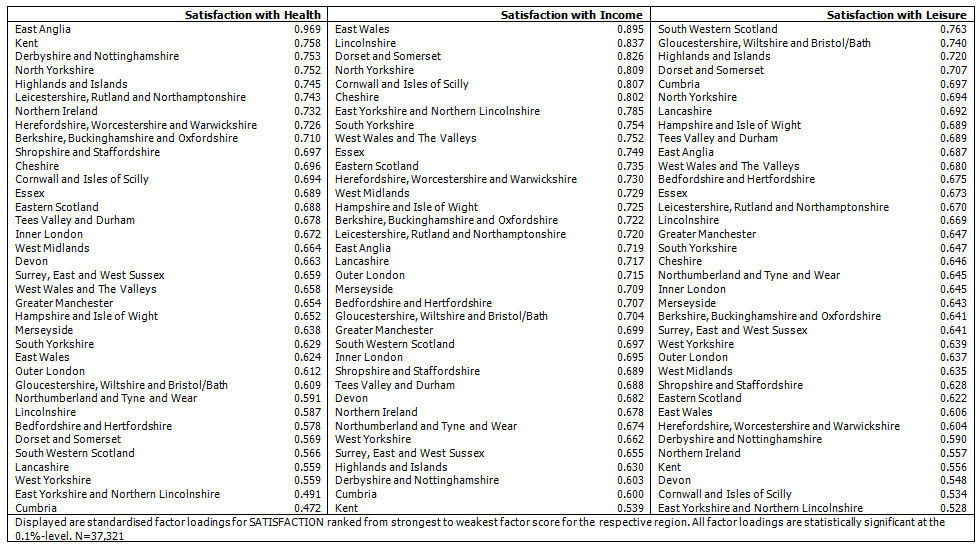
| Table 4. Ranked factor loadings on SATISFACTION across UK NUTS2 regions |
|
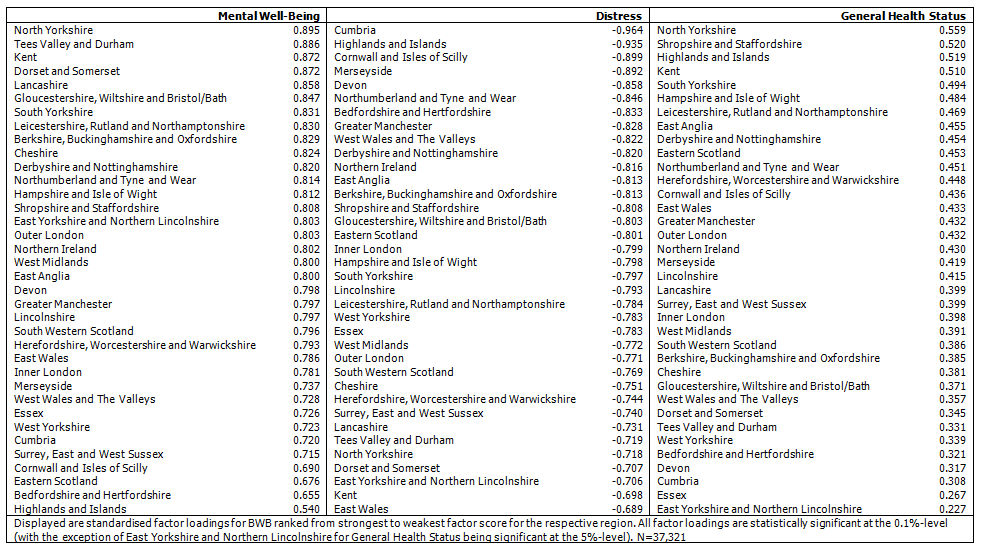
| Table 5. Ranked factor loadings on BWB across NUTS2 UK regions |
|
2.8 The comparison of regions according to their factor loadings allows for some interesting insights. We do see a substantial number of regions, particularly in the middle of the columns that only have very marginal differences between them - probably not warranting to consider that factor loadings actually differ between them, which is reflective of the good quality of the metric equivalence model, suggesting that in most regions the construction of the well-being indicators is rather similar. However, towards the upper and lower ends we find several cases that have larger differences to each other, and therefore also to the majority of cases in the middle and the more extreme cases at the other end of the spectrum. It seems to usually not be reliant on one single case, so at first sight they do not appear to be outliers. Supposedly it is because of these cases that we do find the metric model to be significantly worse than the configural one. A closer look at the values for these cases therefore can reveal that in some regions certain domains may be more or less important in constituting a particular well-being component compared to most other regions.
2.9 For example, looking at the Scottish 'Highlands and Islands' region, we find that both satisfaction with one's health (0.745) and satisfaction (0.720) with the amount of leisure time are much more important variables for SATISFACTION than they are for a very large group of other regions (overall values from the base model are 0.652 and 0.649 respectively). On the other hand, satisfaction with income seems to play a much less important role for the 'Highlands and Islands' region (0.630) compared to the middle range (with a base value of 0.708). However, not only are there some regions that do not fall into the middle range, but when they do not, they can follow different patterns: Just like the 'Highlands and Islands' region, Cumbria has a comparatively low score for satisfaction with income (0.600). While satisfaction with the amount of leisure time is also at the higher end (0.697), satisfaction with health seems to be a more limitedly contributing factor, as Cumbria shows the lowest factor loading (0.472) for this item. These findings suggest that indeed while there are certain general structures, regional differences in the setup of contributing factors to a particular domain of well-being exist and can be analysed. All three items are important contributors to SATISFACTION for all regions (all factor loadings are greater than 0.45). However, which fields of satisfaction are most substantial in constituting overall satisfaction varies across the populations of the regions investigated. Domain-based satisfaction then is not simply an additive concept, but requires taking into account differences in relative importance. An understanding of satisfaction that simply sums scores for satisfaction with certain life domains in all regions would not be reflective of the actually existing structures. Personal evaluations of health, income and leisure reflect different satisfaction models when properly identified with regards to these regional differences. It would therefore not be adequate to use a simplistic utility-driven approach assuming that subjective well-being is derived in the same objective way from particular domains or factors.
2.10 We can find similar types of results also for the BWB measure. North Yorkshire and West Yorkshire nearly act as mirror images of each other here. North Yorkshire shows the highest contribution of mental well-being (0.895) and subjective general health (0.559) to BWB compared to all other regions (with 0.791 and 0.409 as the overall base scores for these items), while West Yorkshire is found towards the lower end of each respective scale (0.723 and 0.339 respectively). For distress the roles are somewhat reversed (though the contrast is not as stark) with East Yorkshire -0.706 and West Yorkshire with -0.783. This example also highlights that a regional breakdown below larger government region classifications is very sensible, as the sub-units within these groupings differ substantially - a finding applicable to several cases. East Wales and 'West Wales and the Valleys' are rather similar with regards to the loading of mental well-being on BWB, however they differ substantially for distress with East Wales showing the lowest loading for this item (-0.689) while 'West Wales and the Valleys' is situated much higher (-0.822). Conducting this sort of analysis helps to investigate whether certain types of aggregations are sensible with regards to a particular question. From these preliminary findings it would seem at least partially questionable whether it makes sense to talk of a domain-based model of satisfaction that contrasts Scotland from other larger UK regions, seeing that the three regions operationalised here differ substantially with regards to factors contributing to SATISFACTION. Similarly, it would probably be only of limited value to treat all of Yorkshire as one contextual framework for which BWB could be treated as a consistent concept.
Discussion
2.11 These findings of course have several implications for the analysis of subjective well-being indicators used to differentiate regions in the UK. However, the analyses are also limited in what they can show at this stage, of course. I have summarised some concerns with the ONS national well-being project and now suggest a more sophisticated approach that moves beyond utility based models of well-being.
2.12 The first part of the empirical section illustrated a very fundamental issue: The existence of variation in levels of life-satisfaction does not allow to infer a variation of life-satisfaction at just any level of aggregation automatically. In this case we find that the variation in life-satisfaction is situated completely at the individual level. Differences at NUTS2 regional aggregation are reflective of this. Keeping in mind that there is aggregate variation at other levels (such as country-level), any level of aggregation must be investigated separately - simple utility-based prepositions about functional equivalence at different levels cannot just be assumed, but have to be demonstrated to exist. While some of the ONS work and subsequent studies have provided regional comparisons that were valid in terms of existing variation in relevant indicators of subjective well-being (ONS 2012a), others were not, because they compared levels of life-satisfaction between regions that could not be considered significantly different from one another (ONS 2012b, p. 18). It may be argued that this is not relevant, because the ONS only produces these results as starting points for academics to continue the work and perform in-depth analyses with the data provided. However, such a response must be considered unsatisfactory, because both of the papers mentioned above have been taken up by a wide range of media outlets and gained popular attention. While the first source indeed allows for an apparently distinguishing comparison of well-being levels across certain regions with a much more detailed breakdown into smaller aggregate units, the latter does not. On its larger-scale breakdown into just a dozen regions differences between regions may potentially all be explained by sampling variation. The differences could not be argued to be definitive and significant. This of course did not stop others using the data to, for example, claim that Londoners have substantially lower levels of life-satisfaction than the rest of the country (nef 2012) - a claim that could not meaningfully be supported by an analysis at this level of societal aggregation.
2.13 Patterns of association found at one level cannot simply be transferred to another one without testing the applicability thereof. As Adam Smith already noted, society is more than its parts. It matters how they are combined and this combination can vary at different societal levels. For the NUTS2 regions there is no significant difference between the regions with regards to the mean life-satisfaction. Rankings of any sort would thus be meaningless. Considering the types of analyses cited in the reports published so far by the ONS, it would not be surprising to see graphs like the ones shown as Figure 2 - without the confidence intervals and with those regions ranked suggesting that some are happier than others. For any such analysis, no matter at what geographic breakdown, the first thing that would have to be demonstrated is a sufficient amount of variation and distinction between the respective units. Of course, there should be investigations into different levels of aggregation. The reason why we do not see any differences may be simply that this paper has not identified the most relevant level of societal aggregation. However, so far there was no word about such tests and requirements in the documents set out describing the work on this project. It needs to become the first step for any analysis that compares UK regions of any sort however and the ONS should emphasise through its report how the data generated through the project could be used most meaningfully - in an approach that does not rely on simplistic utility conceptions, but takes subjective differences seriously.
2.14 The focus on mean levels of life-satisfaction or other indicators of subjective well-being in the ONS project highlights another important issue that gains additional weight after identifying the lack in between-region variation. Subjective well-being is usually conceptualised in terms of experienced utility, an outcome that can be understood through correlation with other factors (such as socio-demographic variables) mainly analysed through regression techniques in which it is the dependent variable (see for example Evans 2011). That however assumes that subjective well-being is conceptually equivalent in all cases. This stands in contrast to the understanding Adam Smith proposes. Subjective orientations are not merely characteristics of individuals reflecting differences in other factors, such as socio-economic standing. Subjective well-being cannot just be analysed in ways that assume it will always be at particular levels when other observable characteristics of individuals are the same. Instead it is necessary to take into account how the respective measure of subjective well-being is constituted and which factors construct it. This understanding that moves beyond the simple notion of an objective approach to understanding experienced utility is missing from the current state of the ONS project. However, it is essential to properly understand how well-being differs across regions, as variation does not occur only with regards to levels, but also with regards to composition of what well-being is.
2.15 Consequentially, even when there is no variation found with regards to an indicator such as life-satisfaction that does not mean that a particular regional framework is meaningless for analyses. There are more insightful investigations that can be conducted than comparing means between regions. As shown in this paper through a simple example, the precise way in which particular indicators contributed to a certain form of subjective well-being at this level of aggregation differed to a substantial extent. After showing that there was a general configural equivalence between regions - a test that should become a requirement for all further comparative analyses with different indicators or at different levels of aggregation - we could identify which NUTS2 regions differed substantially from the majority with regards to the exact composition of a specific well-being domain. These sorts of explorations are helpful as they allow us to understand to what extent we can consider particular groupings as rather homogenous and thus potentially group them together for further analysis or find that to do so would be inappropriate.
2.16 Of course, the results presented here are far from conclusive. Apart from conducting investigations at different levels of aggregation there are many more research opportunities that follow from here. More well-being constructs should be explored. A manifold variety of them exists and has found its way into different surveys that are applied across the UK. Good MGCFA approaches could help us to better understand what domains of well-being matter to which people in which contexts and how together they may contribute to an overall conception of well-being or a good life. This analysis did not relate the two concepts back to life-satisfaction, but of course it would be interesting to explore whether the relation is similar for different domains or not.
2.17 With good materials and a more extensive set of tried and tested well-being constructs at different levels of aggregation there will potentially also be more measures of objective and subjective well-being domains that differ substantially between regions as well. The latent means of variables from these models could be checked for their between-variation and adequate and meaningful rankings could actually be created. Then multi-level modelling approaches would make sense and help us not only to identify which regions, counties, cities, or other relevant geographical units show higher levels of a particular well-being indicator. Much more, we could develop models to aim to identify what systematic aggregate factors are associated with these patterns and how they relate to individual-level variables distinguishing different persons from each other with regards to the same well-being domain. This would actually allow us to develop policy suggestions and use well-being research in a meaningful way by taking subjectivity seriously by incorporating it adequately into our understanding of societal processes. Like Adam Smith has shown centuries ago, it is sensible to distinguish between individuals and different forms of them coming together analytically. Furthermore, it is crucial not only to treat utility and subjective preferences as distinct functions, but also to establish their proper relationship to each other, rather than assuming that one simply follows the other. Subjective evaluations affect people's decisions. They might follow certain patterns, but those patterns vary across different contexts. In order to warrant this attention and elaborate research programs that should be developed, the right instruments are required. This is where the engagement with the existing literature and the new data in the ONS Measuring National Well-being project disappoints so far unfortunately. But as with the initial analyses presented in this paper, there is always room for improvement.
Notes
1The measures used by the ONS are life-satisfaction, happiness, anxiety and evaluations of the life as worthwhile.2Confirmatory factor analysis (CFA) allows to investigate how particular items relate to a hypothesised underlying factor (the latent variable) without assuming any relationship with a particular dependent. Through CFA modelling multiple factors can be estimated simultaneously. Errors are not disregarded, but modelled and their correlation can be modelled to account for collinearity between items. Using a multi-group approach (MGCFA) furthermore allows to analyse whether the composition of the hypothesised factors is equivalent across all groups compared (here regions) or whether there are differences that can be explored (Byrne 2012:193).
3The author acknowledges that both latent variables here are simplifications of more complex concepts with varying practices of engagement by different scholars. The factors are kept simple for this analysis as the main focus of this engagement is the illustration of how one could conduct such differentiating analyses, not the specific results for these particular empirical domains.
4 Calculations done using SPSS 17.
5This is not the case for all levels of aggregation (in a study of life-satisfaction across European and Anglo-Saxon countries for example, Eichhorn (2012a) found over 20% of variance in life-satisfaction at the country level).
6In an ANOVA we investigate how large the differences in a particular variable (here: mean life-satisfaction) between certain groups (here: people living in a particular region) - the variation across these regions - is and whether differences found between particular groups are significant or have a high chance of being results of sampling uncertainty and errors. Results from the post-hoc test are based on Tamhane's T2 test, as homogeneity of variance assumptions were not met and a non-parametric test was required.
7 All MGCFA computations were done using MPLUS 6.11.
8The results reported here are standard model quality measures for the analytical approach used and they meet appropriate thresholds considered as indicators for good model quality, based on a variety of empirical and simulation studies. There were some suggested modification indices relating in particular to some error correlations between indicators, but none were very substantial, like the health satisfaction-health status one accounted for as discussed earlier. Considering the good model quality the theoretical model was therefore applied for the remaining analysis.
9The suggested approach is to calculate an adjustment factor cd specified as cd=(p0*c0 - p1*c1)/(p0-p1), with p-number of parameters and c-scaling correction factor. Finally, the difference test value TRd is calculated as TRd= -2*(L0 - L1)/cd, with L-log-likelihood value.
References
BENTHAM J (1789/1996) An Introduction to the Principles of Morals and Legislation. Oxford: Caledon Press.
BEAUMONT, J (2011) Measuring National Well-being: A discussion paper on domains and measures. Office for National Statistics working paper.
BRUNI L, Porta, P (2005) Introduction. In: Bruni, L, Porta, P (Eds.) Economics and Happiness. Framing the Analysis. Oxford: Oxford University Press. [doi://dx.doi.org/10.1093/0199286280.003.0001]
BYRNE B (2012) Structural Equation Modeling with MPLUS: Basic Concepts, Applications, and Programming. New York and Hove: Routledge.
CBS. (2011) The Centre for Bhutan Studies. Available at: <http://www.grossnationalhappiness.com/> (accessed 19 December 2011).
EICHHORN J (2012a) Happiness for Believers? Contextualising the Effects of Religiosity on Life-Satisfaction. European Sociological Review 28(5): p. 583 - 593. [doi://dx.doi.org/10.1093/esr/jcr027]
EICHHORN, J (2012b) Unemployment needs context: How societal differences between countries moderate the loss in life-satisfaction for the unemployed. Journal of Happiness Studies, doi: 10.1007/s10902-012-9402-y. [doi://dx.doi.org/10.1007/s10902-012-9402-y]
EVANS J (2011) Findings from the National Well-being Debate. Office for National Statistics working paper.
FERRER-I-CARBONELL A, Gërxhani K (2004) How important is methodology for the estimates of the determinants of happiness? The Economic Journal 114: p. 641-659.
FREY B (2008) Happiness. A Revolution in Economics. Cambridge and London: The MIT Press. [doi://dx.doi.org/10.7551/mitpress/9780262062770.001.0001]
FREY B, Stutzer A (2002) Happiness and Economics. How the Economy and Institutions Affect Well-Being. Princeton and Oxford: Princeton University Press.
KAHNEMANN D, Wakker P, Sarin R (1997) Back to Bentham? Explorations of Experienced Utility. Quarterly Journal of Economics 112(2): p. 375-405. [doi://dx.doi.org/10.1162/003355397555235]
KAHNEMANN D, (1999) Objective Happiness. In: Kahnemann D, Diener E, Schwarz, N (Eds.) Well-Being: The Foundations of Hedonic Psychology. New York: Russell Sage Foundation.
MUTHéN L, MUTHéN, B (2005) Chi-square difference testing using the S-B scaled chi-square. Available at: <www.statmodel.com> (accessed 8 January 2012).
MUTHéN L, MUTHéN, B (2010) Difference Testing Using the Likelihood. Available at: <www.statmodel.com> (accessed 8 January 2012).
NEF (2012) London least happy in the UK: Well-being data reveals stark differences across the country. The new economics foundation. Available at <http://www.neweconomics.org/press-releases/london-least-happy-in-the-uk-well-being-data-reveals-stark-differences-across-the-cou> (accessed 12 April 2013).
PARDUCCI A (1995) Happiness, Pleasure and Judgement. The Contextual Theory and Its Applications. Mahwah: Lawrence Erlbaum Associates.
PITTAU M, Zelli R, Gelman A (2010) Economic Disparities and Life Satisfaction in European Regions. Social Indicator Research 96(2): p. 339 - 361. [doi://dx.doi.org/10.1007/s11205-009-9481-2]
RASMUSSEN, D (2006) Does 'Bettering Our Condition' Really Make Us Better Off?: Adam Smith's Thought. American Political Science Review 100(3): p. 309-318. [doi://dx.doi.org/10.1017/S0003055406062204]
SCHWARZ N, Strack F (1999) Reports of Subjective Well-Being: Judgemental Processes and Their Methodological Implications. In: Kahnemann D, Diener E, Schwarz N (Eds.) Well-Being: The Foundations of Hedonic Psychology. New York: Russell Sage Foundation.
SCOLLON C, Kim-Prieto C, Diener E. (2003) Experience Sampling: Promises and Pitfalls, Strengths and Weaknesses. Journal of Happiness Studies 4(1): p. 5-34. [doi://dx.doi.org/10.1023/A:1023605205115]
SMITH A (1776/1999) An Inquiry into the Nature and Causes of the Wealth of Nations. London: Penguin Books.
SMITH A (1790/2009) The Theory of Moral Sentiments. London: Penguin Books.
SMITH V (1998) The Two Faces of Adam Smith. Southern Economic Journal 65(1): p. 1-19. [doi://dx.doi.org/10.2307/1061349]
SPENCE, A, Powell, M, Self, A (2011) Developing a Framework for Understanding and Measuring National Well-being. Office for National Statistics working paper.
STIGLITZ J, Sen A, Fitoussi J (2009) Report by the Commission on the Measrument of Economic Performance and Social Progress. Commission on the Measurement of Economic Performance and Social Progress. Available at: <www.stiglitz-sen-fitoussi.fr> (accessed 19 December 2011).
ONS (2012a) UK experimental subjective well-being estimates. Office for National Statistics. Available at <http://www.neighbourhood.statistics.gov.uk/HTMLDocs/dvc34/Well-being_map.html> (accessed 12 April 2013).
ONS (2012b) Analysis of Experimental Subjective Well-being Data from the Annual Population Survey, April to September 2011. Office for National Statistics. Available at <http://www.ons.gov.uk/ons/dcp171776_257882.pdf> (accessed 12 April 2013)
ONS (2012c) First Annual Experimental Subjective Well-being Results. Office for National Statistics. Available at <http://www.ons.gov.uk/ons/dcp171766_272294.pdf> (accessed 12 April 2013).
RYAN, R, Huta, V, Deci, E (2008) Living Well: A Self-Determination Theory Perspective on Eudaimonia. Journal of Happiness Studies 9(1): p. 139 - 70. [doi://dx.doi.org/10.1007/s10902-006-9023-4]
RYFF, C and Keyes, C (2008) The Structure of Psychological Well-Being Revisited. Journal of Personality and Social Psychology 69(4): p. 719 - 727. [doi://dx.doi.org/10.1037/0022-3514.69.4.719]
TINKLER, L, Hicks, S (2011) Measuring Subjective Well-being. Office for National Statistics working paper
TRIBE K (1999) Adam Smith: Critical Theorist? Journal of Economic Literature 37(2): p. 609 - 632. [doi://dx.doi.org/10.1257/jel.37.2.609]
UNDERSTANDING SOCIETY (2011) Understanding Society. The UK Household Longitudinal Study. Available at: <www.understandingsocietiy.org.uk> (accessed 23 December 2011).
VEENHOVEN R (1984) Conditions of Happiness. Dordrecht: Reidel. [doi://dx.doi.org/10.1007/978-94-009-6432-7]
WALDRON S (2010) Measuring Subjective Well-being in the UK. Office for National Statistics working paper.