Re-Constructing the Map: NBC's Geographic Imagination and the Opening Ceremony for the 2012 London Olympics
by Andrew Shears and Emily Fekete
Mansfield University; University of Kansas
Sociological Research Online, 19 (1) 7
<http://www.socresonline.org.uk/19/1/7.html>
10.5153/sro.3249
Received: 31 Dec 2012 Accepted: 25 Oct 2013 Published: 28 Feb 2014
Abstract
The 2012 Olympic Games was an event watched on television by billions of viewers worldwide. In the United States, approximately 40 million people viewed a tape-delayed opening ceremony of the games on the NBC network. With such a high viewership, NBC was in a position of power to influence and educate their audience on the various countries across the globe who participated in the Olympic Games and opening ceremony. Drawing on Gregory's notion of a 'geographic imagination', we suggest NBC editors put their version of the world on display to the American audience, thus influencing the way in which American viewers may understand the world. In this paper, we have constructed a map to provide a visual representation of NBC's geographic imagination. We find this map, based on total screen time the countries received during the 'Parade of Nations' segment of the opening ceremony, to suggest a unique geographic imagination worthy of further study because of its potential wide influence.
Keywords: Television, Media, London Olympics, National Broadcasting Company, Geographic Imagination, Map
Introduction
1.1 Considered the highest level of global competition for a number of sports and athletic disciplines, televised broadcasts of the Olympic Games attract tremendous audiences. Corporate interests have embraced the event's wide appeal as a vehicle for advertising, with billions spent on Olympic promotion and sponsorships every cycle. To capitalize on the advertisement revenue, the National Broadcasting Company (NBC) paid a reported $1.18 billion to the IOC for exclusive rights to provide all video coverage of the 2012 London Olympic Games to viewers in the United States.1.2 The Opening Ceremony of the London Games was the games' most viewed event with a United States audience of 40 million viewers (Nielsen Company 2012c). In its coverage, NBC took advantage of a tape-delay to edit the ceremony, omitting portions in its broadcast. In one specific case, the 'Parade of Nations,' delegations received screen-time proportional to neither number of participating athletes nor total population of country represented. In a sense, the parade's coverage is a world 'map' drawn by NBC to fit its geographic imagination and widely broadcast. Because, as Derek Gregory (1995: 448) argues 'geography is about more than the will-to-power disguised as the will-to-map,' NBC's position as the monopolized 'cartographer' holds a great power to develop narratives in American culture, and therefore demands significant scrutiny. We argue in this paper that by editing the parade, the 'map' drawn by the amount of screen-time NBC granted to delegations constructed a narrative of each nation's importance on the global stage. As the only coverage available to 40 million viewers, we argue this 'map' will prove influential to American global awareness and therefore requires further investigation.
Understanding TV's Power in Constructing Geographic Knowledge
2.1 Since the U.S.'s first scheduled broadcast in 1928, television has become an important vessel for Americans' consumption of culture. Nielsen (2011b), a corporation that produces viewership statistics used by the American television industry, estimated that there would be 114.7 million households in the United States with television sets in 2012, representing 96.7% market penetration. On average, Nielsen Company (2011a) further reported that Americans average 34 hours and 39 minutes of television viewing weekly. Paul Adams, in his examination of television's place in society, noted:'Television does something that other products of modern culture are increasingly unable to do: it stands at the center.' (1992: 131).
2.2 Situated amidst the cultural conversation, television serves several major roles within the larger American society. Adams argued that:
'[t]hough television lacks a definable location, it serves various social and symbolic functions previously served by places: social congregation, the attribution of value to persons and objects, and the definition of an "us" and a "them."' (1992: 130)
2.3 Though the central importance of television may be waning compared to 1992 because of competing technologies - such as streaming media on computers and mobile devices (Nielsen Company 2012a) - one core element remains the same today: American cultural consumption still strongly depends on the transmission of video imagery. As Adams argues, television creates a convergence of space-time distances by allowing viewers to experience an event or place while being physically absent. Hence, video media providers continue, even in our supposedly decentralized "Web 2.0" society, to hold immense influence over culture by carefully controlling content (see: Morozov 2012; Christophers 2009).
2.4 A memorable dystopic suggestion from George Orwell rings loudly here:
'Those who control the past control the future. Those who control the present control the past.' (Nineteen Eighty-Four, 1949: 23)To Orwell, the past - or more succinctly, a compilation of narratives from contemporary accounts, including media - determines the future, giving those who have power today the privilege to manipulate these narratives to a determined end. Thanks to the wide penetration of television and related technologies in the United States, media companies exert tremendous influence by crafting video content to fit chosen narratives, producing knowledges consumed by wide swaths of the population. Television partially constructs the present - and hence by Orwell's reckoning the past and the future - giving those who control these media outlets tremendous cultural power.
2.5 Here, the media outlet in question was forwarding a geographic imagination through its influence. Derek Gregory's notion of imaginative geographies, which pluralized such spatial imaginations as personal, contextual and changing, is heavily indebted to Foucauldian notions of discipline via discourse. Gregory argued (emphasis in original):
'[Imaginative geographies] articulate not simply differences between this place and that, inscribing different images of here and there, but they also shape ways in which, from our particular perspectives, we conceive of the connections and separations between them. The "global" is not the universal, in other words, but itself a situated construction.' (1994: 204)
2.6 To Gregory (1994: 205), the sociocultural meanings attributed to events - and the 'others' involved in them - were 'produced through contestation and elaboration among differently situated subjects.' Gregory calls this stance the 'world-as-exhibition,' referring to the notion any display of the world will often have some truth within it. Therefore, to Gregory, by accepting certain representations of the world, we deny other ways of knowing space, reflecting situated knowledges that may eliminate particular perspectives. The public socially consumes these constructed and contested representations, distilling in them various 'imaginations' of the world's reality. Cautioning against 'universalizing our own parochialisms,' Gregory suggested that 'enlarging and examining our geographical imaginations' will lead to a better understanding of both humanity itself and our connection to it. The geographic imaginary, in Gregory's sense, is the way in which the world is put on display, as reflective of specific socio-cultural contexts.
2.7 Gregory later deployed Foucauldian thought to examine Edward Said's geographic imagination (1994), to scrutinize why travellers trust advice of fellow travellers over locals (2000), and to persuasively argue that a corrupt geographic imagination was constructed to justify the War on Terror (2004). We draw heavily upon Gregory when we argue that NBC's coverage of the Opening Ceremony was a statement, a larger discursive construction of knowledge based on NBC's own geographic imagination. By displaying the world as they did, NBC not only presented one possible worldview, but also influenced the ways in which the general American public constructs their own knowledge about the world.
The 2012 Olympics: An Exclusive Portal to NBC's World
3.1 Officially titled "Games of the XXX Olympiad," the 2012 Olympic Games in London held 27 July to 12 August. These Games brought together 10,820 athletes with delegations representing 204 nations, to participate in 302 events from 26 different sporting disciplines. The Games' popularity presented a tremendous economic opportunity: exposure to over a billion television viewers, a prize considered so lucrative that host cities pay billions for the privilege, corporations spend millions on sponsorships, and media outlets pay tremendous fees to the IOC for broadcast licensure rights. As the only legal portal for video coverage in the United States, NBC spent millions beyond licensing fees to produce some 5,500 hours of video content for broadcast, cable and online streaming.3.2 NBC's broadcast for the 2012 London Games' Opening Ceremony was made unavailable until primetime hours, effectively prohibiting live viewing of the ceremony by the American audience. The 40 million Americans that tuned in saw a tape-delayed, edited version of the ceremony.
3.3 The ceremony itself was a four-hour, three-act stage show produced by London's hosting committee and directed by Oscar-winning director Danny Boyle. Designed to introduce viewers to the history and culture of London and the United Kingdom, the first act was a nationalistic musical narrative called 'Isle of Wonders.' Following this theatrical performance was the 'Parade of Nations' in which delegations from each competing nation entered and marched around the arena to fanfare and recognition. The 'Parade of Nations' segment provided NBC a canvass on which to paint its 'map' of the world for American consumption. Following Gregory, NBC was in a privileged and situated position with the power to provide a specific representation of the world to its viewers. The world was put on display through the entrance of the athletes as symbols of their specific countries. NBC's broadcast frequently cut away from the parade for advertisements, choosing to pass a number of nations' delegations almost entirely. Despite the tape-delay that allowed for more editing, delegations received variable screen-time based on NBC's editorial decisions. Finally, once the athletes had finished entering the arena, a brief unremarkable third act recalled themes presented during the ceremony to declare the games open.
3.4 By choosing to edit the 'Parade of Nations' in such a way, NBC fell trap to creating a geographic imagination from a specific point of view which may or may not have represented the world fairly. Further analysis of the screen time that was allotted for each country can be used to illuminate NBC's geographic understanding of the world, consequences of which could have an effect on the geographic imaginations of millions of American viewers.
Re-Constructing the Map: Cartographies of NBC's Imagination
4.1 One of geography's most fundamental tools for analysis is the map. A visual representation of space that uses symbols to depict places and their relationships, maps have been valued as an expressive media for thousands of years. As knowledge of the world increased through interconnectivity and as scientific principles were developed, cartographers have become increasingly able to represent, in mathematically accurate proportions, the size and shape of places, the distance between them, and the direction from one to another. The measurable, absolute representational property of scale brought maps to the forefront of the scientific revolution of the 19th century, with scholars like Alexander von Humboldt (1810-13/2012) and Charles Darwin (1859/1998) leading the way.4.2 This tie to science has long lent cartography an air of objectivity, in spite of its necessary cultural contexts. J. Brian Harley (1989) used Foucault's (1972) epistemology as a springboard to deconstruct the map, highlighting the influences not only of a map's producer, but the cultural context in which that producer lives. In spite of this, maps have gained significant public trust as objective representations of space and place. Cartographer Mark Monmonier recognized the danger of this trust, noting that:
'[b]ecause most map users willingly tolerate white lies on maps, it's not difficult for maps to tell more serious lies.' (How to Lie with Maps, 1991: 1)
4.3 Throughout How to Lie with Maps, Monmonier explained - tongue firmly in-cheek - how to make maps that persuade the audience, using propagandizing examples from Nazi Germany and various theatres of the Cold War. Evaluating the cartographer's context and intention is crucial to interpreting maps critically, a point Monmonier made strikingly clear.
4.4 We have argued that NBC's broadcast of the 'Parade of Nations' drew a 'map' of the world fit to NBC's geographical imagination. Of course, this is not exactly literal; there was no useful map drawn on the screen including the entirety of Olympic participation. Instead, NBC provided a quantifiable representation of its geography, found in the number of seconds each delegation was featured on-screen. This measurable information, combined with information NBC provided on its graphics - the number of athletes in each contingent and each nation's total population - provides an interesting dataset for analysis.
4.5 To collect the data, the authors individually watched the 'Parade of Nations' segment multiple times, timing the number of seconds each country's delegation was displayed using standard computer video editing software. The seconds of screen time were recorded in a table and the authors' data was compared to each other to ensure accuracy. Additionally the information that NBC supplied on country population size and total number of athletes from each country were also included on the table for statistical analysis. The number of seconds of airtime was then compared to data on number of athletes, population size, gross domestic product per capita, and 2011 Human Development Index value to see if there were any statistically significant correlations. The data were analyzed using the coefficient of correlation.
4.6 Logistically, the most obvious influence, screen-time, should be representative of the size of each nation's delegation; it makes sense that a larger group of people would take longer to enter an arena than a smaller group. When comparing the number of athletes in each delegation to screen-time received, we calculated a significant correlation of 0.6853. Additionally, seconds of screen-time were not as significant when correlated to the nation's population, gross domestic product per capita, or 2011 Human Development Index value.
4.7 While this statistical comparison suggests a non-random relationship between number of athletes and seconds of screen-time, we argue that it does not suitably explain the relatively well-represented nations NBC largely passed over in favor of advertisements. Instead, we maintain that the best way to dig into NBC's geographic imagination is to re-construct its 'map' using that dataset. We used two cartographic representations to re-construct this imagination one static choropleth map printed here, and an online presentation open to any other 'cartographers' interested in re-constructing NBC's map.
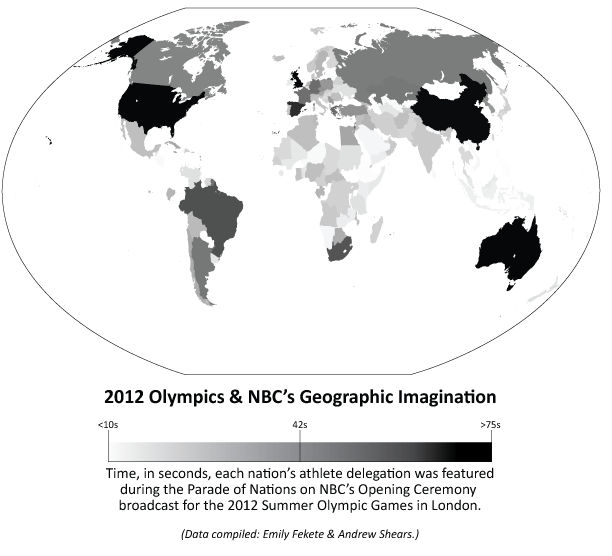
4.8 We constructed the choropleth map (Figure 1) with an equal-area projection, using the number of seconds each delegation was shown on-screen as the displayed variable. We used a continuous grayscale color ramp to display this value; territories of nations without Olympic delegations are filled with white, those with minimal parade coverage are barely shaded, while the most-featured delegations are filled with black. The oceanic background for this map is white, and line boundaries of each 'nation' feature are hidden so that those countries featured less during the broadcast fade into invisibility. This cartographic design is an intentional suggestion that those states shown for fewer seconds are less present in NBC's geographic imagination.
|
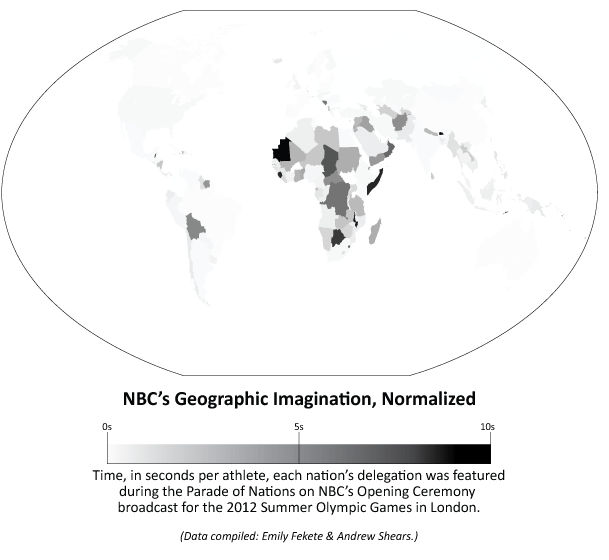
4.9 We also sought to display this data in a fashion that normalized the number of seconds each delegation was featured. The second choropleth map we constructed (Figure 2) shows that while the size of delegation certainly had an impact on the amount of coverage each nation received during the parade, the relationship varied.
|
4.10 Our online data presentation has two important parts: interactive data displays, and accessible data to allow the maps to be further reconstructed. Figure 3 https://tiles.mapbox.com/andrewshears/edit/NBCgeogimagination is an interactive display in which data used to construct Figure 1 can be explored by clicking the participating countries. Likewise, Figure 4 https://tiles.mapbox.com/andrewshears2/edit/NBCsecperath presents an interactive display of data used to construct Figure 2. The shapefile we used to create the maps in each of these figures is available for download from geocommons.com (http://geocommons.com/overlays/402906), empowering GIS users to manipulate all aspects of this reconstruction.
4.11 In looking at the choropleth maps, it becomes obvious where many of the inequalities in representation lie. On Figure 1, Most African and Southeast Asian Nations seem to fade away while many island nations are not even visible on the map. A possible argument could be that the countries with less seconds of screen time may be those with smaller delegations, more likely to be from developing nations found in these areas of the globe. Figure 2 shows that while there is a relationship between the size of delegation and time featured during the broadcast, this case is not absolute. One illustration of this is found in three countries sending similarly sized contingents but receiving drastically different amounts of screen time: Cuba's 110 athletes were on-screen for 33 seconds, Switzerland's 106 athletes were featured for 28 seconds, while Colombia's 109 athletes were shown for just 4 seconds of screen time. Some smaller contingents such as those from Oman, the Former Yugoslav Republic of Macedonia, and the Democratic Republic of Congo were more prominently featured than the number of participants suggested; each represented by four athletes, these countries saw screen times of 24 seconds, 25 seconds, and 22 seconds respectively (See Figures 3 and 4). Clearly, number of athletes representing each country was not the sole determinant for screen time.
4.12 By previously recording and editing the opening ceremony, NBC's editorial staff could have equalized the amount of screen time each country was given. From the map and the examples cited above, it is clear that the network did not do this. Instead they displayed the countries according to their geographic imagination, creating a powerful image in the minds of their viewers in terms of the US audience's global awareness. Whether conscious or not, the impacts of this statement are innumerable. By glossing over some countries while focusing on others, NBC taught its audience a certain geography by constructing an imaginary map where certain places are important, others are not, based on an undisclosed rationale.
An Influential Geographic Imagination Needing Further Explanation
5.1 With exclusive rights to provide video coverage of the 2012 London Olympic Games to viewers in the United States, NBC assumed a powerful position in shaping the American worldview. During Opening Ceremony coverage that attracted 40 million viewers, NBC edited ceremony coverage so that it was shaped to its own geographic imagination. For the ceremony's 'Parade of Nations,' delegations received inequitable treatment because NBC content producers and editors distributed screen-time based on an undisclosed rationale. The parade coverage was, in a way, NBC presenting a 'map' of the world to its viewers. Further statistical comparisons showed a correlational relationship between the number of athletes in a delegation and time the delegation spent on-screen, but not one that can fully explain any claims by NBC to objectivity. No other statistical relationship was found between screen-time and a number of other variables.5.2 To demonstrate the failure of comparative statistics to fully explain this disparity of on-screen coverage, we re-constructed a version of NBC's 'map' of the world. This map, though obviously of our own construction and subject to our own cultural contexts, provides the basis for our argument that NBC's geographic imagination is inequitable and biased. Because NBC's distorted 'map' reached the many U.S. viewers of the 'Parade of Nations,' it will almost certainly impact the larger worldview held by residents of the United States.
5.3 By publicizing an unequal view of the world, NBC has shown its audience that many countries are not worthy of the same level of representation as others. By being the only legal outlet for watching the Olympics in the United States, NBC had great power to influence the way the American audience envisions the world. As Monmonier (1991) writes, maps hold incredible power to not only explain the world in a scientific way, but also to distort the world to serve a purpose or agenda. NBC's 'world on exhibition,' as Gregory would call it, showed the American audience one unique world 'map,' on which relative prominence follows NBC's geographic imagining, informed by an agenda we do not yet fully understand.
References
ADAMS, Paul C. (1992) "Television as Gathering Place." Annals of the Association of American Geographers 82(1): p. 117 - 135. [doi://dx.doi.org/10.1111/j.1467-8306.1992.tb01901.x]CHRISTOPHERS, Brett. (2010) Envisioning Media Power: On Capital and Geographies of Television. New York: Lexington Books. p. 482.
DARWIN, Charles. (1998) On the Origin of Species by Means of Natural Selection, or the Preservation of Favoured Races in the Struggle for Life. London: Oxford University Press. p. 480. (Originally published 1859).
FOUCAULT, Michel. (1972) The Archaeology of Knowledge & The Discourse of Knowledge. New York: Harper & Row Publishers. p. 224.
GREGORY, Derek. (1994) Geographical Imaginations. Cambridge, MA: Blackwell. p. 442.
GREGORY, Derek. (1995) "Imaginative geographies." Progress in Human Geography 19(4): p. 447 - 485. [doi://dx.doi.org/10.1177/030913259501900402]
GREGORY, Derek. (2000) "Cultures of Travel and Spatial Formations of Knowledge." Erdkunde 54(4): p. 297 - 319. [doi://dx.doi.org/10.3112/erdkunde.2000.04.02]
HARLEY, J. Brian. (1989) "Deconstructing the Map." Cartographica 26(2): p. 1 - 20. [doi://dx.doi.org/10.3138/E635-7827-1757-9T53]
MONMONIER, Mark. (1991) How to Lie with Maps. Chicago: University of Chicago Press p. 176.
MOROZOV, Evgeny. (2012) The Net Delusion: The Dark Side of Internet Freedom. Boston: PublicAffairs. p. 488.
NIELSEN COMPANY. (2011a) "State of the Media: Trends in TV Viewing - 2011 TV Upfronts." Nielsenwire (online). New York: The Nielsen Company. Available from the World Wide Web: <http://blog.nielsen.com/nielsenwire/media_entertainment/nielsen-estimates-number-of-u-s-television-homes-to-be-114-7-million/>. Last accessed 27 December 2012.
NIELSEN COMPANY (2011b) "Nielsen Estimates Number of U.S. Television Homes to be 114.7 Million." Nielsenwire (online). New York: The Nielsen Company. Available from the World Wide Web: <http://blog.nielsen.com/nielsenwire/media_entertainment/nielsen-estimates-number-of-u-s-television-homes-to-be-114-7-million/>. Last accessed 27 December 2012.
NIELSEN COMPANY (2012a) "The Cross-Platform Report - Quarter 2, 2012 - US." Nielsen (online). New York: The Nielsen Company. Available from the World Wide Web: <http://www.nielsen.com/content/dam/corporate/us/en/reports-downloads/2012-Reports/Nielsen-Cross-Platform-Report-Q2-2012-final.pdf>. Last accessed 25 December 2012.
NIELSEN COMPANY. (2012b) "Summer Olympics Openers Draw Big Crowds and Advertising Dollars." Nielsenwire (online). New York: The Nielsen Company. Available from the World Wide Web: <http://blog.nielsen.com/nielsenwire/media_entertainment/summer-olympics-openers-draw-big-crowds-and-advertising-dollars/>. Last accessed 26 December 2012.
NIELSEN COMPANY. (2012c) "Nielsen Tops of 2012: Television." Nielsenwire (online). New York: The Nielsen Company. Available from the World Wide Web: <http://blog.nielsen.com/nielsenwire/consumer/nielsen-tops-of-2012-television/>. Last accessed 23 December 2012.
ORWELL, George (1949) Nineteen Eighty-Four. London: Secker and Walburg. p. 326.
SAID, Edward. (1994) Culture and Imperialism. New York: Vintage Press. p. 380.
TYNER, James A. (2004) Made in the Philippines: Gendered Discourses and the Making of Migrants. New York: Routledge. p. 177.
VON HUMBOLDT, Alexander. (2012) Views of the Cordilleras and Monuments of the Indigenous Peoples of the Americas: A Critical Edition. Chicago: The University of Chicago Press. P. 658. (Originally published 1810 - 13).