Multidimensional Deprivation in Contemporary Switzerland Across Social Groups and Time[1]
by Mario Lucchini, Christine Butti, Jenny Assi, Dario Spini and Laura Bernardi
University of Applied Science and Arts of Southern Switzerland & University of Milano-Bicocca; University of Applied Science and Arts of Southern Switzerland; University of Applied Science and Arts of Southern Switzerland; LIVES University of Lausanne; Institut des sciences sociales
Sociological Research Online, 19 (1) 3
<http://www.socresonline.org.uk/19/1/3.html>
10.5153/sro.3260
Received: 5 Mar 2013 Accepted: 28 Oct 2013 Published: 28 Feb 2014
Abstract
We have investigated the phenomenon of deprivation in contemporary Switzerland through the adoption of a multidimensional, dynamic approach. By applying Self Organizing Maps (SOM) to a set of 33 non-monetary indicators from the 2009 wave of the Swiss Household Panel (SHP), we identified 13 prototypical forms (or clusters) of well-being, financial vulnerability, psycho-physiological fragility and deprivation within a topological dimensional space. Then new data from the previous waves (2003 to 2008) were classified by the SOM model, making it possible to estimate the weight of the different clusters in time and reconstruct the dynamics of stability and mobility of individuals within the map. Looking at the transition probabilities between year t and year t+1, we observed that the paths of mobility which catalyze the largest number of observations are those connecting clusters that are adjacent on the topological space.
Keywords: Multidimensional Well-Being and Deprivation, Self-Organizing-Maps, Swiss Household Panel, Transition Probabilities
1. Limits of previous approaches of well-being and deprivation
1.1 There is full agreement in academic research and in policy-oriented debates on considering well-being and poverty as multi-faceted phenomena, hardly captured by a single monetary indicator. As widely discussed in the literature, measuring the well-being of individuals and families implies the adoption of a wider array of items that describe the different aspects of a person's life (Atkinson 2002, 2003). Several studies have documented that there is only a partial overlap between poor income and the experience of deprivation as it is subjectively perceived by individuals (cf. Whelan and Maître 2005).1.2 In the wake of the popularity of the 'deprivation approach' of Townsend (1979) and of the 'capability approach' of Sen (1985), social scientists (Ringen 1987; Atkinson et al. 2002; Whelan and Maître 2005) and international organizations (cf. World Bank 2001; UNDP 2005; European Commission 1992) have shown a strong interest in the comparison of constructs with a high degree of generality and semantic ambivalence, such as social exclusion, vulnerability, precariousness and psychophysical fragility. These concepts should intercept substantial aspects of the life conditions of individuals and families, such as the difficulties encountered in safeguarding health, in realizing achievements in education, in enjoying adequate living conditions, in protecting oneself against risks of the surrounding environment, in being integrated into a network of friends and family, in taking an active part in social life, in being able to achieve freely chosen aims and in experiencing a feeling of self-esteem (cf. Atkinson et al. 2002; Atkinson 2002; Brandolini 2008).
1.3 In general, multidimensional measures are obtained by selecting a certain number of dimensions and indicators which characterize the condition of exclusion from ordinary living patterns, the relevance of which is decided by the researcher in accordance with the current literature (cf. Townsend 1979). The selected indicators are subsequently combined into synthetic indices according to criteria which are affected by a certain degree of subjectivity and arbitrariness (cf. Callan et al. 1993; Hallerod 1996; Ringen 1987, 1988; Mack and Lansley 1985).
1.4 Examples of measures of synthetic macro-level indices are the Human Development Index (HDI) and the Human Poverty Index (HPI), obtained by combining the information related to per capita income, life expectancy and literacy for each country (Bourguignon and Chakravarty 2003). A limitation of these indices is that, being based on national averages, they do not allow us to investigate the distribution of the phenomenon at the individual level. In other words, the macro indices are not able to detect groups which experience increased risks of deprivation and which may require supportive intervention by institutions.
1.5 Recently in this field of study several measures of deprivation were developed which take the individual, rather than the country as the unit of analysis, in order to take into account heterogeneity at the individual level. After having chosen a valid and reliable set of dimensions and indicators for each dimension, researchers adopt a given strategy of aggregation of the indicators in order to obtain a synthetic index. Various strategies have been adopted in order to identify individuals who are poor in multidimensional terms: the simplest is to combine the different indicators of deprivation within a synthetic index, in reference to which a threshold has been fixed for identifying the multidimensionally deprived subjects. As it may be seen, this approach has an obvious weakness in that the multidimensionality is collapsed within a one-dimensional vector. Another way to build synthetic indices is to select a certain number of relevant dimensions which are initially kept separated. For each of the selected dimensions, a synthetic index is constructed, along which is fixed a specific cutoff which distinguishes between those who are deprived and those who are not. The number of dimensions in reference to which each individual is deprived is then counted ('counting approach') (cf. Brandolini 2008).
1.6 Commonly, researchers adopt one of the two following approaches in order to assess who is poor in multidimensional terms: the 'union approach', which considers as poor those who are deprived in at least a single dimension, and the 'intersection approach', which considers as deprived those who are placed either above or below the cutoff point in all of the selected dimensions. Recently, both the union and intersection approaches have been criticized because the former tends to overestimate the proportion of deprived individuals, while the second underestimates it (cf. Whelan et al. 2012).
1.7 In order to improve the methods just described, Alkire and Foster (2007, 2011a, 2011b) propose to set a second cutoff on the minimum number of dimensions in reference to which an individual is considered as being multidimensionally deprived. The Alkire and Foster methodology therefore represents a middle way between the union and intersection approaches.
1.8 The choice of dimensions and indicators, as well as the strategy of aggregation of indicators and dimensions, are particularly delicate aspects and are not free from subjectivity and arbitrariness. The synthetic index, despite being easily understandable for policy makers and media, is ultimately rooted in a counting of dimensions rather than in the way in which the dimensions combine with each other, and generate distinctive forms of multidimensional deprivation. In other words, the synthetic index ends up sacrificing the multidimensionality within a scalar which, by definition, fails to account for the different prototypical forms of well-being and deprivation which characterize the multidimensional space of the data. Expressing multidimensional forms of deprivation requires something more than a scalar quantity. A better strategy is to compress the multidimensional space of data within vectors of elements which express specific combinations of the values of the chosen indicators. This is done by developing a powerful technique through which multidimensional data are classified and visualized onto a rectangular grid, so that observations that are close in this output space have a similar profile. The peculiarity of this method is that it finds latent structures within a multidimensional space of data through an unsupervised learning process.
2. Towards a dynamic multidimensional mapping approach
2.1 As an alternative to synthetic indices based on some method of aggregation arbitrarily chosen, we present a non-parametric and clustering approach - the Self Organizing Maps (SOM) - capable of preserving the multidimensionality contained in the empirical data. The SOM have already been applied in previous work on multidimensional deprivation in order to identify homogeneous clusters of subjects (cf. Lucchini et al. 2007; Pisati et al. 2010; Whelan et al. 2010; Lucchini and Assi 2012). However, in these studies a single wave was taken into consideration, which prevents us from capturing the dynamic aspects involved in the concepts of well-being and deprivation.2.2 In this paper we propose an application of SOM to data coming from wave 2003 to wave 2009 of the Swiss Household Panel. Repeated measurements make it possible to describe how the weight of the clusters varies within the temporal window of seven years, as well as to identify factors which increase or decrease the risk of transition from one group to another.
2.3 Such an approach establishes a robust framework for monitoring the weight of several prototypical forms of well-being and deprivation, each of which expresses a different combination of dimensions which matter most in people's lives over time and within different social groups. Furthermore, we believe that this analytical tool can contribute to designing more effective policies against poverty as an alternative to other, more widely-used, multidimensional measures.
2.4 This paper is organized as follows: Section 3 describes the data and the non-monetary indicators of deprivation on which the analyses will be performed. Section 4 provides a description of the Self Organizing Map, the topological technique that we have adopted in order to preserve multidimensionality. Section 5 presents the main results of the topological mapping: after having identified 400 micro-clusters, we propose a reduction of the output space to 13 macro-clusters. In this section we also study the extent to which some important heterogeneity factors (such as age, level of education, economic poverty, region of residence, family typology) exert an influence on the probability of belonging to the macro-clusters. In Section 6 we investigate how the weight of each clusters changes over time and how individuals maintain or change their social position from one year to the next. Concluding remarks are given in Section 7.
3. Data and Variables
3.1 The data used in the analysis come from wave 2009 of the Swiss Household Panel (SHP), a longitudinal survey conducted annually since 1999 that aims at exploring the dynamics of changing living conditions in Switzerland. The SHP is a project run by the National Science Foundation, the Swiss Federal Statistical Office and the University of Neuchatel. We have chosen the individual as the unit of analysis, although some indicators of well-being and deprivation are collected at the household level[2]. Our analysis makes use of 5956 respondents in reference to which we have selected 33 non-monetary indicators accounting for 9 different dimensions: emotional capital, health, relational support, trust and satisfaction in people and institutions, satisfaction with free time, housing conditions, neighbourhood environment, and material and financial deprivation.3.2 The choice of the dimensions and of the indicators has been made taking into account previous empirical studies on the dimensional structure of deprivation (cf. Layte, Maître, Nolan and Whelan 2001; Whelan, Layte, Maître and Nolan 2002; Guio 2005a, 2005b). In particular, Whelan and Maître (2012) have identified six dimensions of deprivation: basic deprivation, consumption deprivation, health, neighbourhood environment, housing, and access to facilities through the application of factor analysis to a broad range of deprivation items available in the European Union Statistics on Income and Living Conditions (EU-SILC 2009). The focus of our analysis roughly follows the above-mentioned dimensions, with the addition of other dimensions which we consider interesting and which recur extensively in the literature on subjective well-being (Kahneman 2007; Frey and Stutzer 2002; Easterlin 2001), social capital (Coleman 1990; Putnam 1993; Fukuyama 1995) and quality of life (Cantril 1965; Allardt 1976; Andrews and Withey 1976). We refer in particular to dimensions of emotional capital, health, relational support, trust and satisfaction in people and institutions, satisfaction with free and leisure time, housing conditions, neighborhood, environment, material and financial deprivation. It goes without saying that the selection of indicators has, to a large extent, been conditioned by the information contained in the SHP.
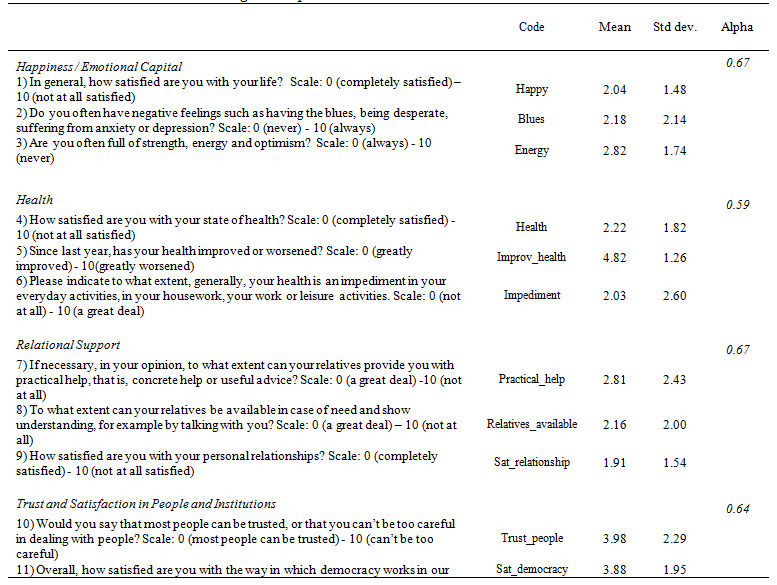
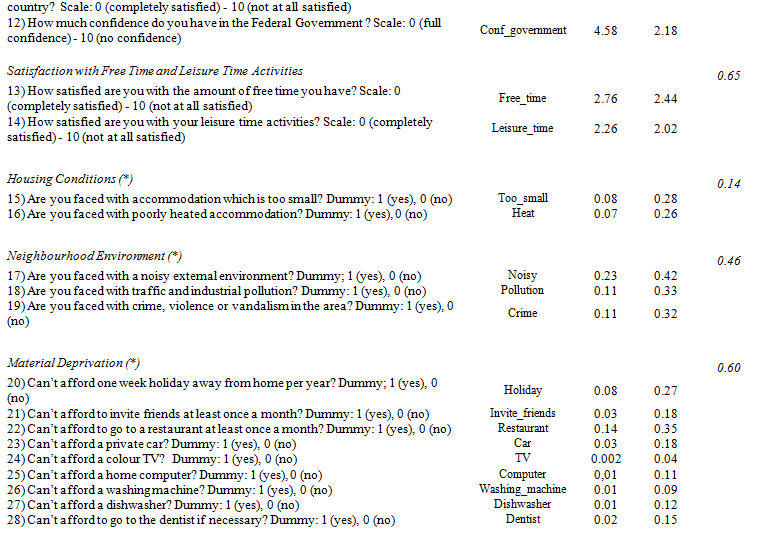
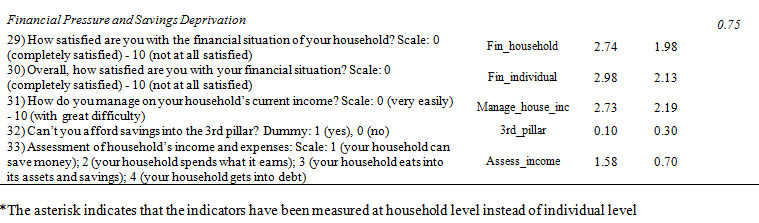
3.3 The indicators have been rescaled so that they have the same direction. In Table 1 we have reported the items, their respective means and standard deviations, and finally the Cronbach's Alpha reliability coefficients relating to each specific dimension.[3] The indicators are measured either at the individual level or at the household level. Since the analysis is performed at the individual level, the properties measured at the household level are associated with each family member.
| Table 1. List of indicators of well-being and deprivation |
|
3.4 The level of reliability of the items selected, measured by using Cronbach's Alpha, range from 0.14 for housing conditions to 0.75 for financial deprivation. We can clearly see how the items which have less discriminating power, are those which refer to material deprivation. This finding is not surprising, as Switzerland is one of the most affluent countries in the world. However, we believe it is important to use these items in the analysis, as they allow us to identify those individuals who, despite being a small minority, are in a state of severe material deprivation in relation to the Swiss standard.
3.5 The dimension of emotional capital is represented by three indicators: satisfaction with life in general, the frequency of negative feelings and the frequency of optimism. The dimension of health is expressed by three items: satisfaction with one's state of health, the improvement or worsening of one's health as compared to the previous year and the presence of obstacles in everyday activities. The dimension of relational support is represented by three indicators which refer to practical help, emotional support, and satisfaction with personal relationships. Three items were selected to represent trust and satisfaction: trust in people in general, satisfaction with democracy and confidence in the federal government. The dimension of free time is described by two items which express satisfaction with the amount of one's free time and satisfaction with the activities carried out in one's free time. To represent the dimension of the housing situation, two items have been selected: having an accommodation which is too small and having an accommodation which is poorly heated. A noisy neighborhood, traffic and industrial pollution, and crime, violence and vandalism in the surrounding area are the three items used to represent the dimension of deprivation in the neighborhood environment. Material deprivation is described by nine items relating to the possibility of going on holiday, of inviting friends to one's home, of going to the restaurant, of seeing a dentist when needed and of being able to afford a private car, a color TV, a home computer, a washing machine, and a dishwasher. These indicators should capture what is labeled in the literature as 'basic and consumption deprivation'. Finally financial pressure and saving deprivation is represented by five indicators relating to the satisfaction with the financial situation of the household, the personal financial situation, the family income management, being able to afford savings into the 3rd pillar, the assessment of household's income and expenses.
The SOM tool
4.1 The Self-Organizing Map (SOM) is a type of unsupervised neural network by which it is possible to visualize high dimensional data on a low dimensional display. The SOM algorithm therefore reduces, through clustering, the size of the data and then projects it on a regular, planar grid. Besides reducing the dimensionality, the algorithm also preserves the topology of the data which means that observations that are close in the input space tend to be close also in the output space. Therefore the SOM is a powerful visualization tool that displays similarities between the identified clusters.4.2 Since its introduction by Teuvo Kohonen in 1982, the SOM tool has been applied in fields ranging from statistics to engineering, signal processing, control theory, financial analysis, environmental studies, medicine, chemistry and experimental physics[4]. Recently SOM analysis has been extended to the study of multiple deprivation in some European countries (Lucchini et al. 2007; Pisati et al.2010; Whelan et al.2010).
4.3 The input data mainly consists of p real vectors x of length n. They represent a matrix of n observations on p variables and are called 'training vectors'. A SOM consists of neural units (or nodes) organized on a regular two-dimensional grid that is called output space or lattice.
| Figure 1. Example of a two-dimensional SOM made of 48 units arranged in a 25x16 hexagonal lattice |
|
Each node is associated with a weight vector m of length n that is called prototype vector or reference vector. The updating of the weight vector is carried out by a learning process which finds the best matching unit mc (BMU) for a given data sample x, such that:
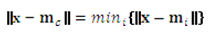
The Euclidean distance is the most commonly used distance measure.
4.4 Through the learning process, the weight vectors are updated iteratively according to the adaptation rule:
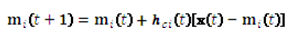
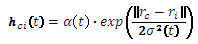
where xt is the input vector randomly drawn at time t, hci(t) is the neighborhood function around the winner unit c. The neighborhood function is a smoothing kernel that tends to zero when time tends to infinity. It is a function of the distance between: (a) the location vector of the node that corresponds to the BMU (rc ∊R2) and: (b) the location vector of the node i (ri ∊ R2). The starting values of mi(0) can be chosen at random. The function hci(t) can be chosen in different ways such as:
- hci(t) = α(t) if i ε Nc and zero otherwise. Nc is a neighborhood set of points around node c. The value of α(t) is the learning-rate factor at time t (0 < α(t) < 1) that decreases monotonically with time along with the radius of Nc. If the map is not large, that is up to a few hundred nodes, the choice of α(t) is not crucial. However, if the map is large it is convenient to choose α(t) as a function that is inversely proportional to t.
- where the value of α(t) is, again, the learning-rate factor at time t and σ(t) corresponds to the width of the kernel.
4.5 The training is performed in two phases. The first phase is characterized by a wide neighborhood radius (close to half the diameter of the network) and by a large learning rate (close to 1). A progressive decreasing of both the learning rate and the neighbourhood radius characterizes the second phase. The number of iterations necessary to reach convergence depends on the number of neural units rather than on the dimension of the input matrix.
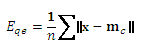
4.6 After training the SOM network, its quality must be evaluated. Usually two errors (quantization and topographic) are calculated. The quantization error Eqe takes values in the interval [0,1] and it measures the average distance between each data vector and its best matching unit (BMU).
Results
5.1 The analyses were carried out using the SOM Toolbox for Matlab 5 (Vesanto, Himberg, Alhoiemi and Parhankangas 2000). We reduced a multidimensional space (1.31072E+22) into a two-dimensional rectangular array (25 x 16) made up of 400 micro-clusters. At the end of the training process, each observation is allocated to its final BMU and the quality of the SOM is evaluated by using the 'quantization error' and the 'topographic error' (Kohonen 1982, 2001). Our SOM exhibits a normalized quantization error equal to 0.038, meaning that, on average, each element of the input vector differs from its corresponding best-matching-unit weight by 3.8 percentage points and a topographic error equal to 0.142%, meaning that only about nine observations are affected by some degree of 'topological misplacement'.5.2 Weight vectors were initialised using the linear method and the SOM training was carried out in two phases: a 20-epoch ordering phase, based on a large initial value and a fast decrease of both the neighbourhood radius and the learning rate, and a 100-epoch fine-tuning phase, based on a slow adjustment of both the neighbourhood radius and the learning rate. In both training phases, a Gaussian neighbourhood kernel was used (Kohonen 2001).
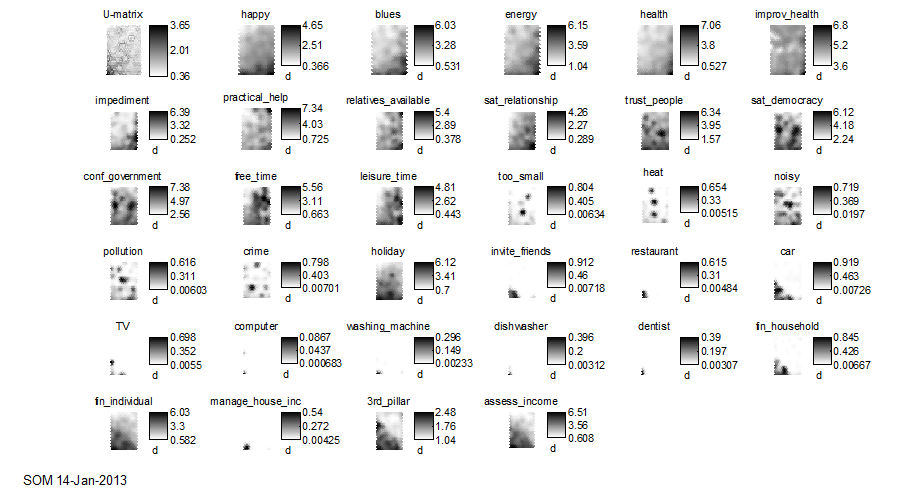
5.3 To understand the configuration of the trained SOM, we visually inspect its component planes shown in Figure 2. Component planes are a type of graph which illustrates the value taken by a given element of the weight vector in each SOM unit. Looking at the component planes, we may observe that the units take on a different shade of colour: black units are specialized in recognizing disadvantaged people in reference to a given item, while white units capture the advantaged ones. The units between the maximum advantage and the maximum disadvantage are represented by different shades of gray. The values of components are denormalised so that the values shown on the colour bar are in the original value range.
5.4 From the component planes, it can be seen that the emotional capital items are very closely related. The units which take on the darker shades and which therefore recognize those individuals who are the most unhappy, are concentrated in the portion at the bottom right of the map. The component planes for indicators of poor health also reveal a concentration of black units in the same region of the map: a sign that the dimensions of health and happiness correlate to some extent. The indicators of relational support instead show distributions of black units at different points of the map, with an emphasis in the bottom right and top right corners. The black units referring to the indicators of trust in others and institutions assume a random configuration. The same applies to the housing and neighborhood environmental items, which are distinguished by the fact that black units form small, spatially dispersed clusters. Dissatisfaction with leisure time is well represented by the units which make up the center-right area of the map and the region in the lower right. A small group placed at the bottom left represents individuals who live in conditions of severe material deprivation. The items regarding financial deprivation, instead, generate a large cluster of black units positioned in the lower left of the map. As has already emerged from the descriptive statistics, indicators of financial deprivation show a higher discriminative power than indicators of material deprivation.
5.5 According to the conclusion drawn by Serge Paugam (2005), these results confirm that poverty in Switzerland is a marginal phenomenon; in fact those that can be defined as poor in the strict sense represent a small segment of the population.
5.6 From the inspection of component planes a complex dimensional structure of the phenomenon arises. If similar patterns had emerged from the visualization of component planes, we would have concluded that a synthetic index was a good analytical choice. In this case, the index would have adequately preserved the information contained in the data space. Since, instead, the indicators representing different dimensions generate component planes that do not overlap, the implementation of the synthetic index would dramatically simplify the information contained in the multidimensional space.
| Figure 2. Component planes for some representative indicators of deprivation (the variable labels are the same as in table 1) |
|
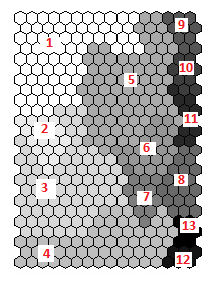
5.7 Since the description of the four hundred microclusters which make up the map would be too detailed and unusable for policy makers, we propose a reaggregation of the units into macro-clusters by using an agglomerative clustering technique based on the average linkage method. Figure 3 displays the results of this operation. We opt for 13 macro-clusters which are highly homogenous internally, as this solution appears to offer a reasonable balance between parsimony and precision. The partition of the output space into a smaller set of macro-clusters can easily be achieved thanks to the topological properties of the map. We decided to work at this level of aggregation since a noticeable gap between adjacent coefficients in the agglomeration schedule is observed exactly when the number of groups is equal to 13. Moreover, such a limited number of clusters makes it possible to observe differences among groups without getting into a level of detail that would make the interpretation difficult.
| Figure 3. Reaggregation of the 400 units into 13 clusters |
|
5.8 The next step is to interpret the macro clusters by examining the component mean deviations. In order to better understand the cluster's profiles, we have adopted a procedure reported in appendix 1. We transformed the component mean deviations into an alphanumeric code consisting of symbols '+' and '-'.
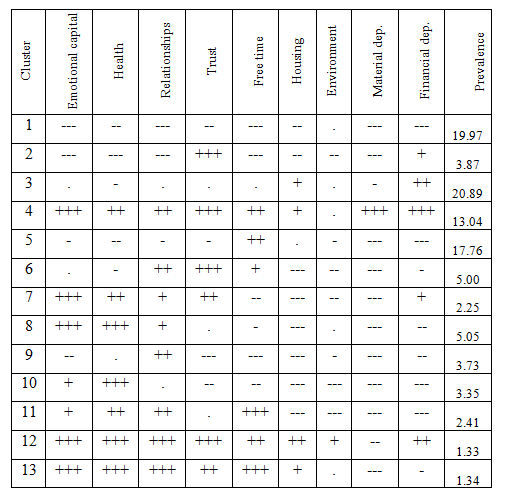
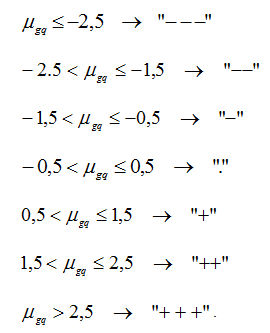
5.9 In table 2, the number of symbols in the alphanumeric code expresses the intensity of deprivation: the higher the number of plus symbols, the more deprived are the people belonging to a specific cluster; the higher the number of minus symbols, the better are the well-being conditions of people belonging to a specific cluster. The '.' symbol indicates a level of deprivation that follows the average profile of the sample.
| Table 2. Profile of SOM clusters in terms of deprivation dimensions |
|
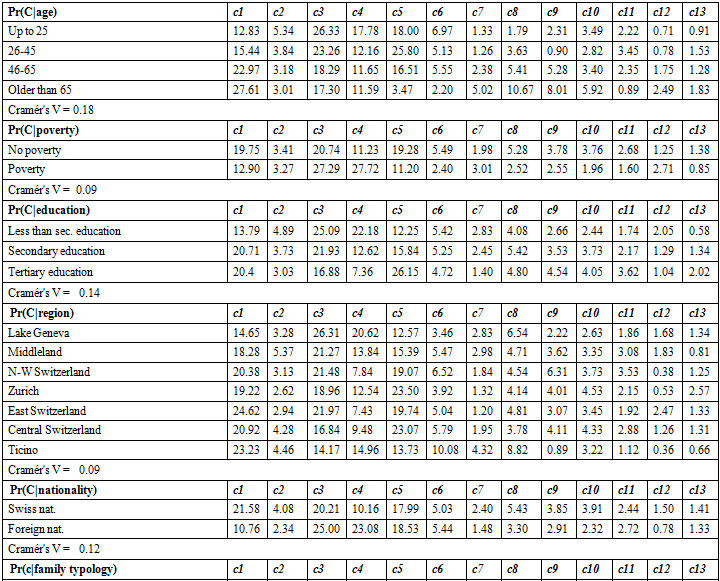
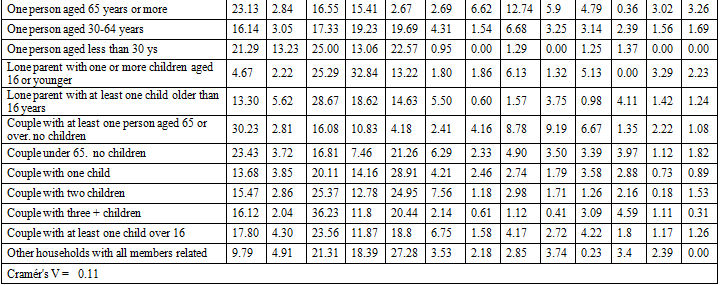
5.10 Below is a brief description of the profile of each cluster. These descriptions are based both on active variables used in the segmentation (see table 2) and on socio-demographic characteristics such as age, income poverty, education, region of residence, nationality and family typology (see table 3).
| Table 3. Probability of cluster membership conditional on some important heterogeneity factors |
|
- Cluster 1 brings together 20% of sample observations and expresses a state of multidimensional well-being. The individuals within this cluster show strong negative deviations from the average with respect to most of the dimensions discussed. The probability of belonging to this cluster increases as people age, for people with at least secondary education, that are above the poverty line[5], with Swiss nationality, resident in the East Switzerland and Ticino regions, living in the couples with at least one person aged 65 or over and without children.
- Cluster 2, with 3.9% of the cases, shows a similar profile to cluster 1, at least regarding the dimensions of happiness, health, relationships, leisure, housing conditions and material well-being. It differs, however, in relation to the dimensions of trust and financial deprivation. The members of this cluster show levels of trust in other people and institutions which are significantly lower than average, as well as a slightly higher level of financial deprivation. Young age, low level of education, being a 'one person aged less than 30 years old', having Swiss nationality and living in Middleland are characteristics that increase the chance of belonging to this cluster.
- In cluster 3, comprising the largest number of observations (20.9% ), there are individuals with a level of health and material well-being that is slightly higher than average. In the remaining dimensions, these individuals roughly follow the average profile. Another distinguishing feature of this group is a certain degree of housing and financial vulnerability. The latter appears to be more intense than in the previous cluster. The probability of belonging to this cluster monotonically decreases with age and level of education while it is relatively higher for individuals below the poverty line, with foreign nationality, that are in couple with three or more children and living in the Lake Geneva region.
- 13.0% of the cases compose cluster 4, which we have classified as a group of cumulative deprivation. The members of this cluster show a clear disadvantage with respect to the dimensions of emotional capital, financial and material deprivation and trust in people and institutions. Other noteworthy differences concern health, relational support, leisure time and housing conditions. The dimension of neighborhood environment roughly corresponds to the average profile of the sample. Young age, income poverty, low level of education, foreign nationality, being a lone parent with one or more children aged 16 or younger, living in Lake Geneva are characteristics highly predictive of cluster membership.
- In cluster 5, which brings together 17.8% of the records, we observe negative deviations in almost all of the dimensions (that is a condition of cumulative well-being). Dissatisfaction with free time represents the only problematic dimension. It follows that this cluster can be classified in the region of multidimensional well-being and, not coincidentally, is spatially adjacent to cluster 1. The probability of belonging to this cluster increases monotonically with the level of education; it is relatively higher for people with age between 26 and 45, for those that are above the poverty line, that are in a couple with one or two children, who live in Zurich and Central Switzerland.
- Cluster 6, which represents 5.0% of the sample, includes individuals with a lower level of relational support and a lower degree of trust in other people and institutions. Furthermore, there is a slight dissatisfaction with free time and leisure time. In the other dimensions - health, housing, neighbourhood environment, material and financial deprivation - the deviations are all negative, indicating that those who belong to this group enjoy a state of relative well-being. The probability of belonging to this cluster is higher for subjects up to 25 years, that are above the poverty line, in a couple with two children and who live in Ticino. Education and nationality show a slight degree of discriminating power.
- Cluster 7 brings together a small percentage of observations (2.3%). Here we find relatively well-off individuals in the areas of leisure time, housing, neighborhood environment and material resources, but who show some vulnerability in relation to happiness, health, finance, trust in people and institutions. The membership to this group is relatively higher for older people and for individuals who are in a condition of economic poverty. Being 'one person aged 65 years or more', having a low level of education and living in Ticino are attributes associated with this cluster.
- Cluster 8 consists of 5.0% of the observations, and may be labeled as a group with psychophysical fragility. Those within this group show deprivation in the dimensions of emotional capital, health and relational support, while they are satisfied with housing, free time, material and financial resources. As expected, the chance of belonging to this cluster is relatively higher for older people, for 'one person aged 65 or more' and for those living in Ticino.
- In cluster 9, which constitutes 3.7% of the sample, we find subjects who experience a condition of multidimensional well-being, that is, they show negative deviations with reference to all of the dimensions examined. The only exceptions are the condition of health, which roughly follows the average profile, and the relational aspect, which shows a marked positive deviation.[6] The probability of belonging to this cluster is relatively higher for people older than 65, for those above the poverty line, with a higher degree of education, who live in North-West Switzerland, who have Swiss nationality and who live in a couple with at least one person aged 65 or over without children.
- Cluster 10, which contains 3.3% of the observations, expresses a strong deprivation on indicators of health and emotional capital, while the remaining dimensions show opposite signs. Similarly to cluster 8, this cluster may also be labeled as a group with psychophysical fragility which is accompanied by a state of economic well-being. The socio-demographic characteristics that predict the membership to this cluster are: old age, living in a couple with at least one person aged 65 or over, without children, Swiss nationality, a high level of education and being above the poverty line.
- In cluster 11, which comprises 2.4% of the sample, we find individuals with a profile that is quite similar to the previous cluster, but which differs as regards the dimensions of relationship and free time, which show a positive deviation from the sample mean. The attributes associated to this cluster are: a higher level of education, age between 26 and 45 years, being above the poverty line, having foreign nationality, being in couple with three or more children and living in North West Switzerland.
- Cluster 12, equal to 1.3% of the sample, is similar to cluster 4 and therefore may be labeled as a cluster of multiple deprivation. In this cluster there are individuals who show strong positive deviations in the dimensions of happiness, health, relational support and trust with the exception of material deprivation. Also, seemingly of note are the positive deviations in the dimensions of free time, housing and financial situation. The probability of belonging to this cluster increases as people age. Moreover, economic poverty, low level of education, Swiss nationality, living in East Switzerland, being one person aged 65 years or more and being a lone parent with one or more children aged 16 or younger increase the probability of belonging to this cluster.
- Finally, cluster 13, which includes 1.3% of the sample, combines subjects in conditions of relative material and financial comfort which nevertheless show marked signs of deprivation with reference to the dimensions of happiness, health, relational support and free time. Within the dimensions of trust and housing, a certain degree of deprivation may also be observed. The appurtenance to this cluster is positively associated with age, level of education and being 'one person aged 65 years or more'.
- The results of the analysis are, in a nutshell, that about one in two Swiss enjoys a state of multidimensional well-being (those belonging to clusters c1, c5, c6, c9), one in four shows signs of financial vulnerability (clusters c2, c3, c7), one in seventh falls into conditions of multiple deprivation (clusters c4 and c12), and finally about one in eight is in a condition of psychophysical fragility (clusters c8, c10, c11, c13).
- It is worth noting that the complex semantics of the 13 clusters identified cannot be preserved within a synthetic index that actually ends up sacrificing multidimensionality. From a simple counting of the number of indicators / dimensions on which the subjects are deprived, it is not possible to infer the variegated forms of well-being and deprivation that we have obtained with the use of the SOM. A synthetic index could attribute the same score to subjects who experience life conditions that are very different. To illustrate this point, subjects deprived in terms of health and relational support may receive the same score on the index of the subjects that are dissatisfied with institutions and deprived in terms of material resources.
5.11 Finally, it is clear that some heterogeneity factors are strongly predictive of belonging to the 13 multidimensional clusters. Economic poverty, foreign nationality, low level of education, residence in the Lake Geneva area, and lone parenthood are predictive of multidimensional deprivation and financial vulnerability. This is in line with previous studies conducted in Switzerland (cf. Macculi 2009). Old age plays a key role in influencing the membership to clusters of physical and mental fragility. Young age as well as living in a childless couple when one partner is aged 65 or older increases the risk of being in a condition of financial vulnerability and cumulative deprivation.
5.12 In conclusion our results seem compatible with both the theory of crystallization of social inequality (Erikson and Goldthorpe 2002; Whelan et al. 2003) and the thesis of individualization (Beck 1992; Leisering and Leibfried 1999). In other words, not only traditional forms of stratification (i.e. level of education, income, nationality) but also life cycle and acute life events (i.e. lone parent) seem to play a crucial role in accounting for the different patterns of well-being and deprivation.
Evolution of the prototypical forms across time and mobility of subjects across the topological space
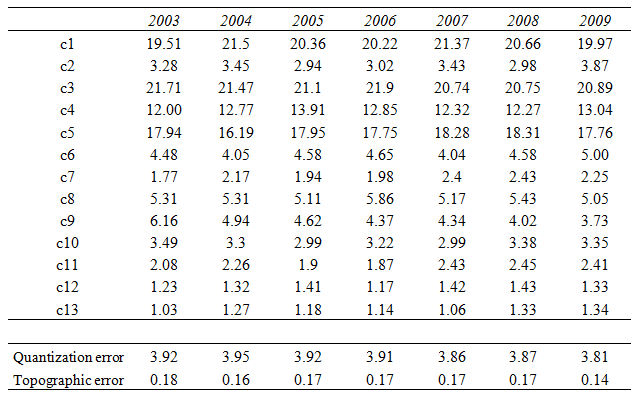
6.1 In order to understand in depth the phenomenon of deprivation and well-being, it is necessary to reconstruct the individual trajectories of life by taking a series of 'snapshots' and connecting them within a 'film'. The adoption of a longitudinal approach is justified by the fact that cumulative well-being, financial vulnerability, psychophysical fragility and cumulative deprivation are states that are prone to change over time.[7] The increased availability of longitudinal data allows us to focus our attention on the individual dynamics of transition from a given state to a different one across life courses (cfr. Walker and Ashworth 1994; Jenkins and Rigg 2001; Fourage and Layte 2005; Layte and Whelan 2002).With longitudinal data it is possible to describe the evolution of the prototypical forms of well-being and deprivation and the paths of permanence and mobility of subjects along topological space.| Table 4. Distribution of the prototypical forms of well-being and deprivation across waves. |
|
In Table 4 we report the distribution of the prototypical forms of well-being and deprivation across time. The classification of individuals prior to 2009 has been obtained by projecting data of previous waves onto the Self Organizing Map already trained. The main result of the projection is that the distributions of the prototypical forms within the time span 2003-2009 appear to be stable.
6.2 The quantization error and the topographical error remain low. A slight increase in these errors is noted as we move away from wave 2009. These results show that the estimated topological space adequately reproduces the information contained in waves prior to 2009.
6.3 The empirical analyses show that the living conditions of individuals and families in Switzerland have not worsened as a result of the global economic crisis that started in 2008. Nonetheless it would be important to confirm these results with data coming from the most recent waves of the panel.
6.4 The study of the trajectories of persistence and mobility of the subjects is carried out on a balanced subsample of 1272 subjects repeated for seven consecutive waves. The subjects that have missing values have been excluded from the analysis. In order to handle for panel non response we used propensity weighting following the theory of Rosenbaum and Rubin (1983). We have selected a subset of variables that are presumably associated with nonresponse - that's to say age, level of education, income, foreign nationality, family typology, region of residence - and the response propensity for each respondent to remain in the panel for seven consecutive years has been estimated through a logit regression model. The weighting adjustments for the seven wave respondents have been set to the inverses of the response propensities.
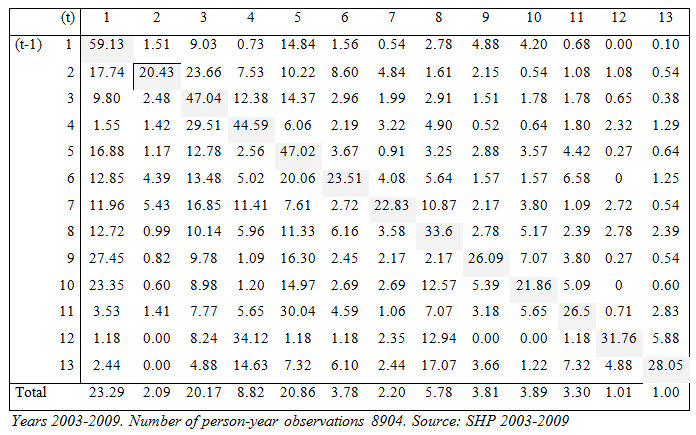
6.5 Table 5 reports the transition probabilities among the 13 prototypical forms from time t - 1 to time t. The rows of the table indicate the previous well-being and deprivation state while the columns show the current state.[8]
| Table 5. Transition probabilities from time t-1 to time t |
|
The discretization of the topological plane in 13 clusters allows us to detect a high degree of mobility, represented by the observations, which are concentrated in the cells outside of the main diagonal, although, on closer inspection, most transitions are of short-range or very short-range. In other words, the channels of maximum mobility are those that link topologically adjacent forms.
6.7 On average, 56% of the subjects change cluster from year to year, while 44% remain in the same cluster[9]. The highest stability is observed in cluster 1 (59.13%), followed by cluster 3 (47.04%), by cluster 5 (47.02%) , by cluster 4 (44.59%).
6.8 In order to keep the presentation of the results readable, we will comment the flows that concern the larger clusters (c1, c3, c4, c5 and c8). The subjects belonging to the area of cumulative well-being (c1, c5, c6, c9) generally move to clusters that have a similar semantic connotation and, less frequently, toward regions of financial vulnerability (c2, c3, c7) and psychophysical fragility (c8, c10, c11, c13). Only few subjects of the well-being region fall in the cluster of cumulative deprivation. More precisely, 21% of the subjects in cluster 1 in a given year move to clusters topologically adjacent and semantically similar (c5, c6, c9) the following year, while 11% fall in the area of financial vulnerability, 8% in the area of psychophysical fragility and only 1% slip into the region of cumulative deprivation (c4, c12). Turning to cluster 5, we observe the same dynamics: a relatively high proportion of observations (23%) moves to the adjacent well-being clusters c1, c9 and c6; 15% move to region of financial vulnerability (c2, c3, c7); 12% move to the area of fragility (c8, c10, c11, c13) and less than 3% fall into the region of multiple deprivation (c4, c12).
6.9 The subjects belonging to the clusters of financial vulnerability undertake mobility paths towards similar clusters and, to a lesser extent, to the area of cumulative well-being as well as that of multiple deprivations. Of great interest is the flow of downward mobility connecting cluster 3 (financial vulnerability) to region of multiple deprivation intercepting 13% of the observations. It should be stressed that 29% of the members of cluster 3 experience upward mobility in the direction of the area of cumulative well-being. The percentage of cases that flows from cluster 3 into the area of fragility is about 7%. Of the subjects in cluster 4 of cumulative deprivation, 34% move the following year into clusters of the financial deprivation, while 10% reach the area of cumulative well-being and 9% end up in the area of psychophysical fragility. 9.95% of the members of cluster 8 move within the same fragility area (c10, c11, and c13), 32.99% move to the region of cumulative well-being, 14.71% to the vulnerability region and 8.84% to the cumulative deprivation area.
6.10 In conclusion, the analysis of the transition probabilities matrix shows that: a) path dependence, that is the conditioning exerted by past experiences on the current state of an individual, plays a crucial role: Individuals belonging to clusters of deprivation at time t have a relatively higher probability of belonging to the same group the following year than those who belong to other groups; b) mobility paths that catalyze the largest number of observations are those which connect adjacent clusters or those which are close in the topological space
Conclusions
7.1 In the last thirty years, the notion of economic poverty has been integrated into abstract constructs like social exclusion, vulnerability and fragility. These rely on a wide range of indicators across different domains with the aim of representing in a more organic way the different forms in which the lack of access to resources, economic, cultural and social skills can be observed.7.2 In order to overcome the limitations of standard approaches that are based on synthetic indices we have proposed a data reduction technique that is able to compress the multidimensional space into vectors that characterize a specific profile of well-being and deprivation states. The profiles that we have identified express with greater precision than standard approaches the different configurations of life conditions experienced by individuals. In other words, we examined the configuration currently assumed in Switzerland by disparities in living standards of individuals and families as regards a number of aspects ranging from the state of health, the availability of material goods and financial resources, to housing situation and the quality of interpersonal relationships, to trust in people and institutions, to the satisfaction with life. Through a technique of data analysis still little used in social sciences, the SOM, we have attempted to shed light on whether and how these dimensions are combined with each other so to allow the identification of groups of subjects on a topological space that reproduces individuals' living conditions.
7.3 By and large about one in two Swiss benefits from a position of multidimensional well-being, one in four is financially vulnerable, one in seven shows a multiple deprivation condition, and finally about one in eight is in a state of psychophysical fragility. On the whole, it might be noted that the chances to belong to well-being or deprivation clusters are strongly associated with some important factors of individual heterogeneity such as level of education, income, age, nationality, type of household and geographical area of residence. These results seem to support both the thesis of 'social stratification' (Erikson and Goldthorpe 2002, Whelan et al. 2003) and the thesis of 'life courses individualization' (Beck 1992, Leisering and Leibfried 1999). In other words, both traditional forms of stratification (i.e. level of education, income, nationality) and life cycle events (i.e. age, lone parent) seem to exercise a significant influence in determining the different patterns of well-being and deprivation.
7.4 The originality of our study lies in the fact that, for the first time, a Self Organizing Map has been applied to the study of prototypical well-being and deprivation forms on a time span of seven years, in order to reconstruct the individual paths of mobility. In conclusion what emerges from the dynamic analysis is that 44% of individuals remain in the same cluster from year to year and that the most frequent paths of mobility are those which connect adjacent clusters. An individual who experienced deprivation, vulnerability and fragility during the previous period has a higher propensity to be in such a state in the present than an otherwise identical individual who experienced well-being.
7.5 This study has at least three limitations. First, many of the non monetary indicators used are based on self-reported information, which leads to some interpretative ambiguity. The main criticism that is made to the approach based on indicators of subjective well-being is that people are not able to evaluate objectively their degree of well-being. In the words of Sen (1993) the subjects might be trapped in a condition of 'happy slave', that is they might develop an unconscious adaptation to a condition of material poverty and deprivation of human rights. Second, the large number of clusters ensure high levels of details, that allows to properly preserve the complexity of the multidimensional space of the data, but this detail could be difficult to understand and put into practice by policy makers. Third, the longitudinal analysis was conducted on a purely descriptive level. To properly quantify the 'true path dependence', it would be appropriate to implement a multilevel multinomial regression model in order to control for individual heterogeneity and initial condition[10].
7.6 As a conclusion of this paper, a special mention is due to an important theoretical consideration by Serge Paugam (2005) on elementary forms of poverty in Europe. According to him, the experience of poverty in Switzerland should be classified as 'marginal poverty': the individuals who are in a state of severe material deprivation represent a small fringe of the population. This phenomenon is also found in Germany, Denmark and, more generally, in countries characterized by high levels of economic well-being and by a strong social protection system. Such a system guarantees to disadvantaged citizens full participation in social life, regardless of their employment status and of the presence of family support. Our data seem to confirm the interpretation given by Serge Paugam to the marginal nature of the phenomenon of poverty in Switzerland. In our SOM analyses, in fact, component planes clearly show that a very small percentage of people experience a state of severe material deprivation. Such a finding leads to the conclusion that, in a rich country like Switzerland which ranks among the top countries as regards multidimensional well-being, material deprivation may appear a statistically insignificant and socially invisible phenomenon. However, we find clear differences in the life conditions of individuals with regard to other dimensions like: financial vulnerability, psychophysical fragility, relational support, housing conditions, environment issues, lack of free time and distrust of people and institutions. All these dimensions deserve to be investigated more carefully.
Appendix 1
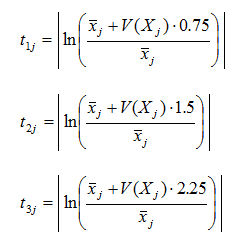
Formula for transforming the component mean deviations into an alphanumeric code. For each indicator Xj (j = 1, . . . ,33), we have calculated the sample mean x̄j and variance V (Xj)[11];- For each indicator Xj, we have calculated three threshold values:
- For each indicator Xj, we have calculated the mean within each cluster Cg (g = 1, . . . , 13): x̄j/g
- For each indicator Xj and each cluster Cg, we have calculated the 'deviation' of the cluster-specific mean from the overall mean:
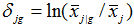 .
.
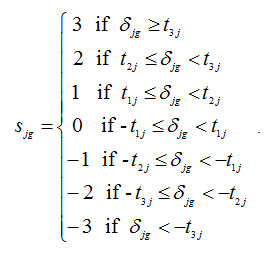
- We have transformed the deviation values
 into a corresponding set of discrete scores sjg in accordance with the following rules:
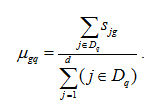
- For each cluster Cg and each deprivation dimension Dq (q = 1, . . . , 13), we have calculated the mean of the scores sjg pertaining to the relevant indicators:
- Finally, we have transformed the mean values
 into a corresponding set of symbols in accordance with the following rules:
Notes
1Financial support for this work was provided by the Swiss National Science Foundation (FNS) (Grant N. 100017_138033/1).2For some variables the measurement at household level is theoretically justified, for others it would have been better to dispose of the information at the individual level so as to avoid a reduction of the heterogeneity.
3The data have been weighted using individual cross-sectional weights (not calibrated).
4Nowadays the SOM has widespread into numerous fields of science. An exhaustive list of SOM applications can be find in Kohonen (2001).
5Following the practice of EUROSTAT, the poverty line is set at 60% of the national median income equivalised household income and it has been calculated using the modified OECD scale.
6Since the indicators used to represent the relational dimension do not allow us to rigorously map the quality and quantity of support received, it would be risky to conclude that these individuals are in a state of relational isolation.
7In literature, vulnerability to poverty is measured as the risk that a household or community will fall into deprivation at least once in the next few years (cfr. Silber 2004).
8Data reported in table 5 can be considered as transition probabilities in a Markov sense.
9The global mobility has been calculated as the percentage of observations out of the main diagonal.
10The initial conditions problems is linked to the fact that when we work with panel data the start of the stochastic process that generated the phenomena of interest could not coincide with the start of the observation period (Heckman 1981).
11Scale indicators have been normalised.
Acknowledgements
This publication is part of the research works conducted at the Swiss National Centre of Competence in Research LIVES - Overcoming vulnerability: life course perspectives, which is financed by the Swiss National Science Foundation.
References
ALKIRE, S. and Foster, J.E.: (2007) 'Counting and multidimensional poverty measurement, Oxford Poverty & Human Development Initiative', OPHI Working Paper No.7.
ALKIRE, S. and Foster, J.E. (2011a) 'Understandings and misunderstandings of multidimensional poverty measurement', Journal of Economic Inequality, Vol. 9, p. 289-314. [doi://dx.doi.org/10.1007/s10888-011-9181-4]
ALKIRE, S. and Foster, J.E. (2011b) 'Counting and Multidimensional Poverty', Journal of Public Economics, Vol.95, p.476-487. [doi://dx.doi.org/10.1016/j.jpubeco.2010.11.006]
ALLARDT, E. (1976) 'Dimensions of Welfare in a Comparative Scandinavian Study', Acta Sociologica, Vol. XIX, n.3, p.227-237. [doi://dx.doi.org/10.1177/000169937601900302]
ANDREWS, F. M. and Withey, S. B. (1976) Social indicators of well-being. Americans' perceptions of life quality, Plenum Press, New York. [doi://dx.doi.org/10.1007/978-1-4684-2253-5]
ATKINSON, A.B. (2002) 'Social Inclusion and the European Union', Journal of Common Market Studies, Vol. 40, p. 625-643 [doi://dx.doi.org/10.1111/1468-5965.00391]
ATKINSON, A.B. (2003) 'Multidimensional Deprivation: Contrasting Social Welfare and Counting Approaches', Journal of Economic Inequality, Vol.1, p. 51-65. [doi://dx.doi.org/10.1023/A:1023903525276]
ATKINSON, A.B., Cantillon, B., Marlier, E., Nolan, B. (2002) Social indicators: The EU and Social Inclusion, Oxford University Press, Oxford. [doi://dx.doi.org/10.1093/0199253498.001.0001]
BECK, U. (1992) Risk Society: Towards a New Modernity, Sage, New Delhi.
BOURGUIGNON, F. and Chakravarty, S. (2003) 'The measurement of multidimensional poverty', Journal of Economic Inequality Vol.1, p.25-49.
BRANDOLINI, A.(2008) On Applying synthetic indices of Multidimensional well-being: health and income inequalities in France, Germany, Italy, and the United Kingdom. In: Gotoh, R., Dumouchel, P. (eds.) Against Injustice. The New Economics of Amartya Sen, Cambridge University Press, Cambridge.
COLEMAN, J.(1990) Foundations of Social Theory, Harvard University Press, Cambridge.
CALLAN, T., Nolan, B.J. and Whelan, C.T. (1993) 'Resources, Deprivation and the Measurement of Poverty', Journal of Social Policy, Vol.22, No.2, p.141-172. [doi://dx.doi.org/10.1017/S0047279400019280]
CANTRIL, H.(1965) The pattern of human concerns. Rutgers University Press, New Brunswick.
EASTERLIN, R.A. (2001) 'Income and Happiness: Towards an Unified Theory', Economic Journal, Royal Economic Society, Vol.111, No.473, p.465-84.
ERIKSON, R. and Goldthorpe, J.H. (2002) 'Intergenerational inequality: a sociological perspective', Journal of Economic Perspectives, Vol. 16, No.3, p. 31-44. [doi://dx.doi.org/10.1257/089533002760278695]
EUROPEAN COMMISSION (1992) Toward A Europe of Solidarity: Intensifying the fight against social exclusion, fostering integration. Communication from the Commission, Brussels.
FOURAGE, D. and Layte, R.(2005) 'Duration of poverty spells in Europe', Journal of Social Policy Vol.34, No.3, p.407-426. [doi://dx.doi.org/10.1017/S0047279405008846]
FREY, B. and Stutzer, A. (2002) Happiness in economics, Princeton University Press, Princeton.
FUKUYAMA, F. (1995) Trust: the social virtues and the creation of prosperity, Free Press, New York.
GUIO, A.C. (2005a) Material deprivation in the EU, Statistics in Focus 21/2005. Eurostat, Office for Official Publications of the European Communities, Luxembourg.
GUIO, A.C. (2009) What can be learned from deprivation indicators in Europe? Eurostat methodologies and working paper, Eurostat, Luxembourg.
HALLERöD, B. (1996) 'Deprivation and Poverty: A Comparative Analysis of Consensual Poverty in Sweden and Great Britain', ACTA Sociologia, Vol.39, No.2, p.141-168.
HECKMAN, J.J. (1981), 'Heterogeneity and state dependence' in Sherwin Rosen (ed.), Studies in Labor Markets, Chicago: University of Chicago Press.
JENKINS, S.P. and Rigg, J.A. (2001) The dynamics of poverty in Britain. Department of work and pensions, Research Report 157, corporate Document Services, Leeds
KAHNEMAN, D. (2007) Economia della felicità, Il Sole 24 Ore Pirola, Milano.
KOHONEN, T. (1982) 'Self-organized formation of topologically correct feature maps', Biological Cybernetics, Vol.43, p.59 - 69. [doi://dx.doi.org/10.1007/BF00337288]
KOHONEN, T.(2001) Self-Organizing Maps. Springer, Berlin. [doi://dx.doi.org/10.1007/978-3-642-56927-2]
LAYTE, R. and Whelan, C.T. (2002) Moving in and out of poverty: the impact of welfare regimes on poverty dynamics in the EU. University of Essex, Colchester (EPAG working paper 30).
LAYTE, R. Maître, B. Nolan, B. and Whelan, C.T. (2001) 'Explaining deprivation in the European Union'. Acta Sociologica, Vol.44, p.105 - 122.
LEISERING, L. and Leibfried, S. (1999) Time and Poverty in Western Welfare States. Cambridge University Press, Cambridge.
LUCCHINI, M. Pisati, M. and Schizzerotto, A. (2007) Stati di deprivazione e di benessere nell'Italia contemporanea. Un'analisi multidimensionale. In: Brandolini, A., Saraceno, C. (Eds.) Poverty e benessere. Una geografia delle disuguaglianze in Italia. Il Mulino, Bologna
LUCCHINI, M. and Assi, J. (2012) 'Mapping Patterns of Multiple Deprivation and Well-Being using Self-Organizing Maps: an Application to Swiss Household Panel Data', Social Indicators Research, Issn: 0303-8300, doi: 10.1007/s11205-012-0043-7 [doi://dx.doi.org/10.1007/s11205-012-0043-7]
MACCULI, I. (2009) 'Essays on polarization, multidimensional poverty and health-related effects: an application to Switzerland', Thèse de doctorat: Univ. Geneve, no. SES 711.
MACK, J. and Lansley, S. (1985) Poor Britain, Allen and Unwin, London.
PAUGAM, S. (2005) Les formes elementaires de la pauvreté, Presses Universitaires de France, Paris.
PISATI, M. Whelan, C.T. Lucchini, M. and Maitre, B. (2010) 'Mapping patterns of multiple deprivation using self-organising maps: An application to EU SILC data for Ireland', Social Science Research, Vol.39, No.3, p.405-418. [doi://dx.doi.org/10.1016/j.ssresearch.2009.11.004]
PUTNAM, R.D. (1993) 'The prosperous community: social capital and public life', American Prospect, Vol.4, No.13, p.35-42.
ROSENBAUM P.R., RUBIN D.B. (1983), 'The Central Role of the Propensity Score in observation studies for causal effects', Biometrika, Vol. 70, No. 1, p. 41-55. [doi://dx.doi.org/10.1093/biomet/70.1.41]
SILBER, J. (2004) 'Inequalities: theory, experiments and applications', European Journal of Political Economy, Vol.20, No.3, p.813-821. [doi://dx.doi.org/10.1016/j.ejpoleco.2004.06.002]
SEN, A.K. (1985) Commodities and Capabilities, North Holland, Amsterdam
SEN, A.K. (1993) Capability and Well-being. In: Nussbaum, M. , Sen, A.K (Eds.) The Quality of Life, p. 31-53. Oxford: Clarendon Press
TOWNSEND, P. (1979) Poverty in the United Kingdom, Penguin, London.
UNDP (United Nations Development Programme) (2005) Human Development Report 2005. International Cooperation at a Crossroads: Aid, Trade and Security in an Unequal World. United Nations Development Programme and Oxford University Press, New York and Oxford.
VESANTO, J. Himberg, J. Alhoniemi E. and Parhankangas, J. (2000) SOM toolbox for Matlab 5. In Technical Report A57. Helsinki University of Technology, Finland.
WALKER, R. and Ashworth, K. (1994) Poverty Dynamics: Issues and Examples, Aldershot, Avebury
WATTS, M. and Bohle, H.G. (1993) 'The space of vulnerability: the causal structure of hunger and famine' Progress in Human Geography, Vol.17, No.1. [doi://dx.doi.org/10.1177/030913259301700103]
WHELAN, C.T. Layte, R. and Maître, B. (2003) 'Persistent Income Poverty and Deprivation in the European Union', Journal of Social Policy, Vol.32, No.1, p.1-18.
WHELAN, C.T. and Maître, B. (2005) 'Economic vulnerability, multi-dimensional deprivation and social cohesion in an enlarged European Union', International Journal of Comparative Sociology, Vol.46, No.3, p.215 - 239.
WHELAN, C.T. and Maître, B. (2007) 'Levels and patterns of multiple deprivation in Ireland: after the Celtic Tiger', European Sociological Review, Vol.23, No.2, p.139 - 156.
WHELAN, C. and Maître, B. (2012) GINI DP 36: Material deprivation, economic stress and reference groups in Europe: an analysis of EU-SILC 2009, GINI Discussion Papers dp36, AIAS, Amsterdam Institute for Advanced Labour Studies.
WHELAN, C.T. Layte, R. and Maître, B. (2002) Income and Deprivation Approaches to the Measurement of Poverty in the European Union. In Muffels, R.J.A. (eds.) Social Exclusion in European Welfare States. Cheltenham: Edward Elgar
WHELAN, C.T. Lucchini, M. Pisati, M. and Maitre, B. (2010) 'Understanding the Socio-Economic Distribution of Multiple Deprivation: An Application of Self-Organising Maps', Research in Social Stratification and Mobility, Vol.28, No.3, p.325-342. [doi://dx.doi.org/10.1016/j.rssm.2010.03.003]
WHELAN, C. T. Layte, R. Maître, B. and Nolan, B. (2001) 'Income, deprivation and economic strain: An analysis of the European Community Household Panel', European Sociological Review, Vol.17, No.4, p.357 - 372.
WHELAN, C. Brian, N. and Maitre, B.(2012) Multidimensional Poverty Measurement in Europe: An Application of the Adjusted Headcount Approach, Working Papers. 201211, Geary Institute, University College Dublin.
WORLD BANK (2001) World Development report 2000/2001: Attacking Poverty. Oxford University Press, New York and Oxford.
