Is Social Mobility Really Declining? Intergenerational Class Mobility in Britain in the 1990s and the 2000s
by Yaojun Li and Fiona Devine
University of Manchester
Sociological Research Online, 16 (3) 4
<http://www.socresonline.org.uk/16/3/4.html>
10.5153/sro.2424
Received: 26 Jan 2011 Accepted: 1 Jul 2011 Published: 31 Aug 2011
Abstract
This paper contributes to the ongoing debate on social mobility in contemporary Britain among economists and sociologists. Using the 1991 British Household Panel Survey and the 2005 General Household Survey, we focus on the mobility trajectories of male and female respondents aged 25-59. In terms of absolute mobility, we find somewhat unfavourable trends in upward mobility for men although long-term mobility from the working class into salariat positions is still in evidence. An increase in downward mobility is clearly evident. In relation to women, we find favourable trends in upward mobility and unchanging downward mobility over the fourteen-year time period. With regard to relative mobility, we find signs of greater fluidity in the overall pattern and declining advantages of the higher salariat origin for both men and women. We consider these findings in relation to the public debate on social mobility and the academic response and we note the different preoccupations of participants in the debate. We conclude by suggesting that the interdisciplinary debate between economists and sociologists has been fruitful although a recognition of similarities, and not simply differences in position, pushes knowledge and understanding forward.
Keywords: Social Class, Absolute and Relative Mobility, Gender Difference, Social Fluidity
Introduction
1.1 In recent years, there has been increasing concern among politicians and media commentators that social mobility is declining in Britain. This anxiety, for example, featured in the leadership and deputy leadership contests of the Labour Government in 2007 won by Gordon Brown and Harriett Harman and led to various policy initiatives, including the Equalities Bill published in 2009 and the formation of a Panel on Fair Access to the Professions chaired by Alan Milburn, whose final report, Unleashing Aspiration (2009), called for a second wave of upward mobility to be facilitated by the growth of high-level professional and managerial careers. Commissioned by Harman, the National Equality Panel report, An Anatomy of Economic Inequality in the UK, also noted that social mobility is low (Hills et al. 2009). While in opposition, the Liberal Democrat set up an Independent Social Mobility Commission in 2008 chaired by Martin Narey, Barnado's Chief Executive, which reported that children's life chances are still closely tied to their parents' class background. Finally, the Coalition Government's Education Secretary, Michael Gove, introduced the Schools White paper in the House of Commons in November 2010, proposing a major overhaul of the English school system, with reference to social mobility. He claimed, 'Social mobility went backwards under Labour and it is the mission of this Coalition Government to reverse that melancholy trend and make opportunity more equal so we can become an aspiration nation once more. The White Paper does just that' (BBC Democracy Live, 24/11/2010). Politicians across the political spectrum, it seems, are concerned and keen to do something about declining social mobility (Devine, 2009; Payne, 2009; Saunders, 2009).[2]1.2 As we shall see, this political and public anxiety has been fuelled by academic research and debate. We contribute to the ongoing academic discussion of trends in intergenerational social mobility in contemporary Britain by asking whether social mobility is really declining in recent decades. The paper is organised along the following lines. In the next section, we outline the arguments by economists that social mobility has declined since the 1970s and the counter-argument from sociologists that it has not done so. We note, however, that the finding that men's upward mobility have levelled off or may even be declining suggests some similarity between the two positions. In the third section, we discuss our data and methods. We draw on the 1991 British Household Panel Survey and the 2005 General Household Survey and use the National Statistics Socio-economic Classification (NS-SeC) to analyse patterns and trends across the two surveys. In the fourth section, we present our findings on absolute mobility. For men, we find evidence of declining upward mobility although long-range mobility can still be found. Downward mobility has increased. For women, we find increasing upward mobility and largely stable downward mobility. In the sixth section, we consider these findings in relation to the public debate on social mobility and the academic response and we note the different preoccupations of participants in the debate. In the conclusion we suggest that the interdisciplinary debate between economists and sociologists has been fruitful although a recognition of similarities, and not simply differences in position, pushes knowledge and understanding forward.
The Debate on social mobility
2.1 The impetus for concern about declining social mobility is associated with the work of economists, some of which was conducted for the Sutton Trust and reported extensively in the media (Blanden et al. 2004, 2005, 2007, 2008, see also Machin and Vignoles 2004). Blanden et al. examined changes in intergenerational mobility using longitudinal data from the 1958 National Child Development Study (NCDS) and the 1970 National Cohort Study (BCS). They found that intergenerational income mobility had fallen for those sons born in 1970 compared with those born in 1958. The percentage of sons in the lowest income quartile whose parents were also in the lowest quartile rose from 31% in 1958 to 39% in 1970 while the percentage of sons in the highest income quartile whose parents were also in the highest quartile rose from 34% among the 1958 cohort to 42% among the 1970 cohort (Blanden et al. 2004: 141). Thus, equality of opportunity had declined across the two cohorts of young men. Blanden et al. argue that the decline is the result of a closer relationship between family income and educational attainment between the two cohorts. Drawing on additional data from the British Household Panel Survey (BHPS), they found that more sons and daughters from all families stayed on in further and higher education. Degree attainment rates grew for both the richest and poorest 20%. They noted, however, that this rise differed across income groups. The proportion of young people from the richest backgrounds increased from 20% to 46% while the proportion of young people from the poorest backgrounds increased from 6% to 9% only. Thus, the participation rates between the two groups widened from 14 to 37 percentage points over time (Blanden et al. 2005: 112).[3]2.2 These findings were challenged by sociologists John Goldthorpe and Michelle Jackson (2007). They emphasised that intergenerational income mobility is not the same as class mobility which takes account of a class structure. Moreover, it is imperative to distinguish between absolute and relative mobility. Absolute (or total) mobility captures mobility that flow from structural changes as some classes grow in size while others decline as a result of the changing occupational structure. Relative mobility concerns the extent of fluidity when changing structural conditions are held constant and captures the chances of people from different classes of origin being found in one rather than another class of destination.
2.3 Applying a class structural approach (rather than examining income relativities using data divided into quartiles as the economists do) to the same data sets as used by Blanden et al., Goldthorpe and Jackson found different results. For men, absolute mobility had not been falling: total mobility increased slightly, with a slight decrease in upward mobility and an increase in downward and horizontal mobility (Goldthorpe and Jackson, 2007: 531). For women, absolute mobility experienced a minor change in total mobility, with small increases in upward and horizontal mobility and a modest decrease in downward mobility (Goldthorpe and Jackson, 2007: 532). Goldthorpe and Jackson explain these findings with reference to the changing opportunity structure confronting the two cohorts. For men, the rising rate of upward mobility from the 1940s to the 1960s started to flatten out from the 1970s and downward mobility increased. For women, there has been increasing upward mobility and decreasing downward mobility. Turning to relative rates of mobility, they found no change, indicating that levels of fluidity were unaltered between the two cohorts. Overall, there may be some slackening off in upward mobility for men. Contrary to the economists' view, however, Goldthorpe and Jackson concluded that social mobility is not declining, or not as yet.
2.4 Debate continues on methodological issues about the use of income versus class and the quality of the data sets used (Blanden et al., 2008; Erikson and Goldthorpe, 2009, 2010).[4] Goldthorpe has long preferred the General Household Survey (GHS) (Goldthorpe and Mills, 2004). Recently, he and Mills have extended their research into the 1990s and the 2000s by analysing national surveys conducted between 1972 and 2005 (Goldthorpe and Mills, 2008). Turning to men's absolute mobility, they found that total mobility rates and upward and downward mobility rates were fairly stable throughout the period 1972-1992 and 1991-2005 (Goldthorpe and Mills, 2008: 88). In contrast, notable changes in women's absolute mobility rates were found over the period in question. Total mobility was largely stable throughout the two periods. There is a significant increase in upward mobility while downward mobility decreased across the whole period by similar percentages (Goldthorpe and Mills, 2008: 89). Once again, Goldthorpe and Mills note the proportion of men in the professional and managerial class (salariat) grew steadily while the working class shrunk throughout the 1970s and the 1980s. Most of the decline was among skilled manual workers. From 1991-2005, however, the salariat barely grew at all while the working class did not shrink any further (Goldthorpe and Mills, 2008: 87). For women, different rates are evident because the proportion of women in the salariat continued to grow (albeit at the lower levels) throughout the 1990s and up to 2005 and the number of women in the unskilled working class declined (Goldthorpe and Mills, 2008: 86). Finally, Goldthorpe and Mills found relative rates of mobility were constant over the forty-year time span for both men and women.
2.5 These latest findings confirm Goldthorpe's long-standing research on social mobility. He has consistently argued that while absolute mobility increased for the second half of the twentieth century, as the shape of the class structure changed, relative mobility did not change over that period (see also Paterson and Iannelli 2007a, b for research on England, Scotland and Wales). This 'constant social fluidity' explains why class inequalities persist. These findings have not always been agreed by other sociologists, however (Payne, 1987a, 1987b; Saunders, 1996 -- although see also Savage and Egerton, 1997; Breen and Goldthorpe, 1999 with regard to Saunder's position). Most recently, on the basis of a cohort analysis of data from the British Election Studies (BES), Heath and Payne (2000: 275) have confirmed Goldthorpe's findings on absolute mobility but suggested that relative mobility has seen a 'real, albeit small, increase in the openness of British society'. Similarly, also using the BES data, Payne and Roberts (2002) have argued British society has experienced periods of 'greater openness' over the last 60 years. Using data from 31 contemporary social surveys and the Cambridge Family History dataset, Lambert et al. (2007) have shown a small but slow linear trend towards increasing social mobility over the period 1800-2004. This, academic debate amongst sociologists at least, has focused on whether relative social mobility has improved although attention among politicians and public commentators is now turning to the current debate on absolute mobility in 'new political circumstances' (Saunders, 2009: 7). From the research noted above, Payne and Roberts (like the economists) have suggested that opportunities for upward mobility for men decreased in the 1990s although Saunders argues that the apparent consensus that social mobility is getting worse is a myth.
2.6 Returning to the specific debate on social mobility among economists and sociologists, the key substantive difference between them is whether men's mobility, in both absolute and relative terms, is declining (although economists are not much concerned about absolute mobility). The differences are not as great as they first seem. After all, Goldthorpe and Jackson found a (non-significant) decline in absolute upward mobility for men in the NCDS and BCS data sets. Indeed, in their earlier work analysing GHS data between 1973 and 1992, Goldthorpe and Mills concluded, 'Among men, the previously rising trend in upward mobility levelled out, and, if anything, started to decline, while the previously decreasing rate of downward mobility levelled out or, if anything, increased' (Goldthorpe and Mills, 2004: 222). The different findings, they indicate, may be associated with using unrepresentative cohort studies rather than representative population surveys. Be that as it may, they acknowledge that 'trends observed across still relatively young birth cohorts may point to changes that will become apparent in the total population at some later stage, since changes in mobility are known to be often driven by cohort replacement, rather than general period, effects' (Goldthorpe and Mills, 2008: 98). We take up this suggestion to see if changes are taking place by extending Goldthorpe and Mills' work using the 1991 BHPS and the 2005 GHS to examine social mobility among the general population at the two time points. Have trends in men's absolute mobility got worse? Moreover, it is equally important to ask whether they have stayed the same or become better. Similarly, have trends in women's absolute mobility patterns declined, stabilised or increased? What are the main trends in relative social mobility for both men and women in recent times? Have these got worse for men and women? Given the ongoing sociological debate, have they stayed the same or improved?
Data and methods
3.1 As noted above, we use the British Household Panel Survey (BHPS) for 1991 and the General Household Survey (GHS) for 2005 in this study.[5] Both are national representative sample surveys for respondents resident in private households in Great Britain at the time of interview and both have large sample sizes. The BHPS began in 1991 as the premier British panel study, and had 5,143 households and 9,912 individuals with full interviews in that year, with a response rate of 92% at the individual level. The GHS for 2005 has a full sample size of 30,069 among whom 72% are full interviews (6% being proxy and 22% child/other).[6] The overall response rate for the survey was 74%. We confine the analysis to men and women aged 25 to 59 in both surveys. This age range was chosen because the GHS for 2005 only collected the information on the parental occupation from respondents aged 25 or above and this is also the age range used in Goldthorpe and Mills (2008) so that we can compare our findings with theirs.3.2 The most important reason for using these two surveys fourteen years apart is that they are the only data sources currently available that have respondents' origin and destination occupational classes consistently coded in the National Statistics Socio-economic Classification (NS-SeC). For both respondents' and parental class (indexed via their current or last main jobs or their parents' father's and mother's jobs when they were at the age of 16), we use the thirty-five category long version of the NS-SeC which is then coded into the seven-class schema as per Rose and Pevalin (2003: 8-10). As both male and female respondents' and parental class codes are available in the long version, we follow the suggestions by Erikson and Goldthorpe (1992: 241) that, where possible, men and women in lower intermediate class (routine non-manual in the lower grade, that is, Class IIIb in the Goldthorpe class or L7.2 in the 35-category long-version of the NS-SeC) be combined with unskilled manual working class.[7] We also follow Erikson (1984) and adopt a 'dominance approach' by using father's or mother's class (whichever is higher) as the family origin class.[8] This procedure has, in our view, two advantages. Firstly, it would better reflect the social reality. The enlarging salariat class in the last few decades (see Goldthorpe and Mills 2008: 86; Li, 2002; Garratt and Li, 2005: 203; Li and Heath, 2010: 85) can be expected to benefit mothers as well as fathers and, over time, there would be more households in which mothers had a higher social position than fathers. This is shown in our data. For the samples used in the paper, 17.9% of mothers were in a higher class than fathers in 1991 and the proportion rose to 23.5% in 2005. Second and concomitantly, adopting this procedure rather than using father's class alone has increased the effective sample sizes for analysis (by 296 for the BHPS and 651 for the GHS).[9] (For the ease of presentation, we still use the term 'father's class' in some of the discussions below.) After selecting respondents with valid origin and destination classes, we have 5,558 respondents for the 1991 and 8,380 respondents for the 2005 data.
3.3 The seven-class NS-SeC schema we use for both origin and destination classes are: (1) higher managerial and professional and large employers, (2) lower managerial and professional, (3) intermediate, (4) small employers and own account workers, (5) lower supervisory and technical, (6) semi-routine and (7) routine (Rose and Pevalin, 2003: 13). In some of our discussion below, we shall refer to the first two classes as the salariat, the middle three as the intermediate class, and the last two as the working class. We conduct our analyses for men and women separately.
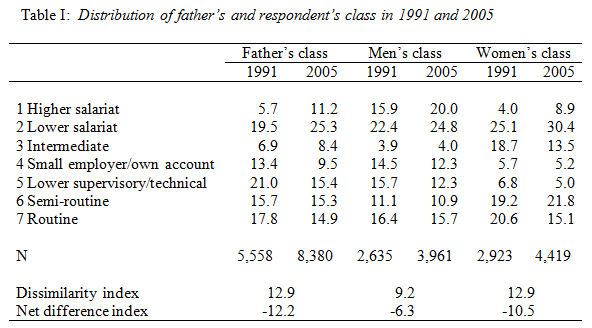
3.4 Before we proceed to the detailed analysis, it is necessary to have a brief look at the changing contours of the class structure. Table 1 shows the distributions of the origin and the destination classes in the two years and two summary indices which are listed at the bottom of the table. The dissimilarity index, which shows the percentages of cases that would have to be reallocated to make the two distributions identical, is a measure of overall change. According to this index, there were more changes in the origin than in the men's class distributions between the two time points (12.9% and 9.2%) but women experienced similar amounts of mobility to parents in the period covered. As the index of dissimilarity is insensitive to the ordered data as implied in the NS-SeC class and to local changes and as it does not provide any directional statement about the differences between the years, we also report the net difference index (NDI)[10] as devised by Lieberson (1975) which can overcome shortcomings in the former. It is noted here that the negative value imply that the 2005 distributions have a distinct edge over the 1991 distributions. As can be seen, parents and women experienced more class advancement than did men.
|
Notes:Source: The British Household Panel Survey (1991) and the General Household Survey (2005) (same below).
- Weighted analyses and unweighted Ns are used in this and all following tables.
- For respondents aged 25 to 59 in Great Britain at time of survey (same below).
3.5 Looking more closely, we find growing proportions of the salariat (Classes 1-2) with regard to father's, men's and women's class positions in the two surveys. In relation to father's class, there is an increase of 11.3 percentage points in the size of the salariat and a similar drop (by 8 points) in the intermediate classes (Classes 3-5). The size of the working class (Classes 6-7) declined by 3.3 percentage points. In relation to men's class, the same trends are broadly discernible. There is a 6.5 point increase in the size of the salariat and a 5.5 point drop in the intermediate classes while the working-class decrease in size is slight (by 0.9 points). With regard to women, there is a substantial increase (by 10.2 points) in the size of the salariat which is bigger than that for men and similar to the changes in father's class over the fourteen-year period. There is a significant drop in the size of the intermediate class (by 7.5 points) and a small decrease in the size of the working class (by 2.9 points).[11]
3.6 Thus, in all three cases, the changes in the size of the different classes result from growths in the proportions found in the salariat which are mostly offset by declining proportions in the intermediate and the working classes. In other words, there was a continued upgrading of the class structure for both origin and destination classes in the period in question. Such findings are in line with those reported in other studies (Goldthorpe and Jackson, 2007; Goldthorpe and Mills, 2004, 2008; Heath and Payne, 2000). What is not usually reported but would be expected is that, if the respondents' class undergoes continued upgrading as has occurred since the early 1970s, parental class would experience a similar kind of structural changes. A more familiar finding, of course, is the persistent gender differences in the position of men and women in different class locations (Goldthorpe and Mills, 2008, Marshall et al., 1988).[12]
3.7 To proceed further and in line with a class structural approach, we analyse patterns and trends in social mobility by making a crucial distinction between absolute and relative mobility long used by social mobility researchers as noted above (Goldthorpe, 1987; Halsey et al., 1980; Heath, 1981). As we shall see later, public concern about social mobility tends to focus on absolute mobility while mobility researchers (or sociologists at least) study both absolute and relative mobility.
Absolute mobility rates
Total rates
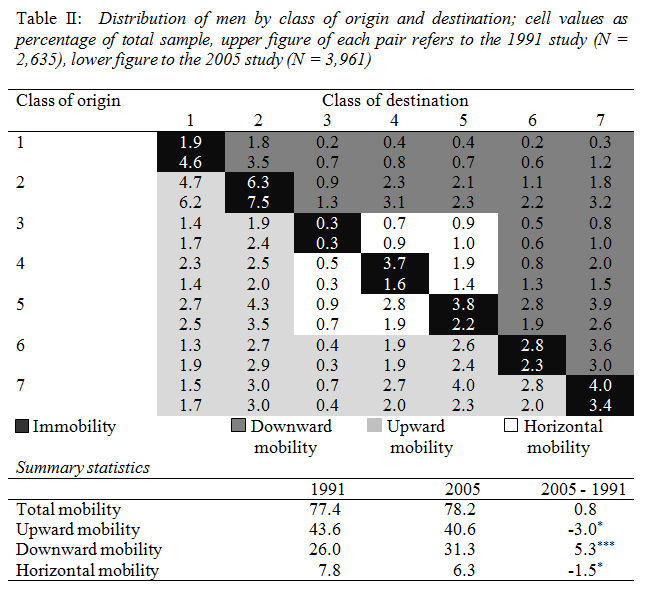
4.1 We consider absolute mobility in terms of total rates first. We present our tables in the same way as Goldthorpe and Jackson (2007). Tables II and III are origins-by-destinations tables for men and women respectively. Cell values are percentages of the total sample of respondents from each of the two surveys. The black cells on the main diagonals of the tables indicate immobility. The light grey cells show upward mobility, the dark grey cells denote downward mobility and the white cells capture horizontal mobility. Summary statistics at the bottom of each table show levels of total, upward, downward and horizontal mobility across the two samples. Total mobility, as the term suggests, is the sum of these three different types of mobility. As we noted above, it can conceal movements which are only revealed when total mobility is disaggregated into its constituent parts. We add an additional feature to our summary statistics, namely, the percentage change in the different types of mobility between 1991 and 2005. We also show the results of significance tests for the changes. The advantage is to see, at a glance, patterns of continuity and change over a 14-year period.4.2 Turning to men first, Table II shows a tiny increase in total mobility from 77.4% to 78.2% which is insignificant. Men's total mobility rates are, therefore, largely unchanged over the period in question. The disaggregation of total mobility into its constituent parts reveals important changes, however. Upward mobility has decreased by 3 percentage points (from 43.6% to 40.6%) and this change is significant. Downward mobility has increased significantly by 5.3 percentage points (from 26.0% to 31.3%). Finally, horizontal mobility has significantly decreased by 1.5 percentage points (from 7.8% to 6.3%). These findings are basically similar to Goldthorpe and Jackson's findings from their analysis of the NCDS and BCS data. The main difference between our and their data is the higher level of downward mobility based on our population-level analysis. This summary evidence suggests that men's upward mobility is declining. Interestingly, there is an increase in downward mobility for men, a finding often overlooked in the academic and public debate about social mobility.
|
Note:
* p<0.05; ** p<0.01; *** p<0.001 (the same in the following tables).
4.3 Looking at the more detailed findings in the table, immobility within the professional and managerial salariat (Classes 1 and 2) plays a larger part in total immobility in 2005 than in 1991 while the opposite is found within the working class (Classes 6 and 7) between the two time points. There has been a drop among the intermediate classes (Class 3, 4 and 5). There has also been a decrease in short-range mobility at the bottom of the class structure: namely, from Class 7 (routine workers) up into Class 6 (semi-routine workers) and from Classes 7 and 6 into Class 5 (manual supervisors and lower technicians). Interestingly, despite the decline in upward mobility, there is still evidence of a modest increase in long-range upward mobility from Classes 6 and 7 into Classes 1 and 2 between 1992 and 2005. This kind of mobility has not disappeared but has gained some increase. With regard to downward mobility, evidence of this can be seen across the class structure although it is most notable within the salariat (from Class 1 to Class 2) and from Class 2 (lower grade professions and managers) to Classes 6 and 7 (so long-range downward mobility into the working classes).
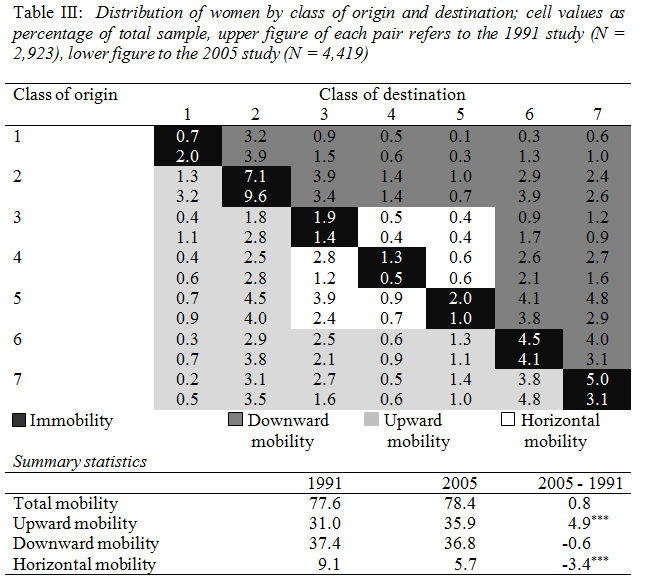
4.4 Looking now to women, Table III shows a slight increase (0.8 percentage points) in total mobility (from 77.6% to 78.4%), which is insignificant. Yet, the disaggregation of total mobility into the constituent parts reveals that important change has occurred. Upward mobility increased significantly (by 4.9 percentage points) rising from 31.0% to 35.9%. Downward mobility decreased slightly (from 37.4% to 36.9%) but this is insignificant. Finally, horizontal mobility decreased by 3.4 percentage points (from 9.1% to 5.7%) and this change is significant. These findings are somewhat different to Goldthorpe and Jackson (2007) where they found a smaller increase in upward and horizontal mobility and a bigger decrease in downward mobility. They are in line, however, with Goldthorpe and Mill's (2008: Figure 5) subsequent work on intergenerational class mobility. Although we did not find a significant increase in downward mobility, we found a substantial increase in upward mobility as they did.
|
4.5 A detailed examination of Table III reveals that immobility in the professional and managerial salariat (Classes 1 and 2) rose between 1991 and 2005 while immobility declined in the intermediate and the working classes (Classes 3-7). With regard to the substantial increase in upward social mobility, there is clear evidence of long-range and short-range mobility into the salariat over the two samples. It should be noted, however, that the biggest increase in upward mobility is shown among daughters of Class 2 origin making the way into Class 1 within the salariat. There appears to be some movement from unskilled manual origins into skilled manual destinations. Small increases in downward mobility are found scattered across the cells although the biggest increase is found from Class 1 to Class 6.
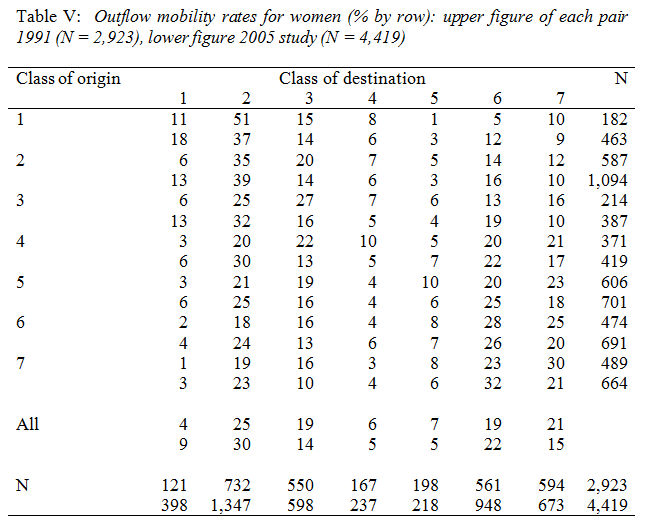
Outflow rates
4.6 We now turn our attention to absolute mobility in terms of outflow rates as shown in Tables IV and V based on the same data as found in Tables II and III. The difference, however, is that the cell values are percentages of row marginals. These tables, therefore, show how men and women of particular class origins (as defined by their father's class position as before) were distributed to class destinations in each of the two samples. It is standard practice in mobility research to look closely at the marginal distributions in the columns first of all. These show the overall class distribution of respondents of the two surveys. They highlight the changing class structure and the opportunities facilitating or constraining mobility that are independent of an individual's class origins. In other words, looking at the data in this way allows us to consider the structural conditions under which individuals may or may not be mobile and to acknowledge that these conditions are far from static but are constantly changing over time.
4.7 Concentrating on men first, the column marginal distributions show some changes in the size of the different classes across the two samples. In 1991, 16% of all men aged 25-59 were found in Class 5. By 2005, this percentage had dropped to 12%. Similarly, in the earlier sample, 15% of men were found in Class 4 (self-employed workers) compared with 12% in the later sample. Thus, the major decreases in size occurred among the intermediate classes (which dropped from 35% to 28% of all men). These decreases are offset by increases across all the other classes with the modest but biggest increase to be found in Class 1: from 16% to 20% over the 14-year period. Overall, there is an increase (by 7 percentage points) in the proportion of men found in the salariat, growing from 38% to 45%, while there was also no change in the proportion of men in the working classes, which stayed at 27%.
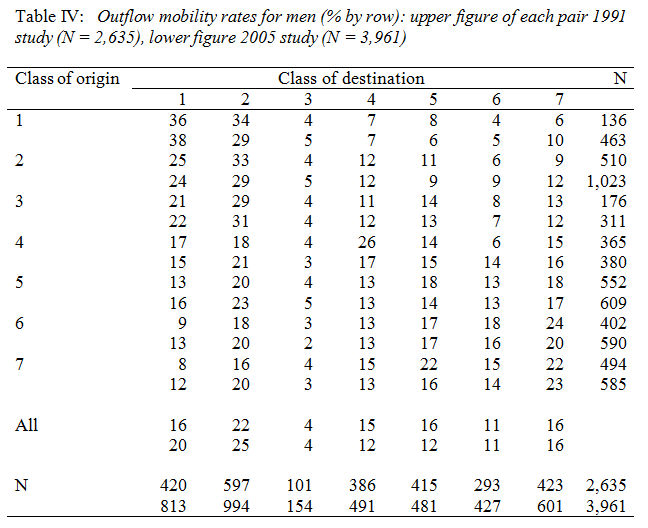
|
4.8 Looking closely at the cell values in Table IV, the outflow rates mostly reflect differences in the sizes of the classes illustrated by the column marginal distributions. Thus, there are fewer men of most social origins to be found in Classes 4 and 5. That said, there has been a marked decline in men from unskilled manual origins (Class 7) able to secure positions in supervisory manual positions since only 16% of men are to be found in Class 5 in the 2005 sample as against 22% in the 1991 sample. There is also a considerable drop in the intergenerational stability of men in Class 4 (the self-employed) with only 17% of men found in this class in 2005 compared with 26% in 1991. Finally, in relation to the changing size of Class 1, the main increases are to be found in the cells in the lower left hand corner of the tables: namely, from Classes 5, 6 and 7 (technician, supervisors of manual workers and skilled and unskilled manual) origins.
4.9 Turning now to women, the column marginal distributions show important changes in the size of the different classes across the two samples. In 1991, just under a fifth (19%) of all women aged 25-59 were to be found in Class 3 (routine non-manual employees). By 2005, this percentage had dropped to 14%. The overall size of the intermediate classes dropped from 32% in 1992 to 24% in 2005, a decrease by 8 percentage points. These decreases are offset by increases in the higher and lower echelons of the salariat, up from 4% to 9% for Class 1 and from 25% to 30% for Class 2. Accordingly, the proportion of women to be found in the salariat grew from 29% in 1991 to 39% in 2005. Women still very much dominate lower professional, managerial and administrative positions however. The proportion of women in Class 6 also grew (from 19% to 22%) but that in Class 7 declined (from 21% to 15%). The overall effect of this two-way change was to see a modest decrease in the proportion of women found in working-class positions (from 40% to 37%).
|
4.10 Focusing on the cell values in Table V, the outflow rates mostly reflect differences in the sizes of the classes illustrated by the column marginal distributions. Thus, there are fewer women of all social origins alike to be found in Class 3 and 7. Of note is the marked decline in intergenerational stability between fathers of Class 3 and daughters of Class 3 which dropped from 27% to 16% between 1991 and 2005. A pattern of decline, albeit to a smaller extent, is found in Classes 4-7. On the other hand, there has been a marked increase in intergenerational stability between fathers and daughters in Class 1 (up from 11% to 18%) and an increase (albeit to a smaller extent) of intergenerational stability in Class 2 as well (from 35% to 39%). Also notable is the increasing mobility of women of all social origins enjoying mobility into Class 1. Despite the increasing proportion of women to be found in Class 2, one exceptional finding is the decline in the proportion of women of Class 1 origins to be found in Class 2 (down by 14 percentage points from 51% to 37%). Otherwise, the increasing proportion of women in Class 2 comes from women of other social origins.
4.11 To be sure, findings from two national surveys over a fourteen year time span have their limitations for illuminating trends in intergenerational class mobility over a longer time frame. Nevertheless, this analysis reveals mobility trends within the population as a whole in recent decades. With regard to men, the results suggest that upward mobility may indeed be declining. It is these findings, of course, that have attracted the attention and concern of politicians and media pundits. That said, the evidence also shows that long-range upward mobility from working-class positions into the salariat has actually increased, albeit to a small extent, a finding which has been often overlooked. Moreover, downward mobility is increasing and this finding is often overlooked too. In relation to women, the analysis confirms a considerable increase in upward mobility, most notably into the salariat, although we found that this trend is not necessarily being accompanied with an increase in downward mobility. Thus, while men's mobility (in terms of absolute upward and downward mobility) appears to be getting worse, women's mobility seems to be improving over time.
Relative mobility rates
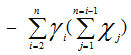
5.1 Having looked at absolute mobility in some detail, we now turn to relative mobility. Relative mobility refers to the competition of people from different origin classes for one rather than another class destination and is expressed as odds ratios. Let us assume, for the sake of simplicity, a class structure with only two origin and two destination classes: middle- and working- classes. If half of the people from the middle, and half from the working, origin classes are found in the middle class destinations with the other half found in the working class destinations, we have an odds ratio of 1. In such a case, there are equal chances of class mobility. In other words, there is no association between origin and destination. The closer the odds ratio is to 1, the weaker the association and hence the greater equality in social mobility while the further away the odds ratio rises above 1, the stronger the association and the greater the inequality. In a similar vein, the further away the odds ratio fall below 1, the weaker the association and the greater the equality. Relative mobility thus taps the net association between origin and destination, independent of the structural changes as reflected in the marginal distributions.5.2 Two statistical models are usually used for relative mobility analysis: the loglinear and the log-multiplicative layer effect (also called 'uniform difference' or UNIDIFF) models (Goldthorpe, 1987; Erikson and Goldthorpe, 1992; Xie, 1992). The loglinear model is subdivided into a baseline (or conditional independence) model and a constant social fluidity (CSF) model.[13] Briefly, the baseline model assumes that the distributions of both origins and destinations vary by the time of survey (year) but there is no association between them. In other words, all the odds ratios or relative chances defining origin and destination classes are equal at a value of one. The CSF model allows for the latter association but does not allow for the three-way association, which would be a saturated model. The UNIDIFF model is a variant of the CSF model which further allows for a uniform movement for the coefficient of one year to move above or below that of the other. In the present analysis, we use 1991 as the reference point. Thus the further away the coefficient for 2005 is above that of 1991, the more unequal is the society becoming, and vice versa.
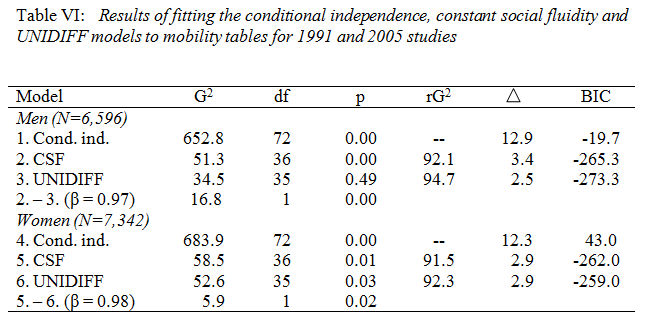
|
Note: rG2 = Percentage reduction in G2;= Percentage of cases misclassified.
5.3 Table VI shows the results of fitting the loglinear and the UNIDIFF models to the mobility tables for men and women in 1991 and 2005. For men, the CSF model gives a poor fit to the data. The UNIDIFF model gives a statistically significant improvement in fit over the CSF model. The estimated parameter for 2005 was 0.97, indicating a slight but significant increase in fluidity. This finding is in line with that by Goldthorpe and Mills (2008: 92) where they find a somewhat more salient effect (by a factor of 0.86). In the case of women, neither CSF nor UNIDIFF model gives an acceptable fit to the data according to the conventional criterion, but the latter does make a significant improvement in fit over the former.
5.4 Thus, for both men and women, the evidence suggests some increasing social fluidity over the period covered even though the extent of the increase is rather small. The findings here are somewhat at odds with the 'no-change' result on the individual level data as reported by Goldthorpe and Jackson (2007: Table VI), but are in line with the result on the 'complete' tables (conjugal households) as reported by Goldthorpe and Mills (2008: Table 4). They are also in line with studies using the semi-cohort methods (Heath and Payne, 2000) and those reported in Lambert et al. (2007). While the degree of importance to be attached to the findings on the general pattern may be a matter of judgment and more focused analysis is needed on the localised pattern (as we shall soon see), the more important point here is that our findings are rather different from the declining (relative) mobility as reported by Blanden et al. (2005: Figure 2).
|
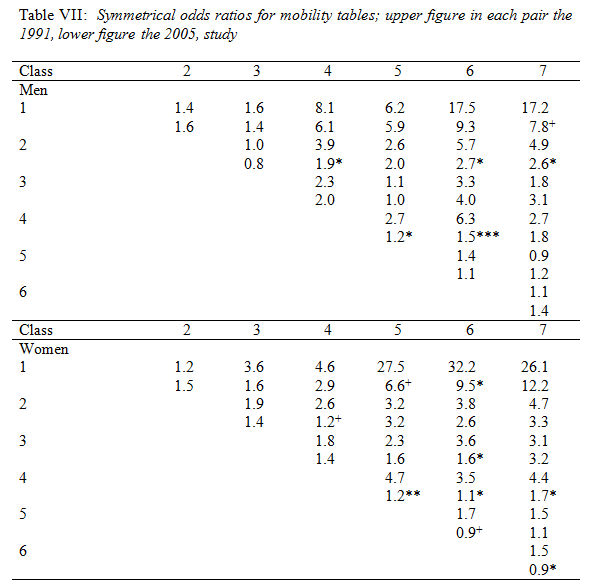
Notes:
Significance tests are conducted for pairs of odds ratios between the two time points:
+ p<0.10; * p<0.05; ** p<0.01; *** p<0.001.
The sums of odds ratios are 93.7 and 60.4 for men, and 139.5 and 60.7 for women in 1991 and 2005, with the ratios falling by 35.5% and 56.5%.
5.5 As the patterns revealed in the loglinear models are of a generalised kind, we show, in Table VII, sets of symmetrical odds ratios derived from Tables IV and V that involve the same pair of origin and destination classes. This will allow us to see more clearly than hitherto the possible changes that occur of a local kind as signalled in outflow tables discussed earlier. We also show results of significance tests for the pairs so that significant changes can be captured at a glance.
5.6 Three features are noticeable. First, for men and women alike, the odds ratios involving Class 4 declined from 1991 to 2005, some significantly so, indicating a declining propensity in intergenerational immobility in this class. The pattern in this regard gives support to the finding reported in Goldthorpe and Jackson (2007: 538) although the magnitude of the odds ratios in our table, especially for men, is smaller than what they find in their cohort data. Secondly, we find, with regard to long-range mobility, that is, odds ratios involving Class 1 and the working classes (6 and 7), a substantial reduction in Class 1 advantages over time. In this respect, our results provide no support to the findings based on the cohort analysis as reported in Goldthorpe and Jackson (2007: 538). For instance, Goldthorpe and Jackson report increasing odds ratios involving Classes 1 and 6 for men and women,[14] but we find markedly declining odds ratios in both cases. Thirdly, the overall patterns in the changes of the odds ratios for men and women is that of a decline (16 out of 21 pair for men and 19 out of 21 pairs for women) indicating narrowing social distances between the origin classes in their children's mobility competitions. In sum, the results show a generally declining propensity of intergenerational immobility in self-employment accompanied both by a sharp reduction in the advantage of the higher salariat over the working classes and by a generally weakening association between origin and destination classes over time.[15]
Public discussion on social mobility
6.1 How do our findings relate to the debate to the current public debate as to whether social mobility is really declining or not? In terms of men's absolute mobility, the prevailing view that total mobility is declining has no support but upward mobility has declined between 1991 and 2005. If the findings are a portent of the future, it is understandable that politicians and media pundits are concerned. After all, public debate on social mobility tends to focus on absolute upward mobility as part of a widespread desire of parents to see their children do better than themselves (Devine, 2004). Interestingly, attention has not focused on the significant increase in downward mobility among men. Of course, this trend could be interpreted in different ways depending on different preoccupations. Academics may welcome increasing downward mobility as evidence of a meritocracy. Middle-class parental concern about the downward mobility of sons, however, may well contribute to public anxiety about trends in men's social mobility overall. Thus, it is not wholly surprising that politicians, media commentators and the public to whom they speak are concerned about the decline in men's absolute upward social mobility. Policy makers are right to be concerned with the life chances of working-class men, and they also voice the concerns, perhaps quite unawares, of the middle class when they talk about the rise in men's downward mobility.6.2 In relation to women's absolute mobility, the consensus opinion about declining total mobility is not supported by the evidence either. On the contrary, upward mobility has increased significantly with evidence of short-range and long-range mobility. Downward mobility has declined but only by a tiny amount. It should not be forgotten, however, that while upward mobility clearly outweighs downward mobility for men (40.6% compared with 31.3% in 2005), the same is not true for women. Rather, downward mobility is slightly higher than upward mobility among women (36.8% compared with 35.9%). Despite the positive change over a 14-year period, women are still less likely to be upwardly mobile and more likely to be downwardly mobile than men. These findings confirm previous work on women's working lives (Dex, 1987, 2003). Moreover, we would add a note of caution to the idea that men and women are now directly competing with each other in the job market and that men may be coming off worse in the competition for good jobs (Goldthorpe and Mills, 2008: 95). After all, men still dominate top jobs in the higher salariat (Class 1). There may be more competition for lower salariat jobs (Class 2) but it is highly likely that men and women do different jobs within this class category. After all, gender segregation persists with, for example, men much less likely to enter the teaching and nursing professions than women (Marshall et al. 1998; Devine, 2010). Moreover, the life chances of working-class women should not be overlooked in public debate and policy making.
6.3 Public debate about mobility rarely focuses on relative mobility while academics see unchanging patterns of social fluidity as a major 'mobility problem' in stratification research and, indeed, as the major problem for politicians and policy makers to address (Goldthorpe, 1987; Goldthorpe and Jackson, 2007; Goldthorpe and Mills, 2004, 2008). Politicians may want Britain to be a meritocracy but rarely acknowledge that a genuine meritocracy involves both upward and downward mobility where the link between origins and destinations is broken. Of course, downward mobility is not something middle-class parents desire when they want their children to do as well as, if not better than, themselves in education and employment (Goldthorpe, 2007; Devine, 2004). Somewhat more optimistic than Goldthorpe and his colleagues although in line with Heath and Payne (2000),[16] Payne and Roberts (2002) and Lambert et al. (2007), we found some positive signs of greater social fluidity with regard to men's and women's social mobility at both general and local levels. That is to say, the chances of middle-class children securing middle-class, and avoiding working-class, jobs have declined relative to the chances of working-class children in the same kind of competition. Contrary to the picture on absolute mobility, this is a 'good news story' for working-class children but it is a 'bad news story' for middle-class children. Thus, these empirical findings on relative mobility pose something of a dilemma for politicians and policy makers who want to please both working-class and middle-class parents because working-class gains have been made with middle-class losses.
6.4 Turning to the position of women, we find that, despite the substantial increase of absolute upward mobility noted earlier in the paper, women are as divided by class as men (Marshall et al. 1988) and are more concentrated in the lower echelon of the salariat. The chances of middle-class daughters securing middle-class careers are better than working-class daughters. To be sure, it is good news that middle-class daughters are now more likely than in the past to become, for example, doctors and lawyers (like their fathers) than teachers, nurses and secretaries for instance (like their mothers). What is regrettable, however, is that working-class daughters do not have the chances to forge such high-level careers and if they enjoy no mobility at all, they are confined to low-level service work in shops and care work, for example, which are poorly paid and have limited career prospects. Overall, while many middle-class women have enjoyed opportunities for advancement in education and employment, working-class women have not done so to the same extent. To repeat, the disadvantaged position of working-class women should not be overlooked in the public debate by politicians and academics.
Conclusion
7.1 In this paper, we have sought to contribute to the ongoing debate among economists and sociologists on patterns and trends of social mobility in contemporary Britain. Using the best data containing mobility information on the general population, namely, the BHPS (1991) and the GHS (2005), we have extended existing research by Goldthorpe and Jackson (2007) and Goldthorpe and Mills (2008). We focused our attention less on unchanging total rates, which conceal rather than reveal, and paid more attention to changing rates of upward and downward mobility. When unchanging total rates are disaggregated, the results show that men's upward mobility is on the decline (although long-range upward mobility is somewhat increased). While the decline is small at the moment, the trend may be a warning of things to come. In this respect, it is not surprising that politicians and media commentators are anxious about the life chances of young men (notably working-class men) growing up in uncertain economic times and especially when men's downward mobility is increasing too. It is a shame, however, that such concern does not extend to the life chances of working-class women who also face difficult times to improve their lives.7.2 Of course, public debate about social mobility is largely preoccupied with absolute mobility and, even more specifically, with absolute upward mobility. This is why the Labour government's report, Unleashing Aspiration, placed a considerable emphasis on a substantial growth in the professions in creating 'a second wave of social mobility' (p. 26) in the near future' and emphasised the importance of education in securing good jobs. Now adopted by the Coalition government, this preoccupation with upward social mobility facilitated by major structural change may be somewhat galling for academic sociologists who place a high premium on the distinction between absolute and relative mobility and are exasperated that most politicians and media commentators do not acknowledge that a genuine meritocracy involves downward mobility as well as upward mobility on the basis of merit. To be sure, the way in which the debate is conducted could be dismissed as purely political. We would argue, however, that it is more constructive to recognise that politicians, policy makers, media pundits and, most importantly, voting parents have different preoccupations to academic researchers on social mobility. Upward mobility, rather than downward mobility, is the name of the game. The ongoing challenge for social scientists of whatever discipline is to understand how and why the debate on social mobility is conducted in the way that it is and to contribute to discussions of policy that improve the life chances of working-class men and women in the lower echelons of the class structure in contemporary Britain.
Notes
1We are most grateful to John Goldthorpe, Anthony Heath, Colin Mills, Geoff Payne and Mike Savage for their very insightful critiques and suggestions on an earlier version of this paper. We are also very grateful to the two anonymous reviewers for their very helpful comments. All errors in the paper remain the responsibility of the authors.2Labour, now in opposition, defended its record in office, noting the growing proportion of poor teenagers who go to university compared with more affluent young people (The Guardian 28/12/10). Not a week goes by, it seems, when a politician does not discuss social mobility and it has certainly loomed large in the latest political controversy over the abolition of the Education Maintenance Allowance (EMAs) and university tuition fees. A cursory search of 'social mobility' on the internet produces a vast amount of commentary on the topic where one can find opinions and comments ranging from The Spectator to Mumsnet. Payne (2010) and Saunders (2010) appear to have best kept on top of the political and policy debates to date. Arguably, the salience of social mobility has risen because it became, first, a way of the last Labour Government, under the (then) new leadership of Gordon Brown, renewing its commitment to equality and fairness and, second, the Coalition Government challenging Labour's record in office with regard to these issues since its election in May 2010.
3This interdisciplinary interest, straddling the divide between economists and sociologists, in intergenerational social mobility is welcome. Ongoing work by Blanden and Gregg, who are now joined by Lindsey Macmillan, should continue to be of interest to sociologists. For example, in a recent working paper, Gregg and Macmillan's analysis of BHPS data has found that the gradient of educational attainment at aged 16 by family background has decreased across generations of young people growing up in the 1970s in comparison to those grown up in the 1980s and the 1990s. They wonder whether this decline in educational inequalities could see an improvement in social mobility. As they rightly point out, much depends on the fate of these young people as they enter the labour market, which they will have done in the 1990s and the 2000s at a time of growing income inequalities (Gregg and MacMillan, 2009).
4This paper focuses on the substantive debate about whether social mobility is declining. We do not engage here in the more technical, methodological, debate about the use of income versus class variables to measure social mobility. It is worthy of note that economists, like sociologists, do not always agree with each other. For example, a number of economists have used income measures but have come to different conclusions on patterns and trends in social mobility to Blanden and her colleagues (Francesconi and Nicoletti, 2006; Ermisch and Nicoletti, 2007; Nicoletti, 2008).
5The reason for using the datasets is due to data consistency on parental and respondents' class. It would be ideal to include more data points for this analysis but our checking proved to be of no avail. For example, the sample sizes in the BGES are too small for our detailed analysis and do not have the NS-SeC class. The Fourth National Survey of Ethnic Minorities (1993/4) has good sample sizes but contains no information on father's job. The Family and Working Life Survey (1996/7) has father's class but it is coded in Social Grades A-E which is incompatible with that used in this paper. The Taking Part survey (2005/6) has a large sample size but pertains to England and Wales only rather than to the whole of Britain. The sample sizes in the British component of the European Social Survey are too small for yearly analysis. It is also noted here that the NS-SeC parental class in BHPS 1991 has been constructed by the BHPS team at the Institute for Socio-Economic Research, University of Essex, and the files containing the variables can be directly downloaded from the UK Data Archive.
6The GHS is the longest standing government annual survey (with breaks in some years) starting in 1972 with around twenty to thirty thousand respondents each year. From 1972 to 1992, it contains information on the respondents' father's class but this information was not collected in the subsequent 12 years. Furthermore, the Social Economic Groups (SEGs) from which the Goldthorpe class is derived has, in the case of father's jobs, the salariat and small employers combined in some of the years, making it impossible to differentiate between the higher and the lower salariat, and between the salariat and small employers. In 2005, as the integration into the GHS of the EU Statistics on Income and Living Conditions Survey (EU-SILC), information on parental occupation was collected again, and in sufficient detail to allow for a direct comparison with the BHPS in terms of the parental and the respondents' NS-SeC class. The NS-SeC is a new instantiation of the well-known Goldthorpe class schema.
7We deviate here from Goldthorpe and Jackson (2007) who only combined women in lower intermediate class (Class IIIb in the Goldthorpe class schema) with unskilled manual workers on the grounds that men are rarely found in such jobs. Further analysis shows that, for the samples used in this paper, a similar proportion of fathers and mothers were found in this class (2.7% of fathers and 2.4% of mothers in the BHPS, and 2.6% of fathers and 2.7% of mothers in the GHS). Male respondents were less likely to be found in this class than female respondents but the proportions were not negligible (2.9% and 3.3% of men as against 4.2% and 5.7% of women in the two surveys respectively). Given this, it is reasonable, we believe, to combine respondents and parents of both sexes in the class with the routine working class in a similar way.
8In the GHS for 2005, respondents' and parents' jobs are coded to the 2002 Standard Occupational Classification (SOC). There are 322 SOC codes for fathers (soc2kf) and 245 codes for mothers (soc2km) in the file which are match-coded into the 35-category long version of the Socio-economic Classifications (SECs) using the respondents' SOC (soc2000). After the parental SECs in the GHS were coded, all the SECs in the two files were recoded consistently into the 7-class NS-SeC schema, with SEC 7.2 for the lower intermediate class combined with the routine manual workers (Class 7 in the 7-class NS-SeC). Since the 2002 SOCs are better revised than the 1991 SOCs upon which the NS-SeC in BHPS 1991 was based, one might expect the NS-SeC in the GHS as being better implemented. While some incompatibility might be entailed, the coding procedures we adopted in the construction of the class variables are, we believe, the best possible effort for comparability.
9We also ran the analysis using father's class and the main patterns are the same as using the dominance class but owing to the smaller sample sizes, some of the analyses, especially in Table VII, are less stable. All tables using father's class are available on request from the authors.
10The NDI is defined as NDxy = pr(X > Y) pr(Y > X), which is further defined as 
 where, in our case, X indicates the class distributions in 1991 and Y indicates the class distributions in 2005. It is noted here that, following the example of Liberson (1975), we reversed the order in the calculation of the NDI such that 1 refers to routine class and 7 to higher salariat.
11The NDI, not shown in the table, between men and women fell from 11.3 to 8.9 between the two time points.
12We have checked the results of women's class distribution in the GHS against that in the Labour Force Survey (LFS) in 2005 for women in the same age groups in Britain. The distributions in Classes 1, 2 and 6 are, for example, almost identical (9.2%, 31.9% and 19.7% in the LFS respectively). Note that we have coded the lower intermediate into Class 7 in the GHS, which cannot be done in the LFS but the overall distribution in Classes 3 and 7 (29.1% in the GHS) is similar to that in the LFS (27.2%).
13The models can be written as:
where O stands for class origin, D for class destination, Y for year of survey. In the UNIDIFF model, Xij indicates the general pattern of the origin-destination association, and ?k the direction and the relative strength of this association specific to a year.
14The results reported in Goldthorpe and Jackson (2007: 538) involving odds ratios for Class 1 and Classes 6&7 competitions for both men and women suggest support for the arguments of a declining social mobility by Blanden and her colleagues. Further analysis on their data shows that the changes in the odds ratios involving Classes 1 and 6&7 are not significant for men but are significant in both cases for women at the 5% levels.
15In the last regard, we refer to the overall tendency rather than to statistical significant per se although in 11 of the pairs compared the change are significant at the 5% level (and in a further 4 cases, the changes are significant at the 10% level).
16The use of quasi-cohort analysis, as Goldthorpe and Mills (2004: 207) point out, has the difficulty in identifying the true trends of fluidity. That is, with this method, the dating of the destination class of the respondents in the same cohort is highly variable, which makes it impossible to work out the population level of fluidity at a particular time point.
References
BLANDEN, J., Gregg, P. and Macmillan, L. (2008) 'Intergenerational persistence in income and social class: the impact of within-group inequality', Centre for Economic Performance, London School of Economics.BLANDEN, J. and Machin, S. (2007) 'Recent Changes in Intergenerational Mobility in Britain', Report for the Sutton Trust, December.
BLANDEN, J., Gregg, P. and Machin, S. (2005) 'Educational Inequality and Intergenerational Mobility' in S. Machin and A. Vignoles (eds) What's the Good of Education? The Economics of Education in the UK, Princeton University Press, pp: 99-114.
BLANDEN, J., Goodman, A., Gregg, P. and Machin, S. (2004) 'Changes in Intergenerational Income Mobility in Britain' in M. Corak (ed.) Generational Income Mobility in North America and Europe, Cambridge: Cambridge University Press, pp: 122-46.
BREEN, R. and Goldthorpe, J. H. (1999) 'Class inequality and meritocracy: a critique of Saunders and an alternative analysis', British Journal of Sociology, 50(1): 1-27. [doi:://dx.doi.org/10.1111/j.1468-4446.1999.00001.x]
DEVINE, F. (2004) Class Practices: How Parents Help Their Children Get Good Jobs, Cambridge, Cambridge University Press. [doi:://dx.doi.org/10.1017/CBO9780511488771]
DEVINE, F. (2009) 'Class', in M. Flinders, A. Gamble, C. Hay and M. Kenny (eds) The Oxford Handbook of British Politics, Oxford: Oxford University Press, pp: 609-628. [doi:://dx.doi.org/10.1093/oxfordhb/9780199230952.003.0033]
DEVINE, F. (2010) 'Class Reproduction, Occupational Inheritance and Occupational Choices', in J. Scott, R. Crompton and C. Lyonette (eds) Gender Inequalities in the 21st Century, Cheltenham: Edward Elgar, pp: 40-58.
DEX, S. (1987) Women's Occupational Mobility: A Life Time Perspective, London: Macmillan
DEX, S. (2003) Families and Work in the 21st century, Bristol: The Policy Press/York: Joseph Rowntree Foundation.
ERIKSON, R. (1984) 'Social Class of Men, Women and Families', Sociology, 18: 500-14. [doi:://dx.doi.org/10.1177/0038038584018004003]
ERIKSON, R. and Goldthorpe, J. H. (1992) The Constant Flux, Oxford: Clarendon Press.
ERIKSON, R. and Goldthorpe, J. H. (2009) 'Social Class, Family Background, and Intergenerational Mobility: A Comment on Mcintosh and Munk', European Economic Review, 53(1): 118-120. [doi:://dx.doi.org/10.1016/j.euroecorev.2008.05.007]
ERIKSON, R. and Goldthorpe, J. H. (2010) 'Has social mobility in Britain decreased? Reconciling divergent findings on income and class mobility', British Journal of Sociology, 61(2): 211-230.
ERMISCH, J. and Nicoletti, C. (2007) 'Intergenerational earnings mobility: changes across cohorts in Britain'. The B E Journal of Economic Analysis and Policy, 7: 1-37.
FRANCESCONI, M. and Nicoletti, C. (2006) 'Intergenerational mobility and sample selection in short panels', Journal of Applied Econometrics, 21(8): 1265-1293. [doi:://dx.doi.org/10.1002/jae.910]
GARRATT, D. and Li, Y. (2005) 'The foundations of experimental/empirical research methods', in B. Somekh and C. Lewin (eds) Research Methods in the Social Sciences, London: Sage, pp: 198-206.
GOLDTHORPE, J. H. (with Llewellyn, C. and Payne, C.) (1987) Social Mobility and Class Structure in Modern Britain, Oxford: Clarendon Press.
GOLDTHORPE, J. H. (2007) On Sociology, Vols. 1&2, Stanford, California: Stanford University Press.
GOLDTHORPE, J. H. and Jackson, M. (2007) 'Intergenerational class mobility in contemporary Britain: political concerns and empirical findings', British Journal of Sociology, 58(4): 526-46. [doi:://dx.doi.org/10.1111/j.1468-4446.2007.00165.x]
GOLDTHORPE, J. H. and Mills, C. (2004) 'Trends in Intergenerational Class Mobility in Britain in the Late Twentieth Century', in R. Breen (ed.) Social Mobility in Europe, Oxford University Press, pp: 195-224. [doi:://dx.doi.org/10.1093/0199258457.003.0008]
GOLDTHORPE, J. H. and Mills, C. (2008) 'Trends in intergenerational class mobility in Modern Britain: evidence from national surveys', National Institute Economic Review, 205: 83-100. [doi:://dx.doi.org/10.1177/0027950108096591]
GREGG, P. and MacMillan, L. (2009) 'Family Income and Education in the Next generation: exploring income gradients in education for current cohorts of youth', Centre for Market and Public Organisation, Working Paper Series No. 09/223.
HALSEY, A., Heath, A. and Ridge, J. (1980) Origins and Destinations: Family, Class and Education in Modern Britain, Oxford: Clarendon Press.
HEATH, A. (1981) Social Mobility, London: Fontana.
HEATH, A. and Payne, C. (2000) 'Social Mobility', in A. H. Halsey with J. Webb (eds.) Twentieth-Century British Social Trends, Basingstoke: MacMillan, pp: 254-78.
HILLS, J. et al. (2010) An Anatomy of Economic Inequality in the UK: Report of the National Equality Panel, London: Government Equalities Office/CASE, Report 60.
LAMBERT, P., Prandy, K. and Bottero, W. (2008) 'By Slow Degrees: Two Centuries of Social Reproduction and Mobility in Britain', Sociological Research Online, 13:1.
LI, Y. (2002) Falling off the ladder? Professional and managerial career trajectories and unemployment experiences, European Sociological Review, 18(3): 253-270. [doi:://dx.doi.org/10.1093/esr/18.3.253]
LI, Y. and Heath, A. (2010) 'Struggling onto the ladder, climbing the rungs: employment status and class position by minority ethnic groups in Britain (1972-2005)', in J. Stillwell, P. Norman, C. Thomas and P. Surridge (eds), Population, Employment, Health and Well-being, London: Springer, pp: 83-97.
LIEBERSON, S. (1975) 'Rand-Sum Comparisons Between Groups', in D. Heise (ed.) Sociological Methodology, (1976), San Francisco: Jossey-Bass, pp: 276-291
MACHIN, S. and Vignoles, A. (2004) 'Educational inequality: the widening socio-economic gap', Fiscal Studies, 25: 107-128. [doi:://dx.doi.org/10.1111/j.1475-5890.2004.tb00099.x]
MARSHALL, G. Newby, H., Rose, D. and Vogler, C. (1988) Social Class in Modern Britain, London: Hutchinson.
NICOLETTI, C. (2008) Multiple Sample Selection in the Estimation of Intergenerational Occupational Mobility. Colchester: Working Paper 2008-20 of the Institute for Social and Economic Research, University of Essex.
PATERSON, L. and Iannelli, C. (2007a) 'Patterns of Absolute and Relative Social Mobility: a Comparative Study of England, Wales and Scotland', Sociological Research Online, 12:6. [doi:://dx.doi.org/10.5153/sro.1637]
PATERSON, L. and Iannelli, C. (2007b) 'Social class and educational attainment: a comparative study of England, Wales and Scotland', Sociology of Education, 80, 330-358. [doi:://dx.doi.org/10.1177/003804070708000403]
PAYNE, G. (1987a) Employment and Opportunity, London: Macmillan
PAYNE, G. (1987b) Mobility and Change in Modern Society, London: Macmillan
PAYNE, G. (2010) 'The new social mobility: how politicians took over a sociological idea', Paper presented at the British Sociological Association Annual Conference, Glasgow Caledonian University, 7-9 April 2010.
PAYNE, G. and Roberts, J. (2002) 'Opening and Closing the Gates: Recent Developments in Male Social Mobility in Britain', Sociological Research Online, 6, 4 [doi:://dx.doi.org/10.5153/sro.664]
ROSE, D. and Pevalin, D. (2003) (eds) A Researher's Guide to the National Statistics Socio-economic Classification, London: Sage.
SAUNDERS, P. (1996). Unequal But Fair? A Study Of Class Barriers In Britain. London: Institute for Economic Affairs.
SAUNDERS, P. (2010) Social Mobility Myths, London: Civitas.
SAVAGE, M. and Egerton, M. (1997) 'Social Mobility, Individual Ability and the Inheritance of Class Inequality', Sociology, 31(4): 645-672. [doi:://dx.doi.org/10.1177/0038038597031004002]
XIE, Y. (1992) 'The Log-multiplicative Layer Effect Models for Comparing Mobility Tables', American Sociological Review, 57: 380-395. [doi:://dx.doi.org/10.2307/2096242]