Self-Organising Map Approach to Individual Profiles: Age, Sex and Culture in Internet Dating
by Teemu Suna, Michael Hardey, Jouni Huhtinen, Yrjö Hiltunen, Kimmo Kaski, Jukka Heikkonen and Mika Ala-Korpela
HYMS (Hull/York Medical School), Helsinki University of Technology, NeuroAgent Ltd, University of Kuopio
Sociological Research Online, Volume 11, Issue 1,
<http://www.socresonline.org.uk/11/1/suna.html>.
Received: 4 Oct 2005 Accepted: 16 Mar 2006 Published: 31 Mar 2006
Abstract
A marked feature of recent developments in the networked society has been the growth in the number of people making use of Internet dating services. These services involve the accumulation of large amounts of personal information which individuals utilise to find others and potentially arrange offline meetings. The consequent data represent a challenge to conventional analysis, for example, the service that provided the data used in this paper had approximately 5,000 users all of whom completed an extensive questionnaire resulting in some 300 parameters. This creates an opportunity to apply innovative analytical techniques that may provide new sociological insights into complex data. In this paper we utilise the self-organising map (SOM), an unsupervised neural network methodology, to explore Internet dating data. The resulting visual maps are used to demonstrate the ability of SOMs to reveal interrelated parameters. The SOM process led to the emergence of correlations that were obscured in the original data and pointed to the role of what we call 'cultural age' in the profiles and partnership preferences of the individuals. Our results suggest that the SOM approach offers a well established methodology that can be easily applied to complex sociological data sets. The SOM outcomes are discussed in relation to other research about identifying others and forming relationships in a network society.
Keywords: Self-Organising Map; Neural Network; Complex Data; Internet Dating; Age; Sex; Culture; Relationship; Visualisation
Background
1.1 The notion that we live in a networked society has become commonplace and reflects the way digital technology and the Internet are transforming various aspect of our social and economic lives. Sociability and the formation and maintenance of social networks have been a central theme of research about the Internet (Holme et al. 2004; Pearson 2004). For example, apparent possibilities for social relationships mediated through the Internet led to a transformation of the debate about 'community' (Rheingold 1993). The social engagement described by Rheingold found a broader audience with films such as You've Got Mail (Brown et al. 1998). While e-mail remains the most popular application on the Internet its role as a 'marriage maker' has been subject to a process of specialisation and commercialisation. Enter 'e-dating' into any search engine in the Internet and a vast number of potential web sites will be revealed. A cursory examination of these sites will show that there are e-dating sites that target a range of sexualities and relationship preferences. For example, Gay.com, which provides a dating service for the gay community, has reported some 10 million visits over a month. Match.com, one popular international Internet dating service, reports over a million members who have paid a subscription. Like the electronic communities, identified in the 1990's as marking a significant new sphere of social interaction, e-dating potentially points to a shift in how people form relationships with others.1.2 In common with other Internet resources, which provide a service for users, e-dating is possible because of the ability of digital media to store, analyse and display large amounts of data in an accessible form. Internet dating services provide an example of a domain where effective delivery of services is dependent on accurate, fast and reliable data analysis. Dating sites commonly use simple search routines that can scan thousands of profiles based on basic demographic information. Such data provide new opportunities and challenges for social research. The data used in this paper was obtained by means of a questionnaire used in an Internet dating service (Heikkinen et al. 2002), providing a data base of approximately 5,000 individuals characterised by around 300 parameters each. Having this kind of data set at hand, at least three eminent needs are faced: i) to pre-process the data into a suitable form for subsequent analysis, ii) to cluster or group the data into meaningful sets, and iii) to visualise the data in such a way that both similarities and differences can be distinguished. These requirements are not unique in sociological data but the computerisation and new experimental technologies, for example, in molecular modelling (Hyvönen et al. 2001), in genomic research (Nikkilä et al. 2002), and in combinatorial chemistry (Kalelkar et al. 2002), have resulted in corresponding problems to handle and analyse extensive, multidimensional data. In many different disciplines, the method of choice to tackle these kinds of data has been to apply self-organising maps (SOMs), an unsupervised neural network technology (Kohonen 1982; 1995).
1.3 The applications of SOMs are not surprising, since artificial neural network (ANN) analysis in general is currently recognized as an effective way to handle complex data in diverse fields (Haykin 1999). This is since ANN analysis, which is a particular branch of statistical analysis, has apparent advantages in the case of complex data relating to complicated, nonlinear associations and processes (Haydon et al. 1998; Väänänen et al. 2002). There has also been an increasing interest in applying ANNs in sociology and related fields (Garson 1998), for example, in the prediction of workplace behaviour (Collins and Clark 1993), in human services (Steyaert 1994; Heikkinen et al. 2002; Hiltunen et al. 2002), in the studies of religious beliefs (Bainbridge 1995), in the representation of social mobility and inequality (Meraviglia 1996), in capturing housing market segmentation (Kauko et al. 2002), as well as in the natural selection and social learning in Prisoner's Dilemma (Macy 1996). There is clearly a scope to utilise SOMs in sociological research as the techniques gains recognition also in medical diagnostic fields (Haydon et al. 1998; Kaartinen et al. 1998; Haydon et al. 2005) and related applications in pain research (Mongini & Italiano 2001; Mongini et al. 2003) and in depression assessment (Gaetz et al. 2004).
1.4 The SOMs are already proving useful in user independent unsupervised visualisation, clustering and modelling of data in various complex situations (Kohonen 1995; Vesanto 2002) and, in addition to the aforementioned applications, for example, in intelligent data mining (Kohonen 1995; Chen et al. 2003). One particularly important asset in the information and communication technology related applications is the ability of SOM analysis to handle both quantitative and qualitative data from complex questionnaires that are intended to describe and profile different situations (Cottrell et al. 2004). Typically used questionnaires consist of hundreds of multi-valued items and therefore result in hundreds of millions of different options to answer. The provision of a usable and understandable result out of this kind of mathematical complexity demands special techniques, the SOM approach being an appropriate choice (Heikkinen et al. 2002; Hiltunen et al. 2002; Cottrell et al. 2004). Generally, the SOM is perhaps the most well known unsupervised artificial neural network model (Kohonen 1982, 1995).
1.5 In this paper we describe an application of SOM methodology to an extensive data from an e-dating site. The resulting visual maps and the defined 'model individuals' are used to demonstrate the ability of SOMs to reveal interrelated parameters and to represent complex social situations. Through this analysis of the information about the characteristics of individual users, as well as those of the partner they desire from the e-dating site, we identify what we refer to as a 'cultural age', as opposed to user's stated age, as being central to the selection of potential partners. This suggests that, one parameter such as the age stated by users, must be situated within a more nuanced characterisation of individuals' profiles and desires in order to understand the role of e-dating in searching for new relationships. We will also show how the SOM analysis is capable of revealing information that would be hard to capture by other methodological techniques. Overall, our results suggest that the SOM approach offers a well established methodology that can be easily applied also to complex sociological data sets.
Internet dating: characteristics and data
2.1 Organisations that operate e-dating sites continue to proliferate but they share some basic features. In order to become 'members' individuals have to complete a more or less detailed questionnaire. The responses to this questionnaire are used to provide information that is available to other users. Sites commonly provide a simple search engine that is organised around basic demographic data such as age and gender. All dating services take care to make it clear to members that it is vital to be truthful when completing the information that makes up their profile. In addition, members in most sites are able to write a self-description and often include a digital photograph. This textual information and image (where included) is displayed to other users. As Hardey (2002) notes users of dating sites are careful to provide accurate information, especially in response to site questionnaires, as they know this will shape the quality of the service they receive. There is also an awareness of the potential embarrassment in meeting another user offline who has been led to believe online that the other member has characteristics that they evidently do not possess. However, such truthfulness may be less apparent amongst individuals who use e-dating sites that do not anticipate search for long-term offline relationships.
2.2 The data used in this paper were collected during 17 months (9/2001 1/2003) from an Internet dating service, called 'The One', that was run on the Internet site of a Finnish main TV channel MTV3. The service was marketed in Finland to people who were 'seriously looking' for a heterosexual 'romantic relationship or a life partner'. Full anonymity was provided to members in that their offline identities were not revealed to other users. To ensure reliability and effectiveness, the service was based on decentralized software architecture, which is described in general by Heikkinen et al. (2002). At no point was it possible to trace individual members to their offline identity. In addition, members gave consent to the use of any data they contributed for the purpose of research when they joined the service.
2.3 The individuals entering the dating service filled in an extensive questionnaire, consisting of approximately 80 questions in various fields of life, categorised as contact details, general information, appearance and physical condition, hobbies and free time, education and work, personal values and the way of life, cultural opinions, food and clothing, relationships and sex, and desires for him/her. The 285 parameters used in the SOM analysis were generated from the individuals' answers to this questionnaire. The questionnaire resulted in both quantitative and qualitative data. The questions concerning qualitative aspects were initially formulated in such a way that a linear approximation for numerical coding of the various options was attainable. For the SOM analysis all the input parameters were then scaled between zero and one.
The self-organising map algorithm and its use
3.1 After the initial introduction of the self-organising map (SOM) method for data visualisation in early 1980's, it has developed as one of the most popular neural network methods in various disciplines (Kohonen 1995). The mathematical details of the SOM algorithm have been considered by several authors (e.g., Kohonen 1989; 1995; Luttrell 1989; Cottrell 1998) and will therefore not be covered here. However, a general intuitive description of applying SOMs will be given below.
3.2 Self-organising maps are a class of unsupervised neural networks whose characteristic feature is their ability to map non-linear relations in multidimensional data sets into visually more approachable, typically two dimensional planes of nodes. The input data to the SOM from each case i, i.e., from each individual i in this particular application, contain a number of parameters (either quantitative or qualitative) used to form a vector di = (di1,di2, ,diN-1,diN). The SOM algorithm (Kohonen 1995) then transforms the input data vectors into a two dimensional map in which each node j, k ( j goes over the rows and k over the columns, total of J rows and K columns) will be represented by a single feature vector xj,k = (xj,k1, xj,k2, , xj,kN-1, xj,kN) representing the original N dimensional parameter space, i.e., the input data. After the self-organising process the point density of the feature vectors follows roughly the probability density of the data thereby making SOM as a valuable tool for detecting similarities and groupings in a data set. The training algorithm is rather simple (and also robust to missing values), and it is easy to visualize the resulting maps. These properties have made SOM a prominent tool in data mining, especially in its initial exploratory phase, since it is to be expected, due to its topology preserving tendency, that the feature vectors of the neighbouring nodes in the two dimensional map are similar to each other and thereby, importantly, the individuals ending up close by nodes are to be similar also in the original N dimensional parameter space (Venna and Kaski, 2001).
3.3 The visualisation phase of SOM analysis is twofold. Firstly, to look at the clusters of nodes (feature vectors) formed that would describe similar individuals (groups) in the original parameter space. Secondly, to depict various input parameters over the two dimensional maps in order to obtain a quick overview on their distribution and values in different nodes, i.e., in the case of each feature vector. In other words, each node describes a model individual, which, in turn, bares a link to the individuals specified in the original N dimensional parameter space each of these N dimensions can be represented over the map nodes resulting in component planes that give a general overview of the parameter values. The SOM algorithm thus offers the possibility to generate a form of average representations of model individuals and identifying sociological similarity of individuals out of multidimensional complexity of various interrelated parameters. Comparing the component planes of two or more parameters in the two dimensional map space may provide insights into the dependencies between the variables and their potential similarities or dissimilarities for the various clusters of model individuals. The use of colour coding in the component planes is particularly helpful since clearly coloured areas as well as correlated changes in the colours of different parameters are visually easy to detect (see Figure 1). While it is difficult to exactly define clusters in the organised map, subtle changes in colours are also good in indicating potentially diffuse borderline areas between various clusters.
3.4 The averaging process of SOM reduces the effect of noise and outliers, and may therefore make any dependency more clear than it eventually is in the original data. It is important to note that the original parameter space of N dimension is included within each node, i.e., within each feature vector. Importantly, however, when a parameter is a component of a feature vector (that is a result of the self-organisation process of the map) it is conditional, so its value relates to all the other N - 1 parameters in the input space. This conditional dependency of the feature vector components of all the other parameters may also bring about new useful variables. For example, the concept of a 'cultural age' will be introduced later as being the original stated age in the presence of all the other N - 1 parameters in the SOM analysis. The multidimensional input data with all the interrelated parameters may therefore, via the conditional self-organisation process of SOM, lead to potentially important and interpretable social variables, being more descriptive of complex social situations as traditional single parameters.
3.5 The SOM computation and analysis was made with the SOM_Toolbox for MATLAB (Kohonen et al., 1996). Linear initialisation and batch learning were applied with default settings. Plain two dimensional maps of size 20 times 15 with a hexagonal grid and a Gaussian neighbourhood function were used. We also did several runs with different map sizes leading to essentially similar results. This was expected since SOM is known not to be particularly sensitive to choices of its size and other parameters (Nikkilä et al., 2002). All the analyses were performed on a laptop PC with a Pentium M, 2.0 GHz processor. The total number of individuals, Nmw in the data set was 4,976 of which 1,655 were women (Nw) and 3,321 were men (Nm). The total number of 285 input data parameters (N), based on the dating site questionnaire, were used in the SOM analysis. Training (the self-organising process) of one SOM took typically less than a minute.
The role of self-organising maps in the analysis of social information
4.1 The dating data analysed here is an example of a complex social situation. The SOM analysis of this data revealed groupings of components that characterise and define model individuals that are intrinsically linked to the input data parameters associated with the embodied individuals. We term those individuals as 'model' because they are built out of the data rather than replicating the exact characteristics of an individual who completed the Internet dating questionnaire. The forthcoming colour visualisations of the component planes will clarify the formation of clustering in the data set, i.e., the grouping of model individuals (represented by the nodes of the SOMs) into sociologically interpretable areas, for example, such as men under 30 years, majority of which are looking for marriage. It is important to realise that these clusters form automatically based entirely on the original data and as a result of the self-organising process of the SOM algorithm thereby being completely independent and unbiased of the users' potential presumptions.4.2 In the dating sense, these resulting model individuals can also be seen as underlying representations of groups of individuals that, when looking for an optimum partner, would turn to individuals with similar kind of attributes, i.e., input data parameters. In dating and relationship related matching, the similarity of the potential partners does not necessarily lead to a successful liaison, even though traditional marriage makers and many Internet dating sites tend to assume the more characteristics are shared between people the more viable a match will be. However, due to the inherent difficulties in optimal matching (no matter what technology), we do not aim to address the use of SOMs in e-dating related matching here but rather to provide an analysis and interpretation of the data obtained from an e-dating site. In addition to the component planes of selected parameters we will also present data of parameter correlations and illustrate that the use of SOM analysis makes it possible to enhance and even reveal correlations that would otherwise be hampered in the variation of the original data. In summary, we intend to illustrate that the use of SOMs is able to 'make sense' of the complex social situations. The general process and outcome of applying a SOM into a sociological case is illustrated in Figure 1.
|
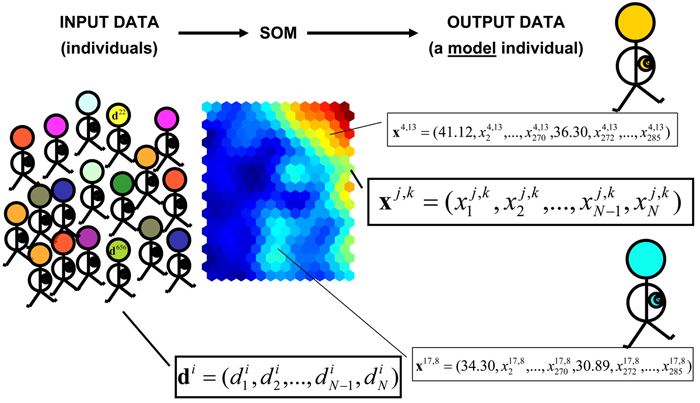
| Figure 1. General illustration of the application of a self-organising map to sociological data. |
4.3 In Figure 1 the input data contain parameters di for each individual i. The parameter values are obtained as answers for an Internet questionnaire resulting in N = 285 and the number of individuals are Nm = 3,321 and Nw = 1,655. The SOM transforms this individual and multidimensional data into a two dimensional plane (j goes over the rows and k over the columns). Each node j, k in the SOM is described by a feature vector xj,k representing the original N dimensional parameter space, i.e., the input data. The feature vectors form, via the self-organising process, from the parameter vectors di of all individuals. Thus, the feature vectors xj,k characterize a form of average individuals, termed model individuals, using exactly the same N dimensional parameter space as originally utilised for the individuals i described by di. The SOM shown in Figure 1 is for men and displays the age component. The feature vectors x4,13 and x17,8 illustrate two values in the case of different model individuals (user's own age, n = 1, and the desired age for the partner, n = 271).
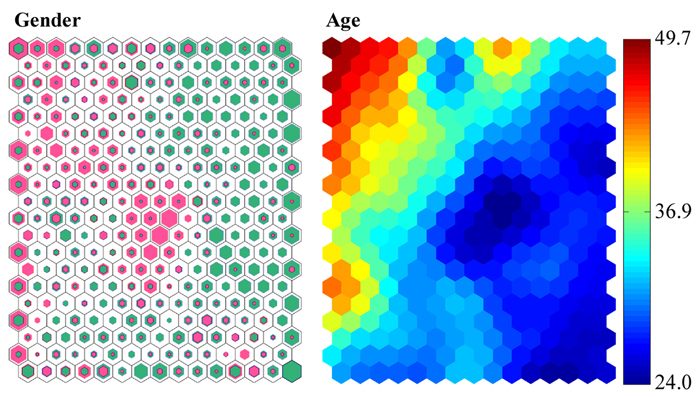
4.4 Using the whole data set (Nmw = 4,976) an overview of the members can be provided. The SOMs displayed in Figure 2 show the distribution of gender and age in a SOM based on input data from both men and women. The first map (Figure 2, Gender) shows the concentration of individuals, i.e., the number of men and women in each node: olive-green denotes men and pink denotes women and the size of the coloured hexagons is proportional to the number of individuals in the particular node. Interestingly, there appears to be nodes that contain mainly men or women. The input data for the SOM analysis in this particular case did not include the gender as one of the 285 input parameters, but following the training process the individuals were labelled according to their gender. Despite this the pattern evident in Figure 2 reflects gender difference. This highlights the way that embodied gender is formative in individuals lifestyle and in their potential preferences and desires for a relationship. In other words, without any information about the gender of members a SOM is produced that indicates distinct gender differences.
4.5 Figure 2 (Age) shows a component plane for age in the case of SOM analysis based on the full data set. It should be noted here that each node may represent any number of individuals and is based on their overall characteristics (input data parameters) rather than a stated age given as an input parameter to the SOM. This means that individuals, who may have different stated ages, but who share similar overall characteristics with others, will be represented in the nearby nodes, i.e., the stated age of each individual is weighted by all the other N - 1 input parameters of the individual during the self-organising process of the SOM. This conditional situation in the SOM analysis may lead to new variables that may bare more relevance to describe complex situations as traditional unconditional parameters. Here, therefore, we wish to interpret the stated age, filtered through the SOM analysis, as a new parameter termed 'cultural age'.
|
| Figure 2. Gender and age illustrated in the SOM analysis based on data including both men and women. |
4.6 Alongside using this concept it becomes understandable that individuals sharing similar sociological characteristics (input data parameters) do tend to cluster together in the SOM analysis. The map representation on the left in Figure 2 is fully comparable to the age-labelled map on the right, i.e., the maps are only different visualizations of the same analysis. The comparison of the gender and cultural age gives an immediate visual impression of these characteristics for each model individual (represented by the feature vector xj,k) or cluster in the map. The SOM analysis, as illustrated in Figure 2, highlights the importance of gender for the organisation and clustering of the maps. Therefore, it is valuable to divide the subsequent SOM analysis for men and women in order to make subtle differences observable in the component plains.
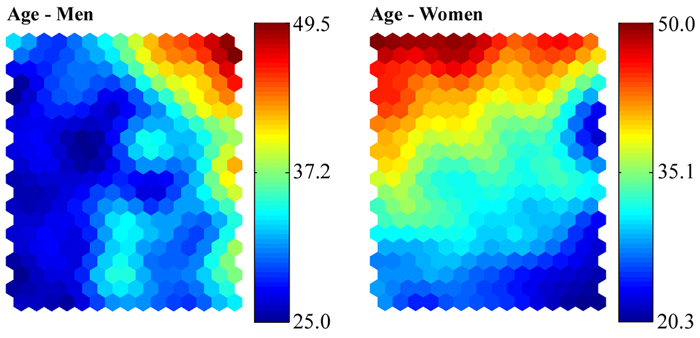
4.7 Figure 3 now shows the component plains for age, i.e., the cultural age defined above, in the case of men (Nm = 3,321) and women (Nw = 1,655) separately. In both maps the colour coding indicates the value of the cultural age parameter in each node (i.e., the age of each model individual in the map). As the data sets are now different it is not possible to make direct comparisons between the maps. It is, however, possible to qualitatively compare the overall patterns in any of the component planes but not to make any quantitative comparisons. Therefore, we can note a clear general organisation of the maps according to the cultural age for both men and for women.
|
| Figure 3. The SOM component planes for cultural age in the case of men and women. |
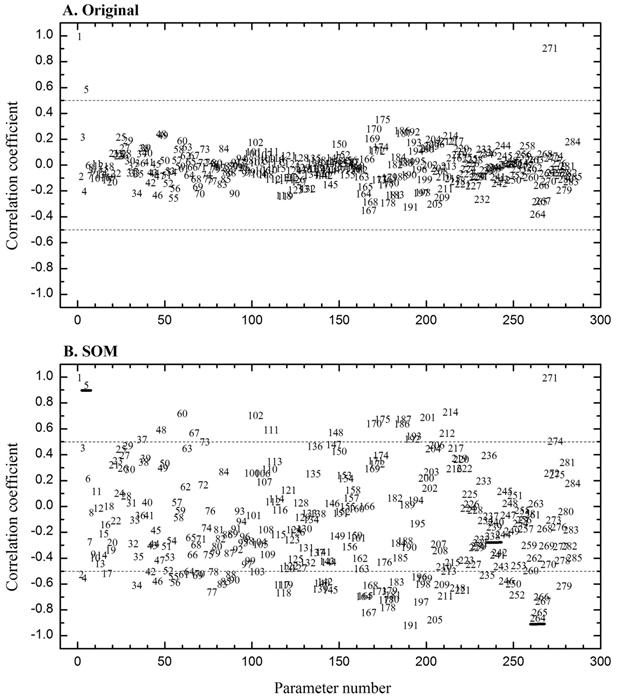
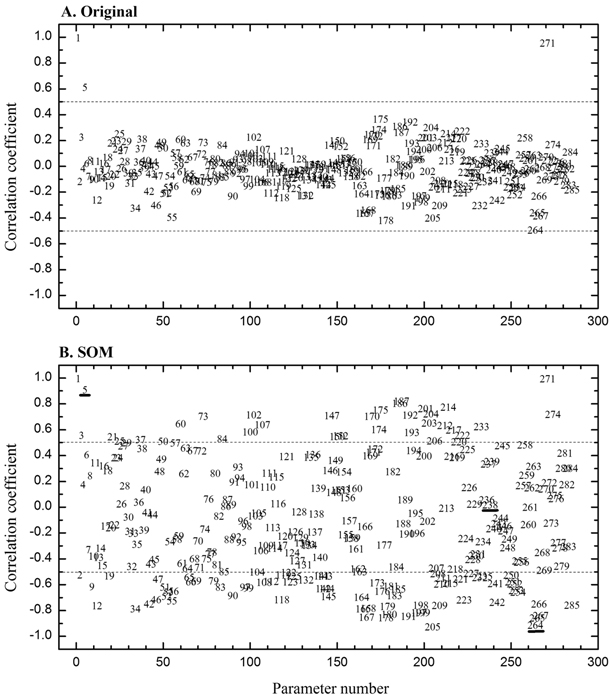
4.8 To reveal the most prominent components to associate with age, we calculated linear correlation coefficients (R) between the stated age and all the other input parameters as well as between the cultural age and all the other conditional parameters in all the feature vectors (the number of feature vectors in all the final SOM analyses was 300, i.e., J = 20 and K = 15). These correlation coefficients for men are illustrated in Figure 4A and 4B, respectively.
4.9 In Figures 4A and 4B the dotted lines denote |R| = 0.5. It is notable that, in the original data, for only three parameters |R| is greater than 0.5. After the SOM analysis, however, for the parameters representing the model individuals, |R| is in several cases greater than 0.5 and in some cases also greater than 0.8, thereby indicating significant linear dependencies between cultural age and some of the other components of the feature vectors (i.e., the model individuals). This is due to the fact that the correlation coefficients calculated for the original data parameters represent direct dependencies between two single (unconditional) parameters but the correlation coefficients calculated for the components describing the model individuals correspond to dependencies between parameters that are linked via the conditional probabilities (see The self-organising map algorithm and its use). The component planes of the underlined parameters in Figure 4 (n = 5 for which R = 0.94, n = 238 for which R = -0.23 and n = 264 for which R = -0.86) are illustrated in Figure 5 in comparison to the component plain of the cultural age.
|
| Figure 4. Correlation coefficients for men between the stated age and all the other input parameters (original data) (A) and between the cultural age and all the other feature vector components (data filtered through the SOM) (B). |
4.10 Comparison of the correlation coefficients for the original parameters (Figure 4A) and for the parameters of the model individuals (Figure 4B) demonstrate the ability of SOM analyses to uncover conceptual relationships, such as the cultural age, that are not directly observable from an extensive complex data set. This is a good indication of the usefulness of the averaging process of SOM to reduce the effect of noise and outliers in a data set and thereby to reveal dependencies that might otherwise be hampered.
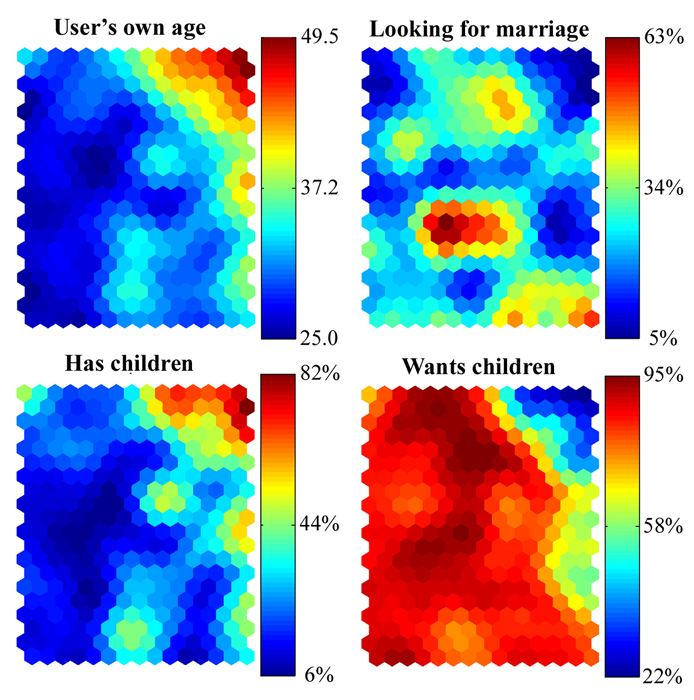 |
| Figure 5. The SOM component planes for the cultural age, for the 'looking for marriage', for the 'has children' and for the 'wants children' component in the case of men. |
4.11 To further comprehend the ability of SOMs to provide a more nuanced account of the data it is interesting to examine the component planes drawn in Figure 5 in more detail. The colour coding indicates the value of the cultural age component (in years) and the other parameters (in %) in each node, i.e., the values of these components for all the model individuals depicted by the map. It is useful to note, that the maps shown in Figure 5 are different visualizations of exactly the same analysis (i.e., based on the same feature vectors resulting from the same self-organising process) making all the illustrated maps fully comparable. The component values represent the conditional SOM output, i.e., the values xj,kn of the feature vectors (see Figure 1). For example, for the 'looking-for-marriage' component the red areas mean that those individuals displayed in these nodes have an approximately 50 to 63 % probability to be 'looking for marriage'. The linear correlation coefficient R for the cultural age and the 'looking-for-marriage' parameter (n = 238) is -0.23 (i.e., there is no clear linear dependence between these two parameters). Correspondingly, visual comparison of the maps for these parameters does not show any evident clusters that would visibly link the 'looking-for-marriage' component to the cultural age.
4.12 In contrast, the correlation coefficient for the cultural age and the 'has-children' component (n = 5) is 0.94 and for the cultural age and the 'wants-children' component (n = 264) it is -0.86. These correlations confirm the generally held observation that younger men are less likely to have children than older men who in turn may not desire further children in any new relationship (Coupland 2000; Jagger 2005). In fact, the component planes indicate that approximately 80% of the older men already have children (i.e., there is a clear positive and a clear negative linear dependence between the components, respectively). Therefore, a comparison of the component planes in Figure 5 demonstrates a marked resemblance of the formed colouring patterns: in the case of positive correlation ('has-children' component) the high-value and low-value areas coincide while in the case of negative correlation ('wants-children' component) the high-value and low-value areas in the component planes are almost opposite.
 |
| Figure 6. Correlation coefficients for women between the stated age and all the other input parameters (original data) (A) and between the cultural age and all the other feature vector components (data filtered through the SOM) (B). |
4.13 A similar exercise as done above for men can also be undertaken using the data set based on women's responses to the questionnaire. Accordingly, Figure 6A shows now the correlation coefficients for women between the stated age and all the other input parameters and Figure 6B between the cultural age and all the other feature vector components as well as Figure 7 illustrates the SOM component planes for the cultural age, for the 'looking for marriage', for the 'has children' and for the 'wants children' component in the case of women.
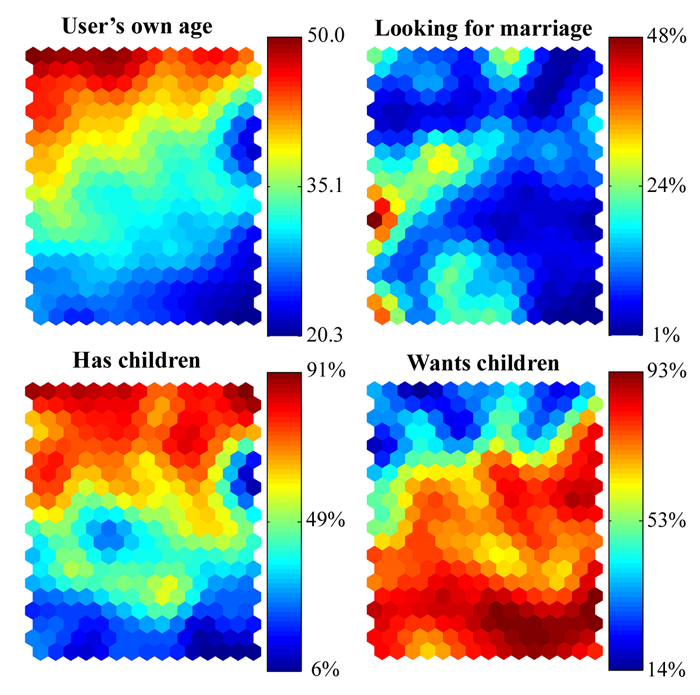 |
| Figure 7. The SOM component planes for the cultural age, for the 'looking for marriage', for the 'has children' and for the 'wants children' component in the case of women. |
4.14 As illustrated for men in Figure 4, the comparison of the correlation coefficients for the original parameters (Figure 6A) and for the components of the model individuals (Figure 6B) demonstrate the ability of SOM analysis to uncover conceptual relationships that are not directly observable from an extensive complex data set. Note similar but far from identical behaviour of correlation coefficients for men (Figure 4) and for women (Figure 6). In Figure 7, similarly as in the case of men in Figure 5, the colour coding indicates the value of the cultural age component (in years) and the other parameters (in %) in each node, i.e., the values of these components for all the model individuals in the map.
4.15 As in the case of men in Figure 5, it is now evident from Figure 7 that there is no linear correlation between the cultural age and the 'looking-for-marriage' component (n = 238; |R| = 0.02). Correspondingly, comparison of the component planes does not show any evident clusters that would visibly link the 'looking-for-marriage' and the cultural age components. For example, there are widespread dark blue areas for the 'looking-for-marriage' component, indicating that approximately less than 10 % of the individuals 'look-for-marriage' in these areas. However, the corresponding areas in the component plane for the cultural age range through the whole spread (from 20 to 50 years) of the model individuals, demonstrating that the cultural age cannot be used as an indication of women's interest to look for marriage. Nevertheless, the correlation coefficient for the cultural age and the 'has-children' component (n = 5) is 0.91 and for the cultural age and the 'wants-children' component (n = 264) it is -0.91, i.e., there is a clear positive and a clear negative linear dependence between these components, respectively. Parallel to this, the labelled maps for these parameters show marked visual resemblance for the formed colouring patterns, as was also the case for men (Figure 5).
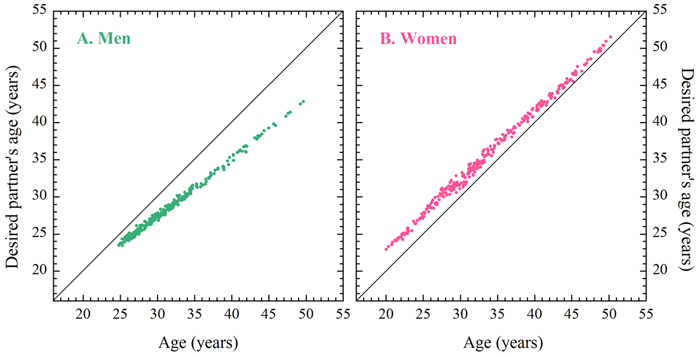
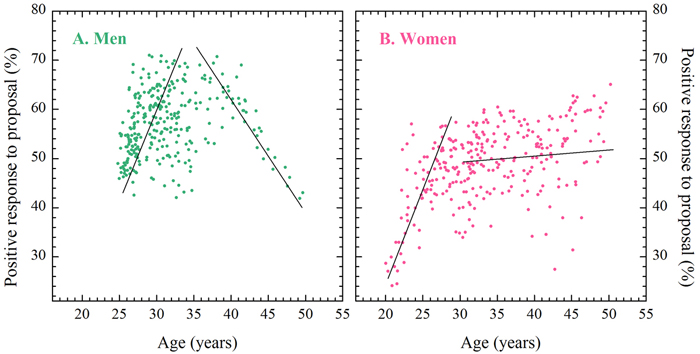
4.16 In addition to the above, we would also like to point out how clearly the SOM analysis is able to depict the quite well known dependence between the age of the daters and the age of the potential partner they are seeking: Figure 8A displays the dependence between the cultural age and the conditional desired age of a partner for men and Figure 8B the same dependence for women. The linear correlation coefficients in this case are 0.997 for men and 0.998 for women. While the correlation coefficients are excellent for both men and women, there is a clear gender difference. Men are consistent in seeking women who are younger than them while the opposite is true for women. The lines drawn in Figures 8A and 8B are used only to guide the eye and represent a 1:1 relationship between the plotted values. Thus, it can be noted that men tend to seek relatively younger partners the older they get themselves. In the case of women, there is a slight tendency for the desired age of a potential partner to decrease along the age of women (Jagger 2005).
 |
| Figure 8. The dependence between the cultural age and the conditional desired age of a partner for men (A) and for women (B). |
4.17 Figure 8 is a good demonstration of a linear dependence between two components. It is important to keep in mind that the coloured component planes of SOMs tend easily visualise general linear dependencies. Therefore, in order to be able to depict correlating subgroups or higher order dependencies, the components must be looked at separately.
4.18 In the analysis of extensive data sets it is, however, useful to make a quick visual comparison on all the component planes to distinguish possible clear dependencies in the data. In Figure 9 the cultural age is drawn together with a component that shows the response to a question about marriage after a relationship had been enacted offline for over six months. The linear correlation coefficient in the case of men is 0.12 and in the case of women it is 0.48. Looking at the linear correlation coefficients alone thus implies that there is no clear linear dependence between these two components. However, looking at Figure 9 clear trends are evident (the lines are drawn to guide the eye and denote an approximate trend in the component behaviours). In the case of men the highest interest for marriage seems to be among the middle aged men and the interest seems to decrease towards both older and younger men. In contrast, for women, there seems to be only a group of younger women who seem to be more cautious about getting married as other women. These gender related differences are consistent with research conducted on the stated age of men who use newspaper advertisements or 'lonely hearts' columns and the age of their desired partners (e.g., Greenless & McGrew 1994; Jagger 2001; 2005).
|
| Figure 9. The dependence between the cultural age and the conditional intention for marriage for men (A) and for women (B). |
Age, culture, profiles and truth
5.1 From the initial SOM analysis (Figure 2) of the data from 'The One' dating service we saw how members were displayed in a way that reflected gendered groupings despite the parameter for male or female not being present in the input data. This indicates how the responses to the questionnaire are 'gendered' in that they relate to differences in cultural life and aspirations for partnership. While gender may be formative for potential partnership selection within heterosexual dating sites this suggests that it is viewed in combination of other parameters such as leisure activities and parenthood. Indeed, as Internet dating takes advantage of new technologies to include for example, photographs, web cams and voice messages, in order to come closer to traditional offline meetings of strangers, the more demands will also be made on complex data (Merkle & Richardson 2000). The complex data that may be collected through e-dating questionnaires can generate a more nuanced picture of the possibilities for site members. For example, in Figure 7 a grouping of younger women can be noticed who have children (several light greenish nodes surrounded by cyan nodes) while Figure 5 indicates that older men were less interested in fathering children than younger men. Given the stated age preferences for potential partners (Figure 8) this suggests that there is a smaller 'market' of potential partners for lone parents. Indeed there are special e-dating sites that are intended for lone parents and those who may not wish to preclude them from their potential partners <http://www.lone-parents.org.uk/personals/>.5.2 The groupings of model individuals suggest that rather than to view all members of an e-dating site as competing on an equal basis for possible partners there are groupings that have more or less opportunity to meet others who share common cultures and desires. For example, it has been pointed out that younger women are significantly more interested in accessing erotica on the Internet than their older counterparts (Cooper et al. 2003). There is potential here for development of instruments to elicit appropriate data from users that can be made available to advanced search and matching technologies. In other words, it is worthwhile to create instruments to produce high quality parameters as this will help members find others from a mass of complex data (Norberg & Dholakia 2004). Such developments would sharply contrast with the early use of computers in dating services where the use of computers was simply used to legitimate claims to 'scientific' matching (Godwin 1973). However, as e-dating increases in popularity users may demand facilities that produce closer matches and consequently potentially more rewarding offline meetings than the simple search and browse routines currently available in most e-dating sites. Interestingly, against a continued ordinary misjudgement, an extensive study of a Canadian Internet dating site concluded that people who take part in computer mediated dating activities are not social isolates but engaged in a range of cultural and social activities (Brym & Lenton 2001).
5.3 Following the above it is evident that the more profile data there is available the better the embodied self will be reflected. Individuals are by necessity represented by both qualitative and quantitative parameters. The strength of the SOM approach here is thus partly the ability to use the relevant data in a simultaneous analysis. It has recently been suggested, however, that in the case of surveys combining qualitative and quantitative data, SOM analysis should first be conducted using only the quantitative data after which the qualitative data should be brought in (Cottrell et al. 2004). They also noted that in the case of linear dependence of a category type of parameter it could be coded using numerical values. This is a relevant point since coding nonlinear or category parameters in a quantitative manner is intrinsically difficult and likely to impose bias in the SOM analysis. In this particular application the best possible description of the embodied self is crucial. Therefore, the questions concerning qualitative aspects were initially formulated in such a way that a linear approximation for numerical coding was implied (see Internet dating: characteristics and data). By following this assumption we were able to use both qualitative and quantitative parameters simultaneously in the SOM analyses and to represent the embodied self as thoroughly as possible.
5.4 Following the division of the data into men and women the application of SOM revealed how the individuals were shaped by the cultural age. Age is part of the basic demographic information collected by every e-dating service and is often formative in generating the results of searches of members. Analysis of newspaper 'lonely hearts' advertisements have highlighted the significance of age as a marker in individuals profiles (Davis 1990; Coupland 1996). While print based advertisers do not necessarily specify a prospective partners age it has been found that women tend to look for older men and that men seek younger women (e.g., Greenless & McGrew 1994; Harrison & Saeed 1977; Willis & Carlson 1993). Psychological research has suggested that this phenomenon is due to traits where 'youth' is a positive attribute for women and the converse would be true for men (Davis 1990; Harrison & Saeed 1977). Figure 8 illustrates a similar trend amongst members of 'The One' dating service. However, our analysis points to the potential of a more nuanced and culturally embedded conceptualisation of age.
5.5 While individuals may not report their true age in e-dating services, the other information they provide about themselves and those they are seeking situates them in a cultural/economic/bodily context. Research into newspaper advertisements has highlighted the age factor and our investigation of Internet dating confirms the importance of age but in a broader context. Our conceptualisation of cultural age can be thought of as representing a body project in which age is one factor (Shilling 2000). As Featherstone (1991) notes the body visibly reflects age and other attributes that have become commodified as people seek to display bodies that do not denote their age. This suggests that 'age' is essentially social when people are seeking potential partners.
5.6 Indeed, as Jagger (2005) suggests, older newspaper advertisers may 'qualify' their age to emphasise 'their essential youthfulness' (p. 95). Internet dating sites represent one of the spaces within the Internet where users cannot escape the embodied self (Featherstone 1995; Hardey 2004). It also points to the essential 'truthfulness' of individual's responses to such sites requirements for profiling data. The truth here is qualified in that it is not the response to a single question that may be more or less manipulated by an individual user but rather the way overall responses shape possible interactions within the site. A degree of caution should be noted, however, that some individuals could systematically enter false data, although this would require some careful forward planning, and be liable to be detected by others should an interaction take place online, and almost certainly during an offline meeting.
5.7 It is currently recognised that consumers are being increasingly asked to provide personal information in exchange for individually tailored services. As Norberg & Dholakia (2004) have recently pointed out, dating services truly exemplify the issues associated with information disclosure intended for marketing use. It has been recognised that the consumers consider financial information as the most sensitive with respect to a commercial disclosure request, but are much more willing to provide demographic or lifestyle information (Phelps et al. 2000). Therefore, it is expected that many Internet daters, in exchange for customisation benefits, are likely to provide truthful information particularly in the case of non-financial enquiries. Indeed, users of e-dating sites are deceiving both themselves and any potential online contacts if they move too far into a self description that is detached from their offline social and bodily self.
Conclusion
6.1 In this paper we have shown how SOM analysis provides a way of 'sorting people' out from complex data. In doing this we have focused on data derived from an Internet dating service as it provided a rich source of complex social data. While SOM is increasingly used in biological and other fields its application in social science is rare. The analysis of e-dating material has highlighted the way that 'cultural age' is significant in profiling the individuals and their potential choices. Decisions by users to explore others profiles and in some cases contact individuals are likely to be influenced by a range of information that is available. This might be thought of as forming 'virtual selves' that are anchored in the embodied user who desires an offline relationship. Such virtual selves are formed of many parameters some of which may be contradictory or qualified or false but all conspire to a potential partner. In other words, as in the 'real world', human desire and the need for close relationships is shaped and driven by many, sometimes conflicting needs, wants and desires.
References
BAINBRIDGE, W. S. (1995) 'Neural Network Models of Religious Belief', Sociological Perspectives, vol. 38, pp. 483 - 495.
BROWN, G. M., DURK, J. and EPHRON, O. (Producers) (1998) 'You've Got Mail', Warner Brothers.
BRYM, R. J. and LENTON, R. L. (2001) 'Love Online: A Report on Digital Dating in Canada', <http://www.nelson.com/nelson/harcourt/sociology/newsociety3e/loveonline.pdf>
CHEN, H., LALLY, A. M., ZHU, B. and CHAU, M. (2003) 'HelpfulMed: Intelligent Searching for Medical Information over the Internet', Journal of the American Society for Information Science and Technology, vol. 54, pp. 683 - 694.
COLLINS, J. M. and CLARK, M. R. (1993) 'An Application of the Theory of Neural Computation to the Prediction of Workplace Behavior: An Illustration and Assessment of Network Analysis', Personnel Psychology, vol. 46, pp. 503 - 524.
COOPER, A., MÅNSSON, S. A., DANEBACK, K., TIKKANEN, R. and ROSS, M. W. (2003) 'Predicting the Future of Internet Sex: Online Sexual Activities in Sweden', Sexual and Relationship Therapy, vol. 18, pp. 277 - 291.
COTTRELL, M. (1998) 'Theoretical Aspects of the SOM Algorithm', Neurocomputing, vol. 21, pp. 119 - 138.
COTTRELL, M., IBBOU, S., and LETRÉMY, P. (2004) 'SOM-Based Algorithms for Qualitative Variables', Neural Networks, vol. 17, pp. 1149 - 1167.
COUPLAND, J. (1996) 'Discourses of the Commodified Self', Discourse and Society, vol. 7, pp. 187 - 207.
COUPLAND, J. (2000) 'Past the "Perfect Kind of Age"? Styling Selves and Relationships in Over-50s Dating Advertisements', Journal of Communication, vol. 50, pp. 9 - 30.
DAVIS, S. (1990) 'Men as Success Objects and Women as Sex Objects: A Study of Personal Advertisements', Sex Roles, vol. 23, pp. 43 - 50.
FEATHERSTONE, M. (1991) 'The Body in Consumer Culture', in M. Featherstone, M. Hepworth and B. S. Turner (eds), The Body: Social Process and Cultural Theory. London: Sage.
FEATHERSTONE, M. (1995) 'Post-bodies, Aging and Virtual Reality', in M. Featherstone and A. Wernick (eds), Images of Aging: Cultural Representations of Later Life. London: Routledge
GAETZ, M., IVERSON, G. L., RZEMPOLUCK, E. J., REMICK, R., MCLEAN, P., and LINDEN, W. (2004) 'Self-Organizing Neural Network Analyses of Cardiac Data in Depression', Neuropsychobiology, vol. 49, pp. 30 - 37.
GARSON, G. D. (1998) Neural Networks. An Introductory Guide for Social Scientists. London: SAGE.
GODWIN, J. (1973) The Mating Trade. New York: Doubleday.
GREENLESS, I. A. and MCGREW, W. C. (1994) 'Sex and Age Differences in Preferences and Tactics of Mate Attraction: Analysis of Published Advertisements', Ethology and Sociobiology, vol. 15, pp. 59 - 72.
HARDEY, M. (2002) 'Life Beyond the Screen: Embodiment and Identity through the Internet', Sociological Review, vol. 50, pp. 571 - 585.
HARDEY, M. (2004) 'Internet dating: New Forms of Sociability in the Information Age', Information Communication and Society, vol. 7, pp. 207 - 222.
HARRISON, A. A. and SAEED, L. (1977) 'Let's Make a Deal: An Analysis of Revelations and Stipulations in Lonely Hearts Advertisements', Journal of Personality and Social Psychology, vol. 35, pp. 257 - 264.
HAYDON, G. H., JALAN, R., ALA-KORPELA, M., HILTUNEN, Y., HANLEY, J., JARVIS, L. M., LUDLAM, C. A. and HAYES, P. C. (1998) 'Prediction of Cirrhosis in Patients with Chronic Hepatitis C Infection by Artificial Neural Network Analysis of Virus and Clinical Factors', Journal of Viral Hepatitis, vol. 5, pp. 255 - 264.
HAYDON, G. H., HILTUNEN, Y., LUCEY, M. R., COLLETT, D., GUNSON, B., MURPHY, N., NIGHTINGALE, P. G. and NEUBERGER, J. (2005) 'Self-Organizing Maps Can Determine Outcome and Match Recipients and Donors at Orthotopic Liver Transplantation.', Transplantation, vol. 79, pp. 213 - 218.
HAYKIN, S. (1999) Neural Networks. A Comprehensive Foundation. Second edition, Upper Saddle River, New Jersey: Prentice Hall International.
HEIKKINEN, K., RAUTIAINEN, P., HUHTINEN, J., HILTUNEN, Y. and ALA-KORPELA, M. (2002) 'Design and Implementation of Intelligent Cross Media Services in a Modern Information Society', In Proceedings of the First International Conference on Information Technology & Applications (ICITA 2002), Bathurst & Sydney, Australia, November 2002.
HILTUNEN, Y., HEIKKINEN, K., HIETAVIRTA, P. and ALA-KORPELA, M. (2002) 'Intelligent Political Matching: Integration of a Self-Organising Map into an Internet Service', In Proceedings of the joint 1st International Conference on Soft Computing and Intelligent Systems (International Session of 18th Soft Fuzzy Systems Symposium and 3rd International Symposium on Advanced Intelligent Systems), Tsukuba, Japan, October 2002.
HOLME, P., EDLING, C. R. and LILJEROS, F. (2004) 'Structure and Time Evolution of an Internet Dating Community', Social Networks, vol. 26, pp. 155 - 174.
HYVÖNEN, M. T., HILTUNEN, Y., EL-DEREDY, W., OJALA, T., VAARA, J., KOVANEN, P. T. and ALA-KORPELA, M. (2001) 'Application of Self-Organizing Maps in Conformational Analysis of Lipids', Journal of the American Chemical Society, vol. 123, pp. 810 - 816.
JAGGER, E. (2001) 'Marketing Molly and Melville: Dating in a Postmodern, Consumer Society', Sociology, vol. 35, pp. 39 - 57.
JAGGER, E. (2005) 'Is Thirty the New Sixty? Dating, Age and Gender in a Postmodern Consumer Society', Sociology, vol. 39, pp. 89 - 90.
KAARTINEN, J., HILTUNEN, Y., KOVANEN, P. T. and ALA-KORPELA, M. (1998) 'Application of Self-Organising Maps for the Detection and Classification of Human Blood Plasma Lipoprotein Lipid Profiles on the Basis of 1H NMR Spectroscopy Data', NMR in Biomedicine, vol. 11, pp. 168 - 176.
KALELKAR, S., DOW, E. R., GRIMES, J., CLAPHAM, M. and HU, H. (2002) 'Automated Analysis of Proton NMR Spectra from Combinatorial Rapid Parallel Synthesis Using Self-Organizing Maps', Journal of Combinatorial Chemistry, vol. 4, pp. 622 - 629.
KAUKO, T., HOOIMEIJER, P. and HAKFOORT, J. (2002) 'Capturing Housing Market Segmentation: An Alternative Approach based on Neural Network Modelling', Housing Studies, vol. 17, pp. 875 - 894.
KOHONEN, T. (1982) 'Self-Organizing Formation of Topologically Correct Feature Maps', Biological Cybernetics, vol. 43, pp. 59 - 69.
KOHONEN, T. (1989) Self-Organization and Associative Memory. Berlin: Springer-Verlag.
KOHONEN, T. (1995) Self-Organized Maps. Berlin: Springer-Verlag.
KOHONEN, T., HYNNINEN, J., KANGAS, J. and LAAKSONEN, J. (1996) SOM_PAK: The Self-Organizing Map Program Package, Report A31, Helsinki University of Technology, Laboratory of Computer and Information Science, Espoo, Finland.
LUTTRELL, S. P. (1989) Self-Organisation: A Derivation from First Principles of a Class of Learning Algorithms, in Proc. IJCNN.89 Int Joint Conf. On Neural Networks, vol. 2, pp. 495 - 498.
MACY, M. (1996) 'Natural Selection and Social Learning in Prisoner's Dilemma. Coadaptation with Genetic Algorithms and Artificial Neural Networks.', Sociological Methods & Research, vol. 25, pp. 103 - 137.
MERAVIGLIA, C. (1996) 'Models of Representation of Social Mobility and Inequality systems. A Neural Network Approach', Quality and Quantity, vol. 30, pp. 231 - 252.
MERKLE, R. E. and RICHARDSON, R. A. (2000) 'Digital Dating and Virtual Relating: Conceptualizing Computer Mediated Romantic Relationships', Family Relations, vol. 49, pp. 187 - 192.
MONGINI, F. and ITALIANO, M. (2001) 'TMJ Disorders and Myogenic Facial Pain: A Discriminative Analysis using the McGill Pain Questionnaire', Pain, vol. 91, pp. 323 - 330.
MONGINI, F., DEREGIBUS, A., RAVIOLA, F. and MONGINI, T. (2003) 'Confirmation of the Distinction Between Chronic Migraine and Chronic Tension-type Headache by the McGill Pain Questionnaire', Headache, vol. 43, pp. 867 - 877.
NIKKILÄ J., TÖRÖNEN, P., KASKI, S., VENNA, J., CASTRÉN, E., and WONG, G. (2002) 'Analysis and Visualization of Gene Expression Data Using Self-Organizing Maps', Neural Networks, vol. 15, pp. 953 - 966.
NORBERG, P. A. and DHOLAKIA, R. R. (2004) 'Customerization, Information Provision and Choice: What Are We Willing to Give Up for Personal Service?', Telematics and Infromatics, vol. 21, pp. 143 - 155.
PEARSON, H. (2004) 'Internet Dating Analysed: Study of Online Relations May Reveal Winning Tactics', Nature News Service, April 23, <http://www.nature.com/news/2004/040419/pf/040419-10_pf.html>
PHELPS, J., NOWAK, G. and FERRELL, E. (2000) 'Privacy Concerns and Consumer Willingness to Provide Personal Information', Journal of Public Policy & Marketing, vol. 19, pp. 27 - 41.
RHEINGOLD, H. (1993) The Virtual Community: Homesteading on the Electronic Frontier. Reading MA, Addisons-Wesly.
SHILLING, C. (2000) The Body and Social Theory. London: Sage.
STEYAERT, J. (1994) 'Soft Computing for Soft Technologies: Artificial Neural Networks and Fuzzy Set Theory for Human Services', Computers in Human Services, vol. 10, pp. 55 - 67.
VENNA, J. and KASKI, S. (2001) 'Neighborhood Preservation in Nonlinear Projection Methods: An Experimental Study', In Proceedings of International Conference on Artificial Neural Networks (ICANN) 2001, Vienna, Austria.
VESANTO, J. (2002) Data Exploration Process Based on the Self-Organizing Map. Acta Polytechnica Scandinavica, Mathematical and Computing Series No. 115., Espoo, Helsinki University of Technology.
VÄÄNÄNEN, T., KOSKELA, H., HILTUNEN, Y. and ALA-KORPELA, M. (2002) 'Application of Quantitative Artificial Neural Network Analysis to 2D NMR Spectra of Hydrocarbon Mixtures', Journal of Chemical Information and Computer Sciences, vol. 42, pp. 1343 - 1346.
WILLIS, F. N. and CARLSON R. A. (1993) 'Singles Ads: Gender, Social Class and Time', Sex Roles, vol. 29, pp. 387 - 404.