Applying Ragin's Crisp and Fuzzy Set QCA to Large Datasets: Social Class and Educational Achievement in the National Child Development Study
by Barry Cooper
University of Durham
Sociological Research Online, Volume 10, Issue 2,
<http://www.socresonline.org.uk/10/2/cooper.html>.
Received: 9 Dec 2004 Accepted: 21 Apr 2005 Published: 30 Jun 2005
Abstract
The paper explores the use of Charles Ragin's Qualitative Comparative Analysis (QCA) in both its crisp and fuzzy set versions in the study of the relations between social class origin, sex, 'ability' and subsequent educational achievement. The work reported is part of a larger ongoing project which is employing QCA to compare these relations within two birth cohorts. Here data are used from the British National Child Development Study, i.e. from children born in 1958. The paper has a methodological focus, bringing out the strengths but also the difficulties that arise when employing QCA with a large dataset of this type. In particular, the problem of calibrating membership in fuzzy sets in a context where detailed case knowledge is not available is illustrated. It is also shown how the use of gradually increasing thresholds with Ragin's fs/QCA software can bring out the relative importance of various factors in accounting for achievement. The QCA-based analysis suggests that the processes of educational attainment can, at best, only be seen as partly falling under a 'meritocratic' description. It is also hoped that this paper will serve as a useful introduction to the potential of QCA for readers not yet familiar with it.
Keywords: QCA, Social Class, Educational Attainment, Gender, Fuzzy Sets, Meritocracy.
Introduction
1.1 The purpose of this paper is to report on a small part of some work in progress which has the aim of exploring the use of Charles Ragin's qualitative comparative analysis[1] (QCA) and its associated fs/QCA software to analyse data from the longitudinal National Child Development Study (NCDS)[2] involving some 17,000 children born in one week in March 1958. Here my focus is as much on method as on substantive findings. The focus of this ongoing research is on the extent to which the processes through which individuals achieved both qualifications and social class destinations appear to have been compatible with meritocratic principles. These data have been used for this purpose before. A range of methods have been employed to answer the question 'might Britain be a meritocracy?' with vigorous debate ensuing over both the appropriateness of the methods employed and the meaning of the results obtained (Marshall & Swift 1993, 1996; Saunders 1995, 1996, 1997, 2002; Lampard, 1996; Savage & Egerton, 1997; Breen & Goldthorpe 1999, 2001, 2002; Bond & Saunders 1999). Meritocracy has been understood in this work as involving the achieving of positions via the exercise of 'ability plus effort' in contradistinction to a process whereby class destination reflects such ascriptive factors as class origin and sex (Young, 1958).1.2 It is clear from this existing work that the pattern of links between various prior features and conditions of individuals, on the one hand, and their attainment of both qualifications and class position, on the other, can be seen as falling partly under a meritocratic description, as defined above, and partly as not. One reason for this finding, aside from the obvious difficulties of deciding just how much ascription is compatible with meritocracy, would appear to be the existence of multiple 'causal' routes from any given social starting point to a particular destination (e.g. Goldthorpe 2000a). Charles Ragin's development over the past twenty years of QCA, focusing on cases rather than variables and on the problem of uncovering patterns of complex conjunctural causation, has provided us with a new tool for exploring these issues. Up until now Ragin's approach has been used mainly for the analysis of small datasets (though, for one notable exception, see Ragin 2003). However, there is increasing interest in applying a case-based approach to large datasets (Abbott 1992, Ragin 2003,Williams and Dyer, 2004)[3]. A key assumption of the case-based approach is, of course, that the effect of any factor is likely to be dependent on the particular configuration of other factors with which it co-exists in any particular case. Complexity, in this sense (multiple interactions between 'causal' factors in the language of the general linear and associated models) is taken to be typical of processes in the social world. In this sense, the working assumption of causal homogeneity of cases is replaced by one of causal heterogeneity. Ragin has combined this stress on complexity with a focus on establishing pasterns of necessary and sufficient causation[4].
1.3 I begin with a discussion of the assumptions and procedures of the approach. I should also note straightaway that I employ the variables focussed on by Breen and Goldthorpe in their response to Saunders (1995, 1996), notwithstanding the fact that I am doubtful that some of these capture what their labels (e.g. 'effort') suggest. In this paper, I restrict myself to the outcome measure of highest qualification attained by age 33 (one possible step on the way to class destination) and the 'causal' conditions of class origin, sex and 'ability'. Class destination as the outcome will be discussed in a subsequent paper.
Some background
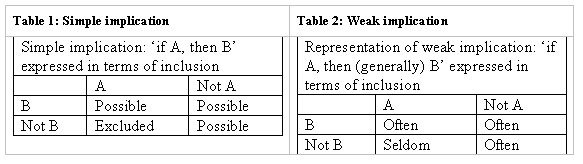
2.1 A fundamental assumption of Ragin's approach is that necessary and sufficient causation should be approached via set theoretic inclusion (Ragin 1987, 2000), and I therefore begin by illustrating what this involves in the crisp set, i.e., non-fuzzy, context. The key move is from a relationship of implication (if A, then B) to one of inclusion (all As are Bs, or the As are a subset of the Bs). Boudon (1974) sets out the results of this move as in Table 1, showing how cases would be distributed across the four combinations of cause and effect, or condition and outcome, in the case of perfect implication. The key column, from the point of view of assessing sufficiency, is that headed A. The cases in 'not A' are not directly relevant in the assessment of whether A is sufficient for B but are, as will be seen below, important for other reasons.
|
2.2 As Boudon notes, such simple logical notions (including those concerning necessary conditions, and jointly necessary and sufficient conditions) are not often usable in social science practice. He therefore moves on to discuss weaker versions of implication. An example is set out in Table 2 (Boudon, 1974, p. 28)[5]. Here we move to the relative frequencies of cases rather than simple absence/presence. Again the A column is the crucial one for assessing sufficiency.
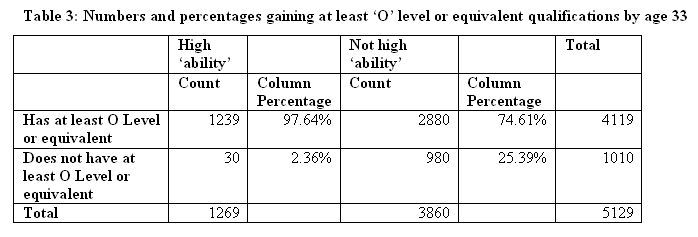
2.3 An illustrative example of less than perfect implication is shown in Table 3, drawn from the 5,129 cases from the NCDS dataset to be discussed later in this paper. Here, examining the equivalent of column A, we can see that, of those individuals with high 'ability' (defined here as approximately the top 20% of the distribution of scores on a test of general 'ability' taken at age 11), almost 98% gain a qualification of at least the given level ('O' level[6] or its vocational equivalent) by age 33. Clearly, being in the set of individuals with high 'ability is nearly always a sufficient condition (but not necessarily a causal one) for the achievement of this level of qualification. However, examining the equivalent of column not-A from Table 2, i.e. those individuals not of high 'ability', we can also see that this level of 'ability' is not a necessary condition since three quarters of these individuals also achieve at least this level of qualification.
|
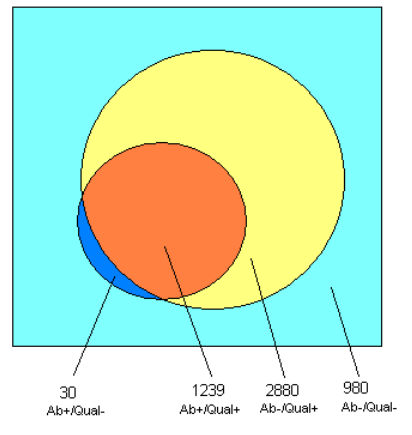
2.4 These data can be represented conveniently in a Venn diagram. In Figure 1 (based on Figure 1 of Ragin, 2003) the data from Table 3 are shown in a form that brings out clearly that the set of high 'ability' individuals is almost, but not quite, a subset of the set of those gaining the given level of qualifications. The darker blue subset (exaggerated here in size) is the small percentage (2.36%) of those with high 'ability' who do not achieve at the given level. The orange subset represents those with high 'ability' who do.
|
| Figure 1. Table 3 shown as Venn diagram. |
2.5 As Ragin (2003) has stressed in his discussion of 'coverage' (see also Goertz 2003) the distribution of cases over the A and not A columns does matter in practice. Condition A might be sufficient, either strictly or weakly, but we might still find most cases of B falling in the not A / B cell if, for example, sufficient causes of B other than A were operating in the context under study. Table 3 and Figure 1 illustrate this very clearly for the example here. The yellow subset represents the 2880 individuals who have the given level of qualification in spite of not being of high measured 'ability' as defined here. We can see that only 1239 of the total of 4119 with the given level of qualification (the 1239 + 2880 in the yellow and orange subsets taken together) have high measured 'ability'. In Ragin's terms, the coverage of the outcome by the condition of having high 'ability' is low, at just 30.08% (i.e. 1239 / 4119)[7].
2.6 These cross tabulations are a form of truth tables, and it is truth tables that form the basis of Ragin's approach. Before moving on to discuss the fuzzy version of QCA and its application to the NCDS data, I illustrate the principles of this approach through a simple application to these data of QCA in its crisp set form.
Crisp sets and truth tables: an example
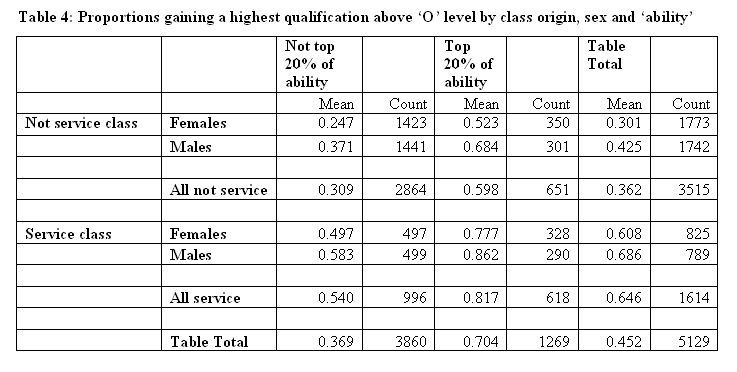
3.1 The sample I discuss comprises the 5,129 individuals from the NCDS for whom complete data exist on the variables social class origin, social class destination, highest qualification at age 33, 'ability' and 'effort'[8]. Father's social class (variable: n2385) has been coded, as near as can be, to the categories of the Goldthorpe scheme employed in Breen and Goldthorpe (1999). Highest qualification is a derived variable with six categories running from 'no qualification' to 'degree or higher'; 'ability' is derived from a general ability test taken at age 11 (n920)[9] scaled 0-80; 'effort' is actually the sum of scores (n1760) on an 'academic motivation scale' at age 16[10]. I am following Breen and Goldthorpe, who were following Saunders, in employing these variables in the absence of better alternatives. The original sample, at age 11, for the NCDS was much larger than 5,000. As is typical with long term longitudinal studies many cases had been lost by the time these individuals were interviewed at age 33, and the proportion of missing data had risen. As Breen and Goldthorpe (1999, p. 8) note, there will be various biases built into the use of this smaller sample. For example, the mean 'ability' scores are higher than those for the 14,134 tested at age 11 (46.05 against 42.94). This is not a purely random sample of the population born in 1958. However, we must often use the best available data while remaining aware of their weaknesses. In this paper, I concern myself with the 'causal' conditions of class origin, sex, and 'ability', and will say nothing about 'effort'.3.2 For my simple example of crisp set analysis, I take the outcome of a highest qualification by age 33 greater than O level or its equivalent and the potentially 'causal' factors (or prior conditions[11], if the reader prefers) of class origin, sex and 'ability'. In the crisp set approach, we must allocate each case either to membership or non-membership of the appropriate set. We are dealing with dichotomies (1 if a member, 0 if not). Before moving to a truth table representation of the analysis, we can explore the pattern of relationships in the more familiar form of a multilevel table. Table 4 shows the proportions gaining this level of qualifications for various combinations of the 'causal' factors. Here class origin is either service class (classes 1 and 2 in the Goldthorpe scheme) or not (see Table 8 for definitions); sex is male or female; 'ability' is divided into approximately the top 20% and the remainder[12].
|
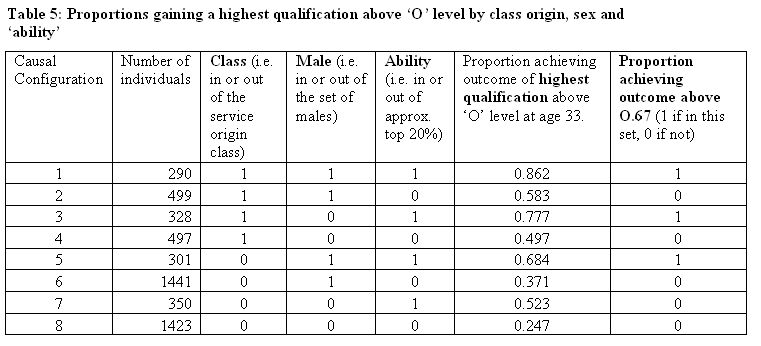
3.3 It is easy to discern the pattern in such a simple table. There are clear 'effects' of 'ability' and class origin. There are also apparent interaction effects. 'Ability', for example, does not produce as great a within-class differentiation within the service class as within the non service class subsets[13], and social class is associated with less differentiation amongst the top ability group than the remainder. An alternative way of examining these patterns is via a truth table analysis employing a set theoretic approach. To do this, we need first to represent the table as a truth table rather than a crosstabulation. This is done in Table 5. Here we should understand the factors in set theoretic terms (see column headings).
|
| Figure 2. Diagrammatic representation of Table 5 |
3.4 Here eight mutually exclusive - and exhaustive - 'causal' configurations (those involving three terms) are numbered 1 to 8, with the number of cases covered by each of them listed in the second column. For each configuration, the proportion achieving a highest qualification greater than O level is shown in the penultimate column. A diagrammatic representation of the proportions in each 'causal' configuration is shown in Figure 2 (where the inner circle in blue and yellow shows those achieving the outcome and those not achieving it are shown falling outside this set in shades of grey for the 8 configurations; area is roughly proportional to numbers here). For example, for service class males of high ability, i.e. those 290 individuals in row 1 of Table 5, we can see that 250 (86%) achieved the outcome and these are therefore shown inside the inner circle (in blue) as a subset of those achieving the outcome. The 40 who did not achieve the outcome are shown outside, in grey. In order to move to the use of a Boolean approach we need to transform the proportions in Table 5 to zeros and ones (in order to be able to examine whether each 'causal' configuration is a subset of the outcome). This has been done in the last column of Table 5 by setting a not very demanding test proportion of 0.67. This might be taken, say, as indicating that membership in a 'causal' configuration reaching this level is 'usually sufficient' for achieving this level of qualification. In diagrammatic terms (Figure 2) this is equivalent to a decision that the three configurations shown in blue and darker grey have a small enough dark grey proportion to pass the test. This diagram also, of course, provides a useful pictorial representation of the 'explanatory' coverage achieved by these three configurations taken together. It can be seen, at this test level of 0.67, to be low, at around a third.
3.5 We can see that three configurations (1, 3, and 5) pass the test[14]. These are, considering just these eight configurations:
- Service class males of high ability
- Service class females of high ability
- Non service class males of high ability (just)
3.6 In this simple case it is easy to see that the first two terms, since they are both subsets of service class individuals of high ability, can be reduced to:
- Service class individuals of high ability
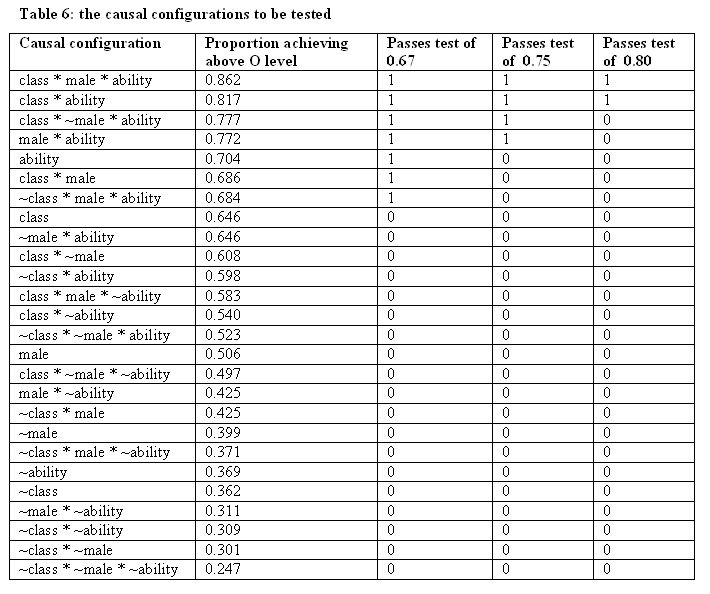
3.7 Indeed, examination of Table 4 shows that this subset had a proportion of 0.817, passing the criterion of 0.67. However, it can also be seen by reference back to Table 4 that the proportion achieving this level of qualification reaches 0.704 for the subset comprising all those of high 'ability' as defined here, but that this subset is not covered by the solution drawn from examining these 8 configurations one by one. Clearly, if we wish to describe these results as simply as possible from the point of view of what they tell us about weak sufficient implication, there are other 'causal' configurations to consider than just the eight set out in Table 5. In fact, the total number is given by 3k-1 (Ragin, 2000, p. 127) where k is the number of attributes, here three. Here there are 26 to consider in all. These are shown in Table 6 where they are set out alongside the relevant proportions achieving the outcome measures, and also the results of applying three different test proportions to this outcome measure. Some of these configurations are now, of course, subsets or supersets of others. They are sorted in Table 6 in descending order of 'sufficiency'.
|
3.8 Here class and ~class indicate, respectively, membership or non-membership of the service class. Similarly male indicates being male; ~male being female, and ability indicates being a member of the set having high ability as defined, ~ability not having such membership. A * indicates set intersection, or logical AND; while + indicates set union, or logical OR. The seven configurations reaching the 0.67 test level are listed below. We now see included the 'ability'[15] row associated with the proportion of 0.704 in Table 4:
- class * male * ability
- class * ability
- class * ~male * ability
- male * ability
- ability
- class * male
- ~class * male * ability
3.9 We can use the Boolean process of logical minimisation to simplify the description of this full truth table (Quine 1952; Ragin 1987, 2000). For example, since the ability row has an associated proportion of 0.704, i.e. it reaches our chosen 0.67 test level for sufficiency, several other rows including ability, and reaching the test proportion, can be covered by this term. Clearly, for example, a member of the set of high ability males is also a member of the set of high ability individuals and so the set 'high ability males' can be covered by that of 'high ability' individuals. More generally, if some set (B) is a subset of an outcome (C), so will any subset (A) of that same set (B) also be a subset of this outcome (C). Altogether, five rows, all combining ability with other factors, are actually subsets of the ability row. If we delete these we obtain:
- ability
- class * male
3.10 This indicates that, at a 0.67 test level, sufficient 'causes' (or conditions) for achieving qualifications at this level are either being high ability or being a male from a service class background (of any ability). In Boolean terms, we would say that the following expression gives us a solution for sufficiency (at our chosen 'usually sufficient' level) here[16]:
ability + class*male
3.11 Now, there is a further problem here. If we look at the proportion of males from service class origins, of not high ability, who achieve this level of qualifications, it is in fact 0.583, i.e. less than the test level of 0.67. Similarly, high ability non-service class females have a proportion of 0.523 in Table 4 but are included in the solution as a subset of ability. This is, at first glance, a disadvantage of the minimisation approach when it is used to assess something like the operation of meritocratic processes. However, it is easy to recover a level of greater level of detail simply by setting a more demanding level for the sufficiency test (for an alternative approach, involving pair-wise comparison of groups differing on just one feature, see Ragin & Bradshaw 1991). If we set the test proportion to 0.75, for example, we obtain:
- class * male * ability
- class * ability
- class * ~male * ability
- male * ability
3.12 Now, here, since ability taken alone does not reach this 0.75 test level, we cannot simply include other terms including ability under one ability row. Here the first three terms can be reduced, using the laws of Boolean algebra, to class*ability and the solution becomes:
class * ability + male * abilityOr, simplifying:
ability * (class + male)
3.13 This solution no longer includes lower ability service class males. Neither does it include high ability non-service class females. This expression therefore brings out the fact that being of high ability is sufficient at the 0.75 level except in the case of non-service class females (a detail lost when 0.67 was used). If we use an even more demanding test level of 0.8, we obtain as our solution terms just:
- class * male * ability
- class * ability
- class * ability
3.14 This brings out the fact that high ability alone is not enough, but must be combined with service class origins to be linked with an 80% probability of achieving this level of success (and also that service class origin alone is not enough at this test level). The pattern here, as we move to increasingly demanding test proportions, is clear. Summarising, we have at the three test levels of 0.67, 0.75 and 0.80, the respective solutions:
- ability + class*male
- ability * (class + male)
- class * ability
3.15 As we set more demanding test proportions we see ability moving from a position of being sufficient on its own to having to be combined with class and male in various ways[17]. This analysis does not show ability to be unimportant but it does show that for the members of a 'causal' configuration to reach the higher levels of sufficiency other factors, usually thought of as ascriptive and non-meritocratic, have also to be present[18]. If we had set 0.85 as our test level we would have obtained[19] just class*male*ability (see Table 6).
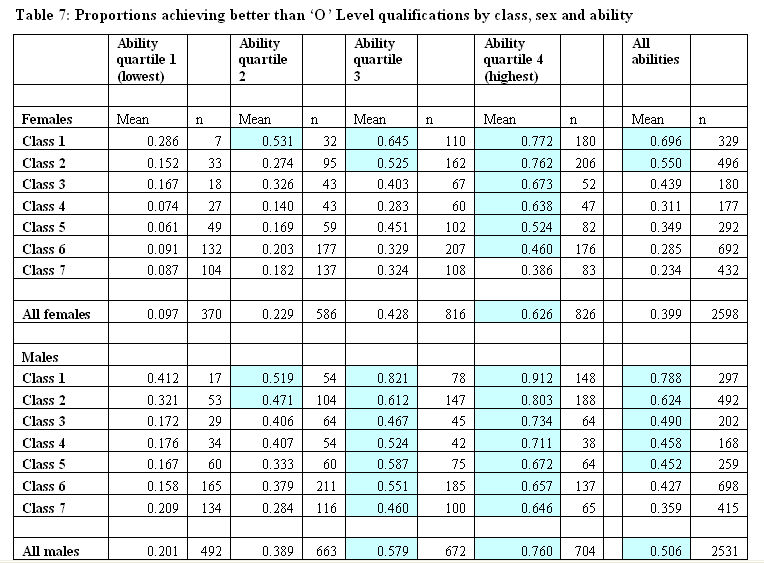
3.16 I have shown how the crisp set Boolean approach is useful in summarising a pattern of links between conditions and outcomes in a large dataset and how, in particular, we can use increasingly demanding test proportions for sufficiency to bring out the 'effects' of more or less ascriptive factors in this case. However, it is clear that to get this off the ground we had to throw out a lot of available information about our cases. There are a variety of means we might use to retain this detail while maintaining this general approach. It is, of course, possible to proceed by employing multilevel tables with more finely defined categories. Indeed, such an approach, coupled with an analysis of odds ratios, is favoured by many (e.g. Savage & Egerton 1997; Breen & Goldthorpe 1999). Even a visual display of data in such tables can be informative. Table 7, for example, shows the breakdown of the proportions achieving better than O level qualifications by class origin (7 categories); ability (4 quartiles) and sex. Here we have 7x4x2 cells in the main body of the table. Some cells (i.e. some 'causal' configurations) have very few cases[20].
3.17 Simply colouring those cells where the proportion is greater than the grand mean for all 5,129 cases (0.452) is informative. A pattern is easily seen. For males and females, the proportions clearly vary by both class of origin and ability. However, while the pattern is similar for males and females, males exceed the overall average of 0.452 in a greater number of cells in the main body of Table 7 (16 of 28 against 9 of 28 for females). In particular, unlike females, all males in ability quartile 3 exceed the overall mean while only females from classes 1 and 2 do.
|
3.18 It would be possible to analyse these data in QCA by employing dummy variables for class and ability, though the results can be difficult to interpret. It is also possible to use a truth table approach as the basis for building up an analysis through pair wise comparisons. For example, we might compare, if our interest was in sex, pairs in the same class and ability categories one by one, noting the overall pattern of results (see Ragin and Bradshaw 1991). This would avoid the problems encountered earlier concerning subsets and supersets. It is also possible to use the TOSMANA software developed by Cronqvist to undertake multi-valued QCA to analyse these data (Cronqvist 2003a, b). An illustration is available in Cooper (2004). Another approach is to use Ragin's fuzzy set extension of crisp set QCA, and it to this I turn now.
Fs/QCA: First approach: the inclusion algorithm
4.1 I now turn to the analysis of these data in fs/QCA, using a fuzzy approach. I should note the tools for undertaking such analyses are still under development, and that that Ragin has moved through three measures for assessing the sufficiency of fuzzy 'causal' configurations since 2000. He has also provided two modes of analysis, adding more recently to the initial 'inclusion algorithm' an algorithm for generating a truth table from fuzzy set data (Ragin 2003, 2004). Given constraints of space, what I do here is illustrate the two approaches (the inclusion algorithm and the fuzzy/truth table approach) and compare their results.4.2 I begin with a fuzzy set analysis of the relations treated earlier. In the set theoretic context, it will be recalled, sufficient causation becomes a subset relationship, i.e. the condition must be a subset of the outcome. In the fuzzy set context, where a case can have partial membership in a set (e.g. 0.7 or 0.33 as well as simply 0 or 1) the subset relation becomes the arithmetic relation of 'less than or equal to' and, for sufficiency, the fuzzy measure of the cause must be less than or equal to the fuzzy measure of the outcome (Ragin 2000). In Fuzzy Set Social Science, Ragin assesses the degree of sufficiency of any 'causal' configuration by simply counting how many of the cases with non-zero membership in the cause meet this criterion and then dividing this sum by this total number of cases with non-zero membership. This is the basis of the inclusion algorithm and embodies his first and simplest test for consistency with a relation of sufficiency of the scores for any 'causal' configuration with their associated outcomes[21]. We are operating with Boudon's weak implication, i.e. probabilistically.
|
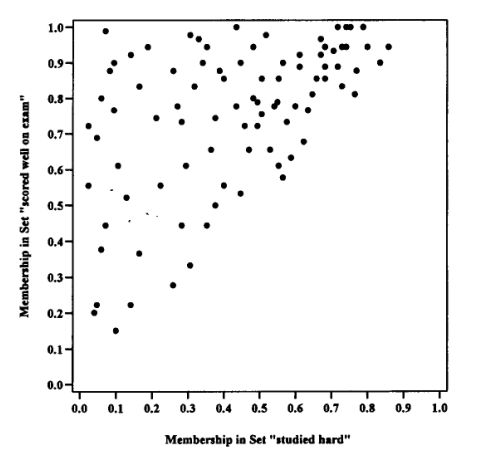
| Figure 3. Plot of 'scored well on exam' against 'studied hard' (fromRagin 2000, p. 236) |
4.3 A graphical illustration, employing imaginary data, might be helpful at this point. Figure 3, reproduced from Fuzzy Set Social Science, plots fuzzy membership in the set 'scored well on exam' against fuzzy membership in the set 'studied hard'. Ragin (2000, p. 235) explains:
For illustration of the subset principle in the fuzzy-set analysis of causal sufficiency, consider two fuzzy sets relevant to students in a course: those who "studied hard" and those who "performed well on the exam." Obviously, studying hard is only one of several ways to do well on an exam. There are likely to be individuals (e.g., geniuses, cheaters, students who successfully bribe the grader) who perform well on exams without studying hard. Assume what all professors assume, namely, that all those who study hard perform well on exams. It follows that membership in the fuzzy set "studied hard" will be a subset of membership in the fuzzy set "performed well on the exam." This general relationship is depicted in [Figure 3]. The upper-triangular plot shows the fuzzy subset relationship, where fuzzy membership in one set (studied hard) is less than or equal to fuzzy membership in another (performed well on the exam). Cases in the upper left-hand corner of the plot are individuals who performed well on the exam without studying hard. From the evidence in the figure, it would be reasonable to argue that "studying hard" is sufficient but not necessary for "performing well on the exam." (Ragin 2000)
4.4 Before being able to undertake such analyses, it is necessary first, of course, to allocate fuzzy set scores to each of the 'causal' factors and also to the outcome. In the case I have chosen to use as my illustration the outcome measure is a fuzzified version of the variable highest qualification achieved at age 33. One of the 'causal' factors, sex, has a crisp form, with being in the set of males scored as 1 and being out of it scored as 0. Both ability and 'class origin' on the other hand are calibrated in a fuzzy manner. As Ragin has stressed this is a key element of the fs/QCA approach. Given that results will depend partially on the calibration it is clearly important to be very explicit about its nature in any particular analysis. There is a difficult trade-off here. QCA was initially developed for small n contexts, those where researchers had detailed knowledge of their cases (e.g. of countries in comparative political analysis). In using it with large n samples, there is an unavoidable reduction of case knowledge. It will be particularly important that researchers report how they have calibrated their fuzzy measures.
Ability
4.5 The ability scores used in the earlier analyses of these data derive from a test given at age 11. My earlier use of scare quotes reflects my doubt that this score is an adequate measure of early academic potential rather than, to some extent, a measure of attainment at this age. In so far as the score reflects attainment, it will not be independent of children's class origins, and this of course makes any assessment of meritocracy even more difficult than it already is (see Savage & Egerton 1997). To calibrate the scores, I have chosen to use one of the schemes set out by Ragin in his discussions of the fuzzy approach (Ragin & Giesel 2002). Because one of my concerns is with the eventual achieving or otherwise of service class positions by the individuals in this dataset, and given that these are not available to all[22], it seems sensible to form a set of 'high ability' individuals by giving a score of 1 (fully in the set) to a proportion at the top end of the ability distribution similar in size to the proportion of class 1 positions available in the destination social class distribution (variable: n540080). Because my sample here is only a subset of the original larger sample, and given that these individuals will have competed within the whole population and not just amongst themselves for destination places, I have made my judgement on the basis of the frequency for the class destination variable in the largest possible sample (10,906 cases with valid data). Just over 18% of these cases with relevant data in the NCDS fall into class 1 on this variable, and I have calibrated ability scores in the top 20% of the distribution as 1[23]. I have set a similar proportion as zero[24].
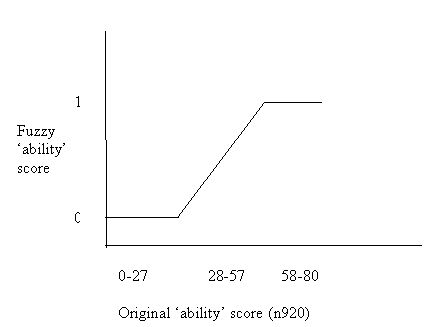
4.6 The original test scores ranged from zero to 80 (with only integer values). I have set all scores above 57 to 1, and all scores below 28 to zero. Scores between 28 and 58 inclusive are given fuzzy scores using the approach set out in fs/QCA manual (Ragin & Giesel 2002, pp. 22-23). The fuzzy scores in this intermediate range are related in a linear fashion to the original scores. The resulting distribution of fuzzy scores by original scores has the general form shown in Figure 4. The key fuzzy membership score of 0.5 (neither in nor out of the set of high ability individuals) is equivalent to an original score of 42.5. Since the median for the 14,134 cases surveyed at age 11 was between 43 and 44, this does not seem an unreasonable crossover point[25].
|
| Figure 4. Fuzzy calibration of ability (n920) |
Class origin
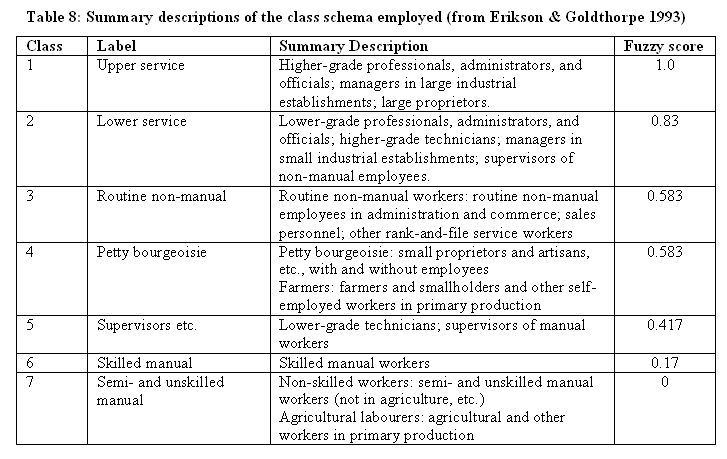
4.7 I constructed my class origin variable in the same way as Breen and Goldthorpe (1999). They point out (p. 9) that the NDCS variable for the individual's father's social class (n2385) can be recoded to produce a fair approximation of the Goldthorpe class schema (see also Heath & McDonald 1987)[26]. The categories of the Goldthorpe schema are shown in Table 8. Full accounts can be found in Erikson & Goldthorpe (1993)[27].
|
4.8 The fuzzy calibration of the Goldthorpe class variable is tricky[28]. Goldthorpe himself has stressed that the categories do not form a simple hierarchy. The two dimensions underlying the categories are occupational function and employment status (Goldthorpe et al., 1987, p. 40). A plumber, for example, according to employment status (self employed, foreman, or rank and file) would be positioned differently in this scheme. Occupations are grouped, using the two criteria, in order to bring together within classes 'occupations whose incumbents will typically share in broadly similar market and work situations' (Lockwood 1958). According to Goldthorpe et al. (1987), the result is:
... we combine occupational categories whose members would appear, in the light of the available evidence, to be typically comparable, on the one hand, in terms of their sources and levels of income and other conditions of employment, in their degree of economic security and in their chances of economic advancement; and, on the other hand, in their location within the systems of authority and control governing the processes of production in which they are engaged. (p. 40).
4.9 I have used his subsequent discussion of the categories (Goldthorpe et al., 1987: 40-43) to decide on the fuzzy mapping in Table 8. Occupations in class 1 are given the score 1 simply because I have taken their characteristics as defining the set class. I have then compared the descriptions of the others with this benchmark. Goldthorpe et al. (1987), for example, describe class 2 thus:
Typically, Class 2 positions guarantee income levels that rank directly below those of Class 1, and also carry 'staff' status and conditions of employment. The occupational roles of class 2 members tend to be located in the middle and lower ranges of bureaucratic hierarchies of one type or another, so that they exercise some degree of authority and discretion in the performance of their work-tasks while at the same time being subject to more or less systematic, if not particularly close, control from above. Class 2 could, in other words, be seen as complementing Class 1 of our schema in representing the subaltern or cadet levels of the service class. (p. 41)
4.10 On the basis of this description, I have given these class positions a score of 0.83 (mostly but not fully in the set, in Ragin's terms). At the other extreme, the score of zero for class 7 indicates that these positions have no features that would qualify for any degree of membership in a set defined as being like class 1.
Highest Qualification
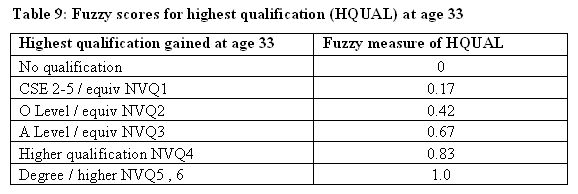
4.11 Fuzzy values for highest qualification by age 33 have been allocated as shown in Table 9, with 1 meaning very highly qualified (i.e. degree or better). Zero seems appropriate for no qualification, and I have assumed that a score of 0.5 (neither in nor out of this set of highly qualified individuals) would fall somewhere between having 'O' and 'A' levels. Clearly, there is scope for argument about this mapping.
|
Determining membership scores in 'causal' configurations[29]
4.12 Even with just the three 'causal' set theoretic factors of class, male and ability there are a considerable number of 'causal' configurations to assess for sufficiency. The number, as stated earlier, is given by 3k-1, where k is the number of attributes, here 3 (class, male, ability). In this case, we again have the 26 'causal' configurations in Table 6 to test. As previously explained, a star (*) here indicates the logical AND (set intersection). The symbol ~ indicates logical NOT, and is derived by subtracting the fuzzy score from 1. For example, if an individual has fuzzy score 0.83 in the set class, s/he will have 1 minus 0.83 in ~class (see Ragin 2000, p. 172). To determine the membership score of any case for one of these 'causal' configurations it is necessary to use the fuzzy set version of set intersection. This involves taking the minimum of the values for the factors being combined by logical AND[30]. If, for example, an individual has fuzzy scores in class, male, and ability respectively of 0.83, 1 and 0.52, then his score on the configuration class * male* ability will be the minimum of (0.83, 1, 0.52) or 0.52. On the other hand, this individual's score in class * male * ~ability will be the minimum of (0.83, 1, 0.48[31]) or 0.48[32]. If this individual's score on a fuzzy outcome measure were, say, 0.5 then we can see that the second 'causal' configuration would pass the test for sufficiency set out in Fuzzy Set Social Science but that the first would not. Had the outcome score been 0.6 (or, for that matter, 1) then both would have passed, reminding us that there might be many sufficient paths to an outcome.
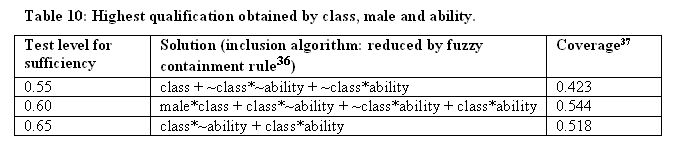
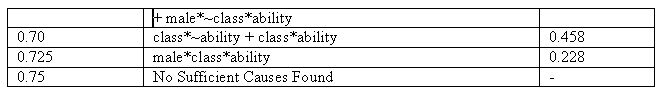
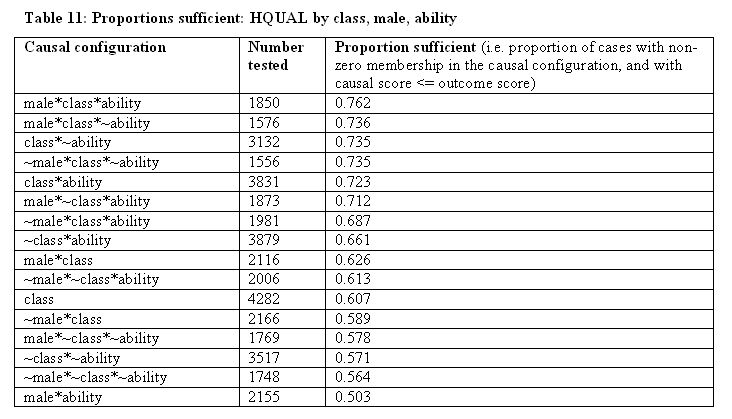
4.13 What the 'inclusion algorithm' in fs/QCA does is run through tests for all the possible 'causal' combinations, employing a user-controlled criterion to assess the sufficiency of each 'causal' combination. In doing this it only takes account of cases with non-zero membership in the 'causal combination'. It might find, for example, that 70% of such relevant cases passed the 'cause less than or equal to outcome' sufficiency test for some particular 'causal' combination. This percentage, expressed as a proportion, appears associated with the relevant 'causal' configuration (as in column 3 of Table 11). The software also, however, undertakes the task of reducing the solution, using the containment rule (Ragin 2000), to a simplest form[33]. Given what we observed earlier in the crisp set context, I have carried out a range of analyses, using a steadily increasing test level, of highest qualification by the factors class, male and ability[34]. Table 10 gives the solutions provided by version 1.3 of the fs/QCA software, using the fuzzy inclusion algorithm. The underlying results of the tests, from which these solutions are derived, are shown in Table 11, just for those configurations with proportions sufficient greater than the 0.5 test level. It should be noted that the fs/QCA software also applies a statistical test before allowing any configuration to pass into the solution[35]. Examination of Tables 9 and 10 together, for example, shows that the proportion of 0.762 for male*class*ability did not meet the statistical criterion when we set the test level at 0.75, since the finding was 'no sufficient causes found'. It does however pass at 0.725 (a result I have inserted to facilitate later comparison with the results in Table 15).
|
|
4.14 An examination of these results shows a similar pattern to that seen earlier when we used a crisp approach to analyse the outcome of qualifications better than O level. As we move from less to more demanding test proportions, the ascriptive factors of social class and sex come increasingly to the fore. The highest proportion of 0.762 appears for male*class*ability. It is instructive to compare this with three other configurations, in each case having one of the three sets negated:
- male*class*~ability 0.736
- male*~class*ability 0.712
- ~male*class*ability 0.687
4.15 Moving, for example, from male*~class*ability to male*class*ability we find the proportion changing from 0.712 to 0.762. This is an indication of the additional advantage of membership in the fuzzy set class as opposed to membership in the set ~class within the 'causal' configuration male*ability.
4.16 It is also noteworthy, from the perspective of assessing 'meritocracy', that ~class*ability appears up to and including the 0.60 level, but then only combined with male at the 0.65 level. On the other hand class*~ability, but not ~class*ability, continues to appear up to and including the level of 0.70. Whatever the underlying processes are here (and we have not taken account here of effort, for example) they seem to favour class over ability, and males over females.
4.17 There is, however the trade-off between test proportion and 'coverage' (see Table 10, andRagin 2003) to consider alongside these points. Setting low test proportions tends to increases the coverage of the solution. In Table 10, the highest coverage is found for a test proportion of 0.60, and the solution is:
male*class + class*~ability + ~class*ability + class*abilityAn argument might be developed that this is the best solution to take in the context of assessing the nature of processes in the sample as a whole. Here ability is sufficient with both ~class (3rd term) and class (4th term). However, so is class in the context of ~ability (2nd term), and male (1st term).
Second approach - fuzzy to truth table
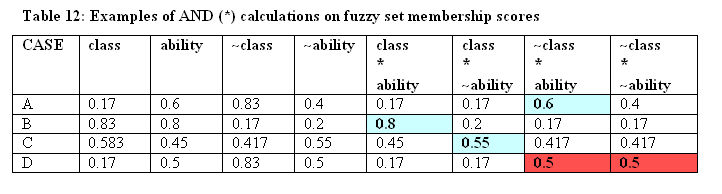
5.1 Ragin has noted that the inclusion algorithm, while allowing researchers to use finer measures than crisp zeros and ones, does not produce a truth table of the sort associated with crisp set analyses. A key problem is that, in the context of fuzzy sets, any individual case can have non-zero membership in more than one configuration (see, e.g., the 'number tested' column in Table 11 which clearly sums to more than 5,129). However, there is a means of locating an individual in just one configuration amongst, for example, the eight we saw in Table 5. Consider a study where we have just two 'causal' conditions, say class and ability. Consider individuals with the following scores on the two fuzzy measures. Person A scores (0.17, 0.6). Person B scores (0.83, 0.8). Person C scores (0.583, 0.45). It can be seen in Table 12 that each of these three cases has a membership of greater than 0.5 (more in than out) in just one of the four 'causal' configurations in the last four columns (shown in blue). This is not, however, the case for D (0.17, 0.5), which has two 0.5s (shown in red). Ragin (2003) used this feature of fuzzy 'causal' configurations to develop one method of deriving a truth table from a fuzzy dataset. He allocated cases to the 'causal' configuration in which they had a greater than 0.5 membership, and this then allowed a Boolean crisp set analysis to be undertaken of the resulting 'causal' patterns.
|
5.2 More recently Ragin (2004) has been developing an alternative approach. This involves taking account of the weight of membership in each 'causal' configuration (rather than the number of cases with membership greater than 0.5) in constructing a truth table from the fuzzy analyses. The most recent version of the software (fs/QCA version 1.3) uses this approach (as well as providing the inclusion algorithm used earlier). A further complication is that this truth table algorithm also employs a different test for sufficiency than the inclusion algorithm. This is the third version of the sufficiency test. In the first, already explained, the test comprises the proportion of cases with non-zero membership in the 'causal' configuration which meet the fuzzy subset/inclusion condition (i.e. fuzzy score on the cause must be less than or equal to the fuzzy score on the outcome). In his paper analysing data on poverty, Ragin (2003) proposed a change in this test, to one that took account of the size of fuzzy 'causal' scores. This test sums all the membership scores in a 'causal' condition, and uses this as the denominator, while, for the numerator, it employs the sum of the consistent membership scores (consistent, i.e., according to the sufficiency test used in the inclusion algorithm). Justification for this move is given in his 2003 paper (pp. 2-3). The newest test employs a function which effectively takes account of near misses, giving credit for these, and also introduces penalties for membership scores that exceed their corresponding outcome membership score by a large margin (Ragin 2004). In the dataset I am analysing (and apparently in some other large n contexts) these three tests actually produce very similar (i.e. highly correlated) results. It also happens to be the case that the two methods for producing a truth table from fuzzy data produce very similar results for my data.
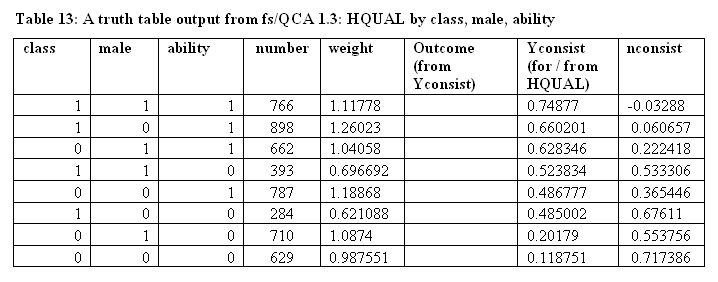
5.3 I shall now present the results of an analysis, using this new fuzzy approach, of highest qualification (HQUAL) by sex (male), social class (class) and ability (ability). The truth table produced is Table 13. All of the eight 'causal' configurations are well represented, whether the number of cases with greater than 0.5 membership in each corner of the vector space (Ragin 2003) or 'causal' weight (as explained in Ragin 2004) is taken as the indicator[38]. 'Yconsist' is the new consistency measure. 'Nconsist'[39] is this measure applied to the negation of the outcome.
|
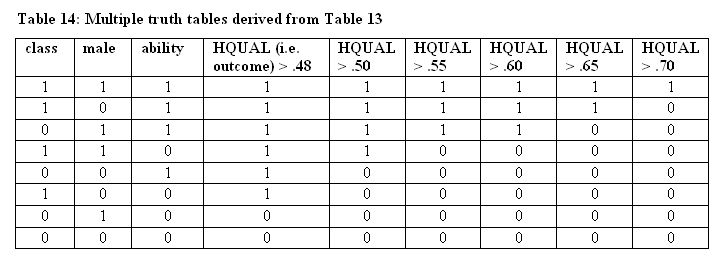
5.4 If we now set various cut points for yconsist we can populate the currently blank column with ones and zeros, and then we can submit these results to a crisp Boolean analysis. These new consistency scores tend to be lower than those derived from the simple inclusion algorithm, and so we can start with a very undemanding 0.48, simply because there is a clear jump in the numbers here. The truth tables, using different cut points, are collected in Table 14.
|
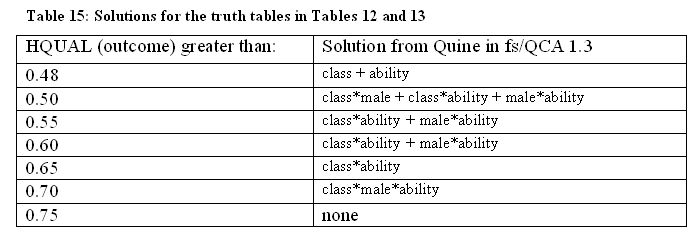
5.5 Table 15 collects together the results from using the Quine algorithm in fs/QCA 1.3 to analyse these truth tables as we run through increasingly demanding test proportions. If our concern is with just sufficiency per se, we probably should not be considering the first solution (see Ragin 2004). However, we have to set the test proportion as low as this in order to see ability on its own appearing as part of the solution. Interestingly, class also appears alone at this low test proportion. As we move down the rows we see the same general pattern as we did earlier. Focusing on the supposedly meritocratic factor of ability in particular, we see that ability loses the capacity to be 'sufficient'[40] on its own for this educational achievement outcome even at the 0.5 test level. Eventually class, and then class*male, have also to be present. The final result, at a test proportion of 0.70, is the same as that for the inclusion algorithm with a test proportion of 0.725 (Table 10). The overall pattern of results is very similar to that derived from the earlier dichotomy-based analysis of Table 4.
Conclusion
6.1 Rather than rehearsing the substantive findings here, I shall just pull together some important methodological lessons. My concern has been to explore (and illustrate) the use of fs/QCA in the analysis of a large n dataset in the context of my final goal of being able to say something substantive about the fit between patterns uncovered and supposedly meritocratic social processes. In this paper I have concentrated on qualifications achieved but my eventual goal is to analyse class destination (at age 33) by class origin, sex, ability, and either one or both of effort/qualifications. At that point it will, of course, be possible to undertake a systematic comparison with the results previously obtained by the researchers listed in the introduction who have employed other approaches.6.2 First, of course, it is worth noting that the solution obtained, in both the crisp set and fuzzy contexts will depend on the test proportion set for sufficiency. This is not a peculiar characteristic of the QCA approach but the approach does make this step very transparent. Furthermore, it is easy to run a series of tests with increasingly demanding test proportions. The pattern of results is itself informative, demonstrating here the ways in which ability, taken alone, becomes increasingly less sufficient as more demanding test proportions are set (or, to put it differently, as we concern ourselves, from a policy perspective, with higher proportions achieving any given outcome)[41].
6.3 Second, concentrating on the non-crisp methods, i.e. the fuzzy inclusion algorithm and the fuzzy ? truth table method now embodied in version 1.3 of the fs/QCA software, we can note that Tables 9 and 14 tell a similar, though not identical, story as we increase the test proportion for sufficiency. In each case, we finally arrive at some combination involving higher class origin, maleness and higher ability as jointly sufficient for achieving higher qualifications.
6.4 Third, it is obviously the case that results from fuzzy analyses will vary with the particular calibrations chosen for such factors as class. This feature of the approach is likely to attract criticism (see Verkuilen 2001 for one response to this problem). Two points are worth noting. We must clearly make any fuzzy calibrations explicit, providing the best possible theoretical justification[42]. In addition, it seems worthwhile, at this stage, undertaking some experiments with varying calibrations (in 'reasonable' ranges) in order to understand better just how important this issue is in practice.
6.5 With respect to the substantive issue of whether class and sex on the one hand or ability[43] on the other are more important in 'explaining' qualifications achieved, the range of analyses undertaken all point to the operation of non-meritocratic factors in this sample. Both class and sex have appeared as important mediators of the 'effects' of ability. Furthermore, and with the increasing interest in case-based analysis of large datasets in mind, it is worth noting that these analyses allow us to see clearly which subsets of cases we should explore in our continuing attempts to understand causally these patterns.
6.6 Finally, I offer a few comments on the relation of the set theoretic approach to the methods previously employed in this area of research. I should emphasize that, in employing Ragin's methods to analyse NCDS data, I do not wish to be seen as arguing that these are better for all purposes than previous approaches. QCA, in both its crisp and fuzzy forms, approaches the data from the perspective of cases, their features and tendencies rather than focussing primarily on the correlations between variables (Ragin & Zaret, 1983). In practice, of course, in analysing large datasets the researcher is likely to construct his or her cases by locating individuals with shared values on a subset of variables. Here, for example, sets of cases for analysis have been constructed by collecting together individuals with particular conjunctions of values for sex, ability and social class. In the crisp set context this clearly leads to a form of analysis which has much in common with the analysis of cross-tabulations (and hence log-linear analysis). However, the focus remains on the careers of kinds of cases rather than on fitting a model to a complete table.
6.7 Because of this focus on the case, alongside the use of the language of necessary and sufficient conditions in the analysis of conjunctural causality, it does seem likely that this approach may sometimes illuminate particular features of data - and the social world from which they are drawn - more transparently than other approaches. In particular, because it begins with the assumption that causation is complex and conjunctural, it seems likely that the approach will be well suited to analysing outcomes that result from multiple causal paths. In the long tradition of linear multivariate analysis this issue has been approached via the introduction of interaction terms (and similarly in the more recent log-linear approaches). These approaches have many strengths[44] but have also been criticised from a variety of directions. Ragin has, of course, pointed to a variety of problems, for example those concerning the consequences of limited social diversity (Ragin, 2000). Other criticism has come from a variety of directions. Freedman (1987, 1997) has criticised extensively Blau and Duncan's classic regression-based work on occupational attainment, concentrating on the extent to which it succeeds in uncovering causes. Kelley (1990) has attacked Goldthorpe's use of log-linear methods in lieu of regression-based approaches, but see also Goldthorpe's (1990) reply. Lieberson (1985) has written a fascinating book on the problems of causal inference from surveys[45]. My own view is that our understanding of the complex patterns of causation that produce outcomes such as educational achievement will continue to benefit from the use of a wide range of methods, and that we can only benefit by exploring the potential of Ragin's case-based approach for analysing large datasets.
Notes
1 I'd like to thank Charles Ragin for providing some helpful SPSS routines and for being so willing to answer my questions concerning aspects of fs/QCA. I have also benefited from ongoing conversations about fs/QCA with my colleague Richard Gott. Thanks also to Paul Winstanley for his help in discovering just what is where in this complex dataset (supplied by the UK Data Archive). Any errors are of course mine.2 I also intend to undertake a comparison with the patterns of apparent causation in the subsequent longitudinal study of children born in 1970.
3 There is also an associated interest in providing an account of the patterns found in previous analyses of large datasets in terms of underlying social processes and mechanisms (Goldthorpe 2000;Hedström & Swedberg 1998;Mahoney 2001). I will not address 'mechanisms' in this paper, but would note that any such account should be compatible with the patterns uncovered by QCA.
4 He also focuses on the consequences of 'limited diversity' for causal inference.
5 I have corrected an apparent error in the original. Well known problems arise when relations of this sort are chained. While strict implication is transitive at the level of the individual, weak implication is not. The two occurrences of 'often' under the NOT-A column of Table 2 might be replaced by 'possible'.
6 The O level examination had replaced the School Certificate at the beginning of the 1950s. It was taken by about a quarter of the relevant age group. Taken at age 16, it played a key selective role in allowing further academic study after this age.
7 These results clearly depend on the cut-off point chosen for high 'ability'. My purpose here is purely to illustrate the concepts of sufficiency, necessity and coverage in a realistic context.
8 Military personnel have been excluded. I have attempted to match the sample employed in Breen and Goldthorpe (1999). Some discrepancies remain. As those authors note (p. 8), these data are not in all respects well-documented and we can expect such differences as a result.
9 I agree with Breen and Goldthorpe (1999, footnote 10) that this test cannot be regarded as measuring primarily 'innate' cognitive ability. See also the useful discussion of the test in Savage & Egerton (1997), and also Douglas (1964).
10 The latter is hardly a perfect indicator of the concept referred to in Young's account of a meritocracy. The fact that this indicator of 'effort' was measured at age 16 makes it likely that it reflected previous attainment in school as much as it captured something prior that partially caused this attainment. However, the measure might become more relevant when class destination, rather than 'highest qualifications achieved', is treated as the outcome measure.
11 I do not want to endlessly repeat the point, but it is of course the case, as with correlations and causes, that the patterns I shall discuss in this paper do not establish causation. Rather, they provide evidence relevant to causal analysis in terms of social processes and mechanisms.
1220% is chosen in relation to the distribution of available class destinations.
13 Clearly, if we were analysing these data with some form of regression analysis, we would want to consider whether this apparent interaction effect was real or due to differences within the groups in the details of 'not top 20%' 'ability' scores, but my purpose here is to illustrate an alternative approach. Later in the paper I will return to this level of detail via the fuzzy set approach.
14 I am at this stage ignoring statistical considerations (sampling error, etc.).
15 It should be noted that, simply to make this typographically simpler, I shall now drop the scare quotes around 'ability'. Though I will not use them from this point, my concerns about the measure remain.
16 I should note that the fs/QCA software also adds a statistical test, and that in this case it throws out the two terms class * male, ~class * male * 'ability', on the grounds that the proportions for these are not far enough away from 0.67 to pass the binomial tests (with alpha set at 0.05) embedded in the software. Setting alpha to a higher level, e.g. 0.25, allows the recovery of the solution discussed here. Later analyses in this paper will include the use of the statistical test but my purpose at this point is to illustrate the underlying Boolean principle.
17 A similar story could be told for class*male.
18 Whether ability should be thought of as ascriptive factor or not is clearly an interesting issue. Presumably those believing it to be determined mainly genetically might be expected to think it was? For one useful discussion of some relevant issues, see Swift (2004).
19 Again, subject to any statistical tests preventing this configuration passing the test proportion.
20 See Ragin (2000) for a discussion of the implications of this 'limited diversity' for social analysis.
21 The containment rule is used to simplify solution expressions. See Ragin (2000).
22 Neither of course were places in elite educational institutions delivering higher levels of qualification.
23 Again I have used the largest sample possible of ability' scores (n920) to do this.
24 Some readers will note the throwing out of detail here at each end of the distribution. In the set theoretic context, this is regarded as an appropriate move (Ragin 2004). More particularly here, it embodies the claim that the individuals scored as 1 would have been (nearly) all able enough for their ability to have gained them high class positions via any selection process focussing solely on this attribute.
25 The mean, incidentally, was 42.94.
26 I have omitted military personnel from my dataset (in respect of both origin and destination class).
27 See also Goldthorpe (2000b).
28 At this stage of the employment of fs/QCA in large n contexts, it may be worth running analyses with different calibrations to see just how dependent findings are on any particular calibration within a justifiable range.
29 For a fuller account of operations on fuzzy sets, see Ragin (2000), pp. 171-180.
30 The fuzzy procedure for logical OR involves taking the maximum of a range of values. This will become important later.
311 minus 0.52, i.e. negation, gives the 0.48
32 Using this notation, Table 12, later in the paper, gives a simple example of some of the operations discussed above.
33 The software now uses a different notation for indicating set membership. Upper and lower case letters (CLASS, and class, e.g. are used respectively to indicate membership and non-membership in a set such as class. I have decided to use just one notation throughout this paper, that of class and ~class in this case.)
34 I should note, for readers more familiar with this approach, that there were no simplifying assumptions to worry about here, neither were any necessary causes (0.80, 0.05) found.
35 I have set the alpha at 0.05 for this work. The underlying test is a binomial test of the difference between the test proportion set and that observed (see Ragin 2000, pp. 109-115 and pp. 249-252).
36 It is very important to be aware of some key differences between Boolean and fuzzy algebra. See Ragin (2000), p. 241, and especially footnote 3.
37 Coverage, as explained earlier for the crisp set context, is a proportional measure of the extent to which the solution 'explains' the outcome (Ragin 2003). In the fuzzy context, for any 'causal' condition, it is defined as the sum, across cases, of the consistent 'causal' membership scores divided by the sum of the outcome membership scores (Ragin 2003, p. 6). It plays a role analogous to variance explained.
38 The correlation between the two here is 0.996. Also, the measures of consistency are highly correlated. The first (FSSS 2000) measure with the second (2003) 0.97; the first with the most recent (2004) 0.811; and the second with the most recent 0.927.
39'... a measure of the degree to which each causal combination is a subset of the negation of the outcome (1 - each outcome scores)' (Ragin 2004).
40 Sufficiency may seem an odd word to use here. What matters is the test proportion. In one sense, a proportion of, e.g., 0.51 might be taken to mean 'sufficient, more often than not'. See Ragin (2000) for more on this.
41 In using QCA to assess something like meritocracy, where a chosen outcome measure might be rare - perhaps with some features of a positional good - there would seem to be a case for sometimes undertaking analyses with a much lower test proportion than would be appropriate in the context of a purely causal analysis of outcomes. There is an associated trade-off with 'coverage' to consider and this requires further thought than I have been able to give it here (Goertz 2003).
42 In this work, this has been easier to do for class than for qualifications, for example.
43 I'm ignoring here the issue of the extent to which these ability scores are measures of innate capacity rather than of (socially and culturally influenced) achievement. To the degree that the ability scores, as seems very likely, do have an achievement component then any results pointing to non-meritocratic processes are likely to be an underestimate of the real importance of these processes. As I noted earlier, it is also the case that if ability is seen as given at birth then it would appear to become something similar to class origin and sex in as far as it is beyond the individual's power to vary it.
44 They certainly benefit from the much longer tradition of work on statistical significance and methods of choosing between competing 'causal' models (Goldthorpe, 2000). I should add, however, that not all work undertaken by the advocates of these approaches benefits from samples and data that meet the requirements of the mathematical models employed.
45 Lieberson (1991) has also, of course, raised some worries about causal inference in small n studies. Notwithstanding the merits of his arguments, it is worth noting that QCA, in the small n context, represents a welcome attempt to introduce some rigour into the analysis of causation in the qualitative research tradition. Goldthorpe (2000, pp. 50-52) has also raised some concerns about QCA. One of these - concerning the loss of information associated with the use of categorical data - is addressed by the fuzzy version.
References
ABBOTT, A. (1992) 'What do cases do? Some notes on activity in sociological analysis', in Ragin, C.C. & Becker, H.S. (Editors) What is a Case? Cambridge: Cambridge University Press.Blau, P.M. & Duncan, O.D., with Tyree, A. (1967) The American Occupational Structure. New York: Wiley.
BOND, R. & Saunders, P. (1999) 'Routes of success: influences on the occupational attainment of young British males', British Journal of Sociology, Vol. 50, 2, pp. 217-249.
BOUDON, R. (1974) The Logic of Sociological Explanation. Harmondsworth: Penguin.
BREEN, R. & Goldthorpe, J.H. (1999) 'Class inequality and meritocracy: a critique of Saunders and an alternative analysis', British Journal of Sociology, Vol. 50, 1, pp. 1-27.
BREEN, R. & Goldthorpe, J.H. (2001) 'Class, mobility and merit: the experience of two British birth cohorts' European Sociological Review, Vol. 17, 2, pp. 81-101.
BREEN, R. & Goldthorpe, J.H. (2002) 'Merit, mobility and method: another reply to Saunders', British Journal of Sociology, Vol. 53, 4, pp. 575-582.
COOPER, B. (2004) 'Using crisp and fuzzy set QCA to explore the "meritocracy in Britain" debate: some initial analyses', paper given at The Tensions in Social Statistics conference, Durham, Sept. 2004 (available from author).
CRONQVIST, L. (2003a) 'Presentation of TOSMANA: Adding Multi-Value Variables and Visual Aids to QCA', Paper prepared for presentation at the COMPASSS Launching Conference 16-17 Sept. 2003 (at < http://www.compasss.org/Cronqvist.PDF> newer version at http://www.compasss.org/Cronqvist2004.PDF).
CRONQVIST, L. (2003b) 'Using Multi-Value Logic Synthesis in Social Science', Paper prepared for the Second General Conference of the European Consortium for Political Research (ECPR), Marburg, Sept. 2003.
DOUGLAS, J.W.B. (1964) The Home and the School, London: Panther.
ERIKSON, R. & Goldthorpe J.H. (1993) The Constant Flux: a study of class mobility in industrial societies. Oxford: Clarendon Press.
FREEDMAN, D.A. (1987) 'As others see us: a case study in path analysis', Journal of Educational Statistics, Vol. 12, 2, pp. 101-128.
Freedman, D.A. (1997) 'From association to causation via regression', in McKim, V.R. & Turner, S.P. (Editors) Causality in Crisis? Statistical Methods and the Search for Causal knowledge in the Social Sciences Notre Dame, Indiana: University of Notre Dame Press.
GOERTZ, G. (2003) 'Assessing the importance of necessary or sufficient conditions in fuzzy-set social science', < http://www.compasss.org/goertz2003.pdf >.
GOLDTHORPE, J.H. (1990) 'A response', in Clark, C., Modgil, C. & Modgil, S. (Editors) John H. Goldthorpe: Consensus and Controversy, London: The Falmer Press.
GOLDTHORPE, J.H. (2000) On Sociology: Numbers, narratives and the integration of research and theory. Oxford: Oxford University Press.
GOLDTHORPE, J.H. (2000a) 'Outline of a theory of social mobility', in his On Sociology Oxford; Oxford University Press.
GOLDTHORPE, J.H. (2000b) 'Social class and the differentiation of employment contracts', in his On Sociology. Oxford: Oxford University Press.
GOLDTHORPE, J.H., with Llewellyn, C & Payne, C. (1987) Social Mobility and Class Structure in Modern Britain. Oxford: Clarendon Press.
HEATH, A. & McDonald, S-K. (1987) 'Social change and the future of the left', Political Quarterly, Vol. 53, pp. 364-377.
HEDSTRÖM, P. & Swedberg, R. (1998) (Editors) Social Mechanisms: an analytical approach to social theory. Cambridge: Cambridge University Press.
KELLEY, J. (1990) 'The failure of a paradigm: log-linear models of social mobility', in Clark, C., Modgil, C. & Modgil, S. (Editors) John H. Goldthorpe: Consensus and Controversy, London: The Falmer Press.
LAMPARD, R. (1996) 'Might Britain be a meritocracy? A comment on Saunders' Sociology, Vol. 30, 2, pp. 387-393.
LIEBERSON, S. (1991) 'Small N's and big conclusions: an examination of the reasoning in comparative studies based on a small number of cases', Social Forces, Vol. 70, 2, pp. 307-320.
LIEBERSON, S. (1985) Making it Count: the improvement of Social Research and Theory, Berkeley: University of California Press.
LOCKWOOD, D. (1958) The Blackcoated Worker. London: Allen & Unwin.
MAHONEY, J. (2001) 'Beyond Correlational Analysis: Recent Innovations in Theory and Method', Sociological Forum, Vol. 16, 3, 575-593.
MARSHALL, G. & Swift, A. (1993) 'Social class and social justice', British Journal of Sociology, Vol. 44, 2, pp. 187-211.
MARSHALL, G. & Swift, A. (1996) 'Merit and mobility: a reply to Peter Saunders', Sociology, Vol. 30, 2, pp. 375-386.
QUINE, W.V. (1952) 'The problem of simplifying truth functions', American Mathematical Monthly, Vol. 59, 8, pp. 521-531.
RAGIN, C.C. (1987) The Comparative Method. Berkeley & Los Angeles: California University Press.
RAGIN, C.C. (2000) Fuzzy Set Social Science. Chicago: Chicago University Press.
RAGIN, C.C. (2003) 'Recent advances in fuzzy-set methods and their application to policy questions', http://www.compasss.org/Ragin2003.PDF>.
RAGIN, C.C. (2004) 'From fuzzy sets to crisp truth tables', <http://www.compasss.org/RaginDec_2004.pdf>.
RAGIN, C.C. & Bradshaw, Y.W. (1991) 'Statistical analysis of employment discrimination: a review and critique', Research in Social Stratification and Mobility, Vol. 10, pp. 199-228.
RAGIN, C.C. & Giesel, H.M. (2002) USER'S GUIDE: Fuzzy-Set / Qualitative Comparative Analysis < http://www.u.arizona.edu/~cragin/software.htm>.
RAGIN, C.C. & Zaret, D. (1983) 'Theory and method in comparative research: two strategies', Social Forces, Vol. 61, 3, pp. 731-754.
SAUNDERS, P. (1995) 'Might Britain be a meritocracy?' Sociology, Vol. 29, 1, pp. 23-41.
SAUNDERS, P. (1996) Unequal but fair? A study of class barriers in Britain. London: Institute of Economic Affairs.
SAUNDERS, P. (1997) 'Social mobility in Britain: an empirical evaluation of two competing explanations' Sociology, Vol. 31, 2, pp. 261-288.
SAUNDERS, P. (2002) 'Reflections on the meritocracy debate in Britain: a response to Richard Breen and John Goldthorpe', British Journal of Sociology, Vol. 53, 4, pp. 559-574.
SAVAGE, M. & Egerton, M. (1997) 'Social mobility, individual ability and the inheritance of class inequality', Sociology, Vol. 31, 4, pp. 645-672.
SWIFT, A. (2004) 'Would perfect mobility be perfect?', European Sociological Review, Vol. 20, 1, pp. 1-11.
VERKUILEN, J. (2001) 'Measuring Fuzzy Set Membership Functions: A Dual Scaling Approach', Prepared for Presentation at the Annual Meeting of the APSA, San Francisco, CA, August 30-September 2, 2001.
WILLIAMS, M. & Dyer, W. (2004) 'Realism and probability' in Carter, B. & New, C. (Editors) Making Realism Work: Realist Social Theory and Empirical Research London & New York: Routledge.
YOUNG, M. (1958) The Rise of the Meritocracy. Harmondsworth: Penguin