A Comparative Analysis of Inequality in Health Across Europe
by Sara Della Bella, Simone Sarti, Mario Lucchini and Mara Tognetti Bordogna
University of Trento
Sociological Research Online, 16 (4) 7
<http://www.socresonline.org.uk/16/4/7.html>
10.5153/sro.2492
Received: 10 May 2011 Accepted: 10 Oct 2011 Published: 30 Nov 2011
Abstract
The study of inequality in health concerns the relationship between socially structured characteristics and health outcomes. Howewer, health disparities are also linked to purely individual characteristics and contextual ones. In particular, the contextual effect at a national level may reflect differences in the functioning and performing of national health institutions, that may be conceived as further determinants of health inequalities. In this work we aim at estimating the effect of education on self-assessed health across European countries, taking into account potential confounders like age, gender and family social background. Using a multilevel model with individuals nested in countries, we can achieve two aims. First, we can see whether countries differ in their average self-assessed health score. Second, we can test our hypothesis about the existence of a European social gradient, that is that education exerts a relatively constant effect on self-assessed health. We develop our models using data from European Social Surveys (88,842 interviews).
Keywords: Health Inequalities, Health Policies, Public Health Care Systems, Comparative Studies
1.Health inequalities: current theory and previous research
1.1 The subject of social inequality in health is of vital relevance in sociology since it is one of the most serious and unjust forms of inequality - health being a necessary pre-condition to full enjoyment of one's life. Article 25, paragraph 1 of the UN Universal Declaration of Human Rights (UNO, 1948) defines health as a fundamental right. Nevertheless, social inequalities in health persist to this day, including in the so-called "developed countries", in many other ways rich and democratic (Wilkinson and Marmot 2003). Despite the fact that social reforms, advances in medical care and a general improvement in overall health have led to a significant improvement in quality of life for most people, as well as increased life expectancy, within these countries there is a sort of "sociological inertia, which has maintained practically unchanged all of the major social differences in healthcare, and in behaviour which is either risk-prone or health protective" (Costa et al. 1994, 28-29). All countries which gather data on the issue report stable social differences in mortality, morbidity and the principal risk factors for health, regardless of how social classes are defined (Costa et al. 1994; Costa and Spadea 2004; Marmot 2006). It is important to stress that such inequalities concern all citizens, in one way or another, as "the correlation between health and wealth is regular, so that at every level of social class measured, those in a more advantageous social position always have a better health profile than those in a more disadvantageous position" (Costa and Spadea 2004, p. 4).1.2 Many studies have been carried out in different countries and in different population groups, measuring the level of health (using subjective and objective indicators) and the social gradient in health, using sociological variables presumed to be significant factors - income, education, occupation and social status (including amongst others: Cavelaars et al. 1998; Kaplan et al. 1996; Lucchini and Sarti 2009; Mackenbach et al. 2003; Muller 2002; Wilkinson 1992). However, the reasons behind this gradient in health standards still remain far from clear. Since the publication of the Black Report in 1980 (which sparked a lively debate on social inequalities in health throughout Europe), many possible explanations have been put forward to account for the phenomenon. The most frequently discussed theories in the sociological literature are: the "behavioural" explanation; the "social selection" theory, and its opposite, which presumes an inherent social factor (the "structural" explanation) (Blane 1985; Cardano 2008; Costa and Spadea 2004; DHSS 1980; Macintyre 1997).
1.3 The behavioural explanation maintains that the poorer quality of health experienced by disadvantaged classes is due to the fact that such groups more frequently adopt life styles and behaviour open to risk and therefore considers health as the result of purely individual choices. Social selection, on the other hand, sees social inequalities in health as a reflection of the phenomenon of social selection on the basis of health, with those who already suffer poor health channelled to paths of downward mobility. The opposing theory, the so-called "structuralist" explanation (due to social factors), maintains that it is the position in the social structure which influences health because the social position is associated with resources which determine exposure (and degree of exposure) to physical and psycho-social factors recognized as plausible organic causes of illnesses (Blane et al. 1997; Link and Phelan 1995).
1.4 Given that these explanations are not necessarily mutually exclusive, in general terms, the structuralist explanation is the one that, at least in the field of in sociology, has found the most consensus and empirical support, with many clinical studies confirming the existence of significant health effects determined by factors of social diversity, also extending over substantial periods of time (Blane 1985; Cardano 2008; DHSS 1980; Jonsson and Mills 2001; Macintyre 1997; Ross and Wu 1996). From this point of view, social conditions can be defined as the fundamental factor in sickness and health (Link and Phelan 1995). They are directly associated in a multi-faceted and dynamic way to health, as they provide the resources (transferability from one situation to another) so that, whatever the risks and diseases in question, those in more advantaged social conditions will manage to escape relatively unscathed. Some experts even go so far as to consider social factors as a matrix which can assume physical forms, becoming incorporated like scar tissue (Costa and Spadea 2004, 6). In addition to the factors discussed thus far, we should also consider socio-environmental factors which can affect the health status of populations. Studies focussing on variations in ecological typologies take into consideration the relations between contextual features of a certain area and the health status of the resident population (Woods et al. 2005; De Vogli et al. 2005; Basegaña et al. 2004; Singh and Siahpush 2002; Wilkinson 1992, 1996, 1997).
1.5 The influence of territorial context can play different roles depending on the grouping level considered (Nuvolati and Tognetti Bordogna 2008). It can directly concern the context in which the subject lives (block, quarter, residential area) or, more indirectly, the healthcare institutions operating in a given administrative area (town, region, country). One particular branch of environmental health studies evaluates disparity of access and performance of local healthcare services in relation to the socio-economic status of the user populations (van Doorslaer et al. 2000; Waters 2000). These studies identify "determinants" of social inequalities in health, over and above the purely social types, such as for example cultural capital, occupational status, social support, also including healthcare factors such as preventive medicine, early diagnosis and patient care pathways (Costa et al. 2004). Some studies have focussed on the implications arising from territorial diversity in healthcare systems, considering different levels of care and assistance available (Lucchini, Sarti and Tognetti Bordogna 2009; Spadea 2004).
1.6 Since the national level constitutes a natural level of comparison at environmental level, in many cases the study of contextual effects focuses on macro-differences in area (Figueras et al. 1994).
2. The research objective: comparison of health inequalities at the European level
2.1 This paper aims to undertake a comparative analysis of health ("health" being understood in the sense of self-perception of health -see paragraph 3 for a brief discussion of it-) and the social gradient in health in different European countries.2.2 The first part of the analysis entails a simple measurement of the average level of health existing in different countries. It is of interest to establish whether there are differences in the average level of health among European countries and to see if any such differences only reflect a different social "composition" or remain after accounting for a series of individual characteristics which are known social determinants of health, implying a contextual effect.
2.3 Various studies have confirmed that beyond individual characteristics closely correlated to health (age, gender, socio-economic conditions, physical characteristics and life style), there are still differences among countries, with several reasons proposed to explain the phenomenon (Subramanian et al. 2001). In the first case, differences in the average level of health among European countries can reflect different socio-economic conditions. The current debate centres on the relative importance levels and distribution of income in influencing health. In terms of the relation between health and socio-economic level of the subject's community[1], cross-sectional data has verified that it exists and that there is a (modest) autonomous effect of context which goes beyond that of the individual socio-economic factor at micro level (Robert 1999; Robert and House 2000; Subramanian et al. 2001). However, when it comes to the presumed association between health and inequality in distribution of income in developed countries - proposed for the first time by Wilkinson in 1992 - there is still no consensus at present. Some experts maintain that Wilkinson's results were due to the particular selection of developed countries studied, and to the lack of controls on potentially confusing variables (Lynch and Davey Smith 2002; Mackenbach 2002). Others have found empirical evidence supporting the existence of the association (although still with some grey areas[2]) in studies of the U.S. and UK (Kaplan et al. 1996; Lynch et al. 2000; Robert and House 2000; Subramanian and Kawachi 2004).
2.4 The different levels in perceived health could also be due to differences in the healthcare systems themselves. There are healthcare systems in Europe which differ to a significant degree (in coverage, financing, role of the state)[3] and some studies have found differences in mortality rates linked to the availability of modern medical care (WHO 2000).
2.5 European healthcare systems have been historically differentiated on the basis of various characteristics and some studies have hypothesized and constructed a classification table grouping countries on the basis of their success and failure to achieve the service offered, to meet demand and the performance of the institutions set up to cater for citizens' healthcare. In one such classification Figueras and colleagues (1994) identify four types of service, as follows:
- the Scandinavian countries and UK, which after the Second World War moved gradually from programmes of social welfare insurance to comprehensive models of national healthcare services, with universal coverage and an organized model for supply of services;
- the Mediterranean countries (Italy, Spain, Portugal and Greece), characterized by "a distinct pattern of health and sickness, a common evolution of national healthcare services, shared principles, limited applicational achievements, similar models of organization and supply (of services) and, in years recent, a common crisis and shared responses to it" (Figueras et al. 1994, p.136);
- countries in the centre-west of Europe (France, Germany, Austria, The Netherlands, Belgium and Luxembourg), characterized by well-developed models of obligatory social welfare insurance, which supplements financing of healthcare services supplying coverage to almost the entire population, with some small changes to the supply model;
- countries of centre-eastern Europe (Poland, Czech Republic, Slovakia, Hungary, Slovenia), former socialist healthcare systems currently undergoing revision.
2.6 Given the above differences, it is without doubt possible that different healthcare systems respond differently to demands for efficiency and equity and we cannot therefore rule out the possibility that this contributes to explaining any differences in average standard of health existing among countries. However, even though it is intuitively obvious that access to healthcare services and their quality are important determinants of health, various factors contribute to the current opinion that healthcare in fact plays a limited role in explaining health inequalities in developed countries (Marmot et al. 1994; Robert and House 2000). Firstly, health inequalities have remained significant indeed at times have even worsened including in countries with national healthcare systems expressly designed to improve equality of healthcare access and patient care (Robert and House 2000). Not even in cases where a large portion of gross national product is spent on healthcare assistance does this seem linked to better results in terms of equality of health (Marmot et al. 1994). Secondly, these inequalities are found both in cases of diseases which are curable and non-curable, in the latter case the presence or absence of healthcare assistance making little or no difference. Even in the case of curable diseases often any differences found more concern incidence and exposure to risk factors than mortality/survival rates (seeCosta et al. 1994, 30). Finally, different studies have shown that even controlling the variables relative to healthcare access and its quality, the relation between socio-economic position and health remains significant (Robert and House 2000). This is not to say, however, that equality in healthcare is not important. On the contrary, such equality must be pursued in order to prevent a situation where inequalities in healthcare reinforce inequalities in health. Even if health inequalities within a country do not seem to be due to differences in access to and quality of the healthcare system, it remains to be seen whether differences among healthcare systems can account for the differences in degree of health inequality found among those countries.
2.7 Returning to the question of the possible reasons for differences in average health among different countries, one last possibility is that such differences are not only linked to objective factors, but could also be due to cultural diversities which influence the way health and sickness are thought of and perceived. This is a possibility that must be considered especially if self-perception of health is used as an indicator: different cultures use different frameworks for evaluation of health, so that often differences in terms of self-perception of health remain after accounting for social and healthcare characteristics (Jylha 2009; Zimmer 2000). It is also known that there are specific cultural approaches to experience of and description/reference of physical symptoms, and the association between physical symptoms and self-perception of health can vary between cultures and countries (Jylha 2009; Zimmer 2000).
2.8 We now come to the second part of our analysis - measurement and comparison of social inequalities in health across European countries. Firstly, we must verify whether there is indeed a social gradient in health in all European countries and whether the scale of any such gradient varies among countries. The effect of age on self-perception of health seems likely to be broadly similar across European countries, probably because health is above all a biological state and the process of ageing is a crucial determinant of it; the relation between education and health, on the other hand, has been shown by some studies to vary from country to country (Muller 2002).
2.9 The relation between education and health can be explained in several ways. Those with more access to education tend to attain better employment (more healthy, less stressful, greater autonomy) (Blane 1985; Brunner and Marmot 2006; Wilkinson and Marmot 2003); they earn more and can therefore afford better housing and living conditions (for example, a better diet) (De Irala-Estévez 2000; Mancino 2004; McLaren 2007); in general, they have a better knowledge of medicine and make greater use of healthcare services, including preventive medicine (Herzlich and Adam 1999). Nevertheless, it goes without saying that the advantages of education are conditioned by the possibilities offered in the country (in terms of labour market, healthcare services available, etc.).
2.10 For this reason it is of interest to verify whether the degree of social gradient varies among countries and whether these variations are linked to the characteristics of the countries in question (for example gross domestic product or amount of healthcare spending). In particular, it would be interesting to investigate the relation between average level of health in the country and the degree of social gradient.
2.11 One final consideration concerning the social gradient in health is linked to studies on the so-called "cumulative advantage". The term cumulative advantage refers to the gradual accumulation of various resources, represented in the form of trajectories that diverge with advancing age. From this perspective health is considered as an endowment or a form of capital which the various social groups can accumulate or at least maintain in different ways (O'Rand and Henretta 1999; Di Prete and Eirich 2006)[4]. All these theories presuppose a positive relation between low socio-economic position and psycho-physical deprivation, manifested from the first years of life and thereafter increasing with the passage of time. Obviously, however, the process of cumulative advantage as regards health is limited by the finite nature of human life and it therefore follows that the accumulation of competitive advantage diminishes, rather than accelerates, the tendency for a decline in health with age (Lauderdale 2001; Lynch 2003;Willson et al. 2007).
2.12 Even though there is no consensus in the literature regarding an increase of inequalities with advancing age[5], recently a survey by Willson and colleagues (2007), using a broad dataset of microdata, shows that, carefully controlling for selection effect, the benefits of socio-economic condition still remain in old age. This analysis will also seek to verify whether, and to what extent, the effect of education varies with age.
3. Data and analytical model
3.1 Our analysis was carried out using ESS data (European Social Survey), cross-sectional series 1, 2 and 3, with data gathered from different European countries from 2002 to 2006 (first two series) and from 2006 to 2007 (third series). The European countries considered are: Austria, Belgium, Denmark, Finland, France, Germany, Greece, Ireland, Italy, Luxembourg, Norway, the Netherlands, Poland, Portugal, UK, Czech Republic, Slovenia, Spain, Sweden, Switzerland and Hungary. The overall cohort was 88.842 subjects interviewed, from about 1.500 to 8.000 per country.3.2 Self-perception was used as an indictor of the overall state of health of subjects, expressed on a scale from 1 (worst) to 5 (best). Although subjective assessments of health do not always coincide with objective reality (for example in cases of asymptomatic diseases) (Blaxter 1990), self-perception here proved an excellent indicator of state of health. It was closely correlated to objective evaluations of health and a good predictor of mortality and morbidity (Idler and Benyamini 1997; Ferraro and Farmer 1999; Jylha 2009). Self-perception of health is undoubtedly a rather vague measure and it is not always easy for the researcher to understand precisely what is being measured. Nevertheless, the fact that self-perception of health correlates well with mortality, even after controls are carried out for objective evaluations of health suggests that, precisely because of its generic nature, this measure expresses all aspects of health significant for the purposes of survival, even those which cannot be assessed by precise questions (Jylha 2009). We have therefore used just one indicator of health, which, in providing a relative evaluation, can summarize the effective state of health of a subject, regardless of age (Willson et al. 2007).
3.3 As indicator of socio-economic status (SES) and predictor of health we have used education, or more precisely years of formal instruction (from 0 to 25). The socio-economic status of subjects can be measured by several indicators: these typically include education, occupation, income (or other measurement of economic conditions), or a combination of these indicators. The choice of SES indicator to be used is not to be taken lightly when we consider its relation with health; according to Lahelma et al. (2004, 331), different studies on health inequalities suggest that "at least a part of the effect on health of each socio-economic indicator is explained or mediated by other socio-economic indicators. Far from being mutually interchangeable, the various socio-economic indicators are in fact determinants of health which are partially independent and partially inter-dependent". In conclusion, education, occupation and income without doubt overlap to a great degree, but the correspondence between them is not always exact and to fuse them into a single SES indicator creates a certain distortion. Level of education is often recognized as the best predictor of life style linked to health and is the indicator with the most significant effect (De Irala et al. 2000; Hupkens et al. 2000). In addition, compared to other measures of SES, an educational qualification has at least two advantages (Arber et al. 2001). Firstly, it is a measure of social position valid for all (young and old, women and men)[6], unlike, for example, occupation, which is only available for a limited part of the population (those who work). Secondly, the educational qualification is generally stable over time, because it rarely changes after the individual has completed full-time studies.
3.4 Finally, the other control variables in the models are:
- Age (centred around the average, 46), from 30 to 64 years;
- Gender, 1 for males and 0 for females;
- Educational qualifications of father, an ordinal variable with seven categories (treated, however, as a metric): primary education not completed; basic education; lower level secondary education; higher level secondary; post secondary but not third level; primary higher education (III level); second level higher education;
- Number of survey (first and second series of the period 2002-2006, third from the period 2006-2007)
- Countries: Austria, Belgium, Switzerland, Czech Republic, Germany, Denmark, Spain, Finland France, UK, Greece, Hungary, Ireland, Italy, Luxembourg, the Netherlands, Norway, Poland, Portugal, Sweden and Slovenia.
4. Results of the analysis
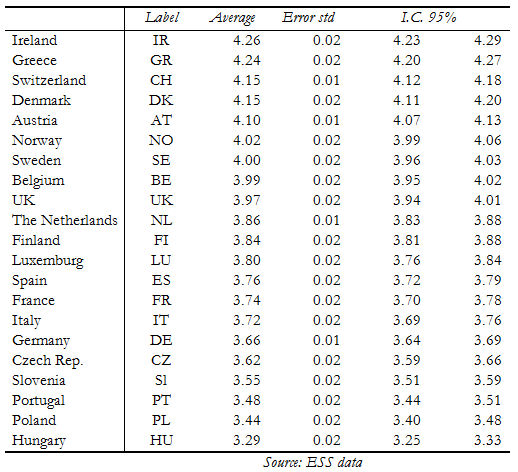
4.1 We shall begin with a descriptive analysis. A simple descriptive, univariate analysis shows that the three countries in which the state of health is worst are Hungary, followed by Poland and Portugal. The countries in which average health is the highest are, in descending order: Ireland, followed by Greece, with Switzerland and Denmark level third. The same order also applies evaluating by gender. However, in general, and across all countries, the state of health perceived by women is lower than that for men.| Table 1. Descriptive perception of health on a scale 1-5 (no weights) |
|
The graphics of fractional polynomials show that the state of good health diminishes with advancing age. The trend is similar across all countries, probably reflecting the biological process of aging.
Basic model.
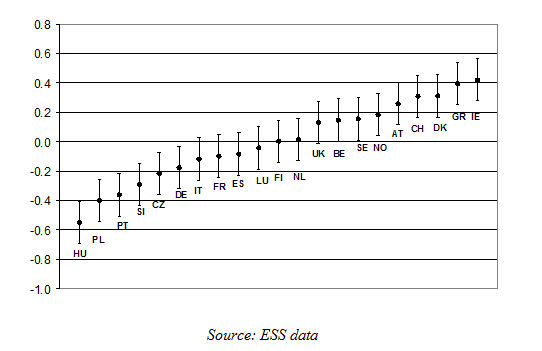
4.2 The first model implemented is a simple model of unconditional averages (unconditional means model) which allows us to split the variance in perception of health into individual and contextual components, without controls on individual characteristics. This model is used as a base to compare with the final model, which will also include some important factors of individual diversity, which should substantially reduce the first level variance.4.3 The mean European level (not conditioned by individual characteristics) (grand mean) was found to be 3.85 (standard error 0.057). [7] The ranking of countries calculated with this model is broadly similar to that already presented in the descriptive table[8]. The Rho is 0.09, (i.e. 9% of the variance in the dependent variable is attributed to the second level) and is obtained by expressing second level variance (0.068) against total variance (or by the sum of second level and first level variance, equal to 0.718).
| Graph 2. Residuals from intercept in the basic model of perceptions of health per country (grand mean) |
|
Final model.
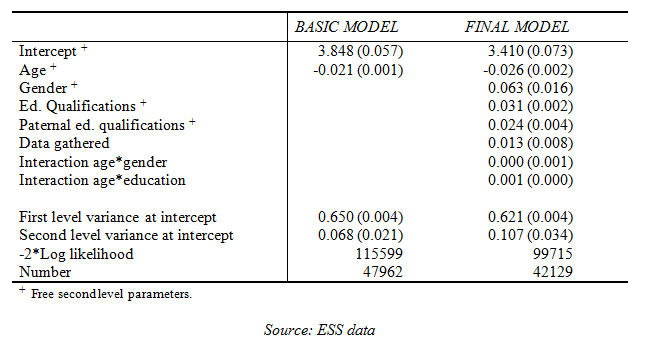
4.4 In the final model age is centred around the mean (46 years), so that a substantial value can be attributed to the intercept, which in this case represents the segment comprising 47-year old women, with zero years of educational instruction (formal), a father with a low level of education, taken from the second series of data. The intercept is 3.41 for the segment of reference (standard error 0.073).[9] At European level, for each additional year of age there is a deterioration in health of 0.026, on a scale of 5 positions (standard error 0.002). It comes as no surprise that age is the most important predictor of health: probably this result expresses the effect of variables of a biological and genetic nature which vary over time and which are not explicitly dealt with in the model. Males have a competitive advantage of 0.063 points (standard error 0.016). For every additional year of formal educational instruction there is an increase of 0.031 in perception of health, after considering paternal educational qualifications (standard error 0.002). This means, for example, that 15 years of additional educational instruction entail an improvement of about half a point (0.46) on the 5 point scale. Obviously, differences in health are therefore significantly structured on the basis of educational qualifications. Beyond the effects of the child's formal instruction, the effect of paternal educational qualifications is also significant and it is equal to 0.024 on the 7 point scale (standard error 0.004.[10] In terms of interactions, there is no interaction between gender and age. There is however significant interaction between educational instruction and age; more specifically, with advancing age the protective effect of education on health increases. For each additional year of age, the gradient increases by 0.001. This appears to confirm the hypothesis of cumulative advantage. Following the introduction of the age variable, first level variance reduces to 0.650: 4% less than the basic model. After introducing the other individual variables and their respective interactions, first level variance is 0.621, a reduction of a further 7% on the first model.| Table 2. Multi-level linear regression models: estimates of beta parameters, respective standard errors in brackets. |
|
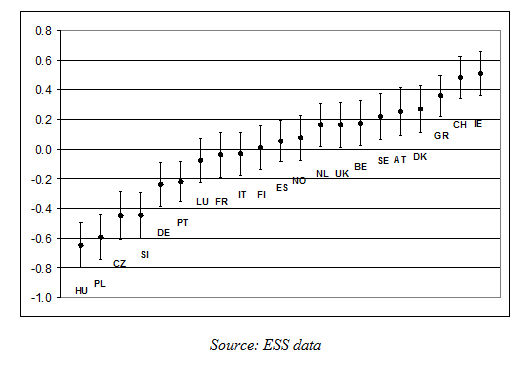
| Graph 3. Residuals at intercept in the final model per country |
|
4.5 The most significant differentials are found at the intercept, which should summarize the effect of a number of factors of a socio-economic, educational and cultural nature, not explicitly described by the equation. As Graphic 3 shows, even after controls for significant individual diversity factors (age, gender, level of education), Ireland, Switzerland and Greece all show significantly better health than the European average; Hungary, Poland, the Czech Republic and Slovenia all perform worse than the average.
6.3 Concerning differentials in relation to age, there is a certain uniformity, even though, curiously, ages has less impact on health in eastern European countries such as the Czech Republic, Poland and Hungary. The slight differences in differentials for the gender and education variables suggest however that there is a transnational gradient, common across all European countries. The graph of residual variance shows covariation between the mean level of health and the degree of social gradient in health (with least-off countries showing a stronger effect of education on health), but it should be noted that the evidence for this is weak and statistically non significant. Overall, our analysis shows evidence of differences among countries concerning mean levels of health, as well as a substantial shared gradient attributable to individual characteristics (of a biological and social nature) that structure differences in health within countries. To explain second level variance we must now introduce the macro variables (second level).
5. Some considerations on the variability in health among European countries
5.1 We identified a measure, based on residual variance of the intercept in the final model, which expresses differences in health among the European countries considered, net of individual variables. It is of interest at this point to investigate whether the countries examined show characteristics associable with this measure. We can hypothesize a series of indicators which can predict diversity, and conjecture that macro variables (of the socio-economic type or linked to models of healthcare) are in some way associated with them.5.2 Obviously such associations are only the merest correlations, as there is insufficient empirical data to establish any causal link. We must be content to stress the effectiveness of these indicators as good predictors of differences in mean health in the different countries, irrespective of the individual characteristics of inhabitants. Prior to proceeding with the macro variables, we should first consider two further aspects. The first concerns a form of validation of the measure identified. Given that the measure indicates differences in health in the various countries, we would expect that it is linked at a contextual level with general survival indicators. In particular, we considered life expectancy at birth in 2005 (for Belgium and Portugal the data available was for 2004 and for Italy 2003).
5.3 As can be seen in Figure 4 the residual variance and life expectancy correlate well for countries in eastern Europe, and for several of the other countries examined. The outliers are Ireland, Denmark and Greece, which show health on average slightly higher than expected compared to the life expectancy data. Germany, France and Slovenia, on the other hand, show health on average slightly lower than the norm, compared to life expectancy. We cannot exclude the possibility that variance could be due to variability in interviewees interpretation of questions regarding self-perception of health in the various countries. Overall, there is a close correlation between our result and aggregate data for life expectancy at birth.
| Graph 4. Life expectancy at birth in 2005 (x-coordinate) and residuals at the intercept of the final model by country (y--coordinate). |
|
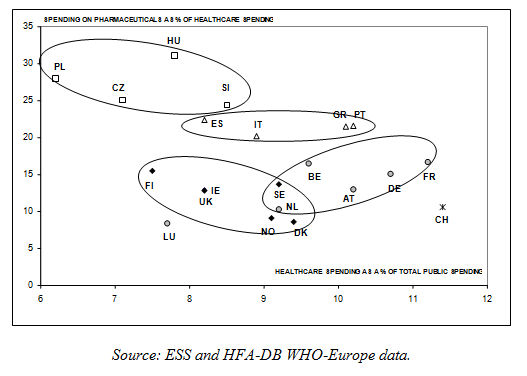
5.4 The second consideration concerns the definition presented by Figueras and colleagues (1994), which we have already mentioned, in which the European countries are grouped into clusters on the basis of the way their healthcare systems are organized. It seems worthwhile, before proceeding, to establish some empirical confirmation of this classification. After some trials, we identified two indicators that measure the percentage of gross domestic product (henceforth GDP) spending on healthcare and the percentage of spending on pharmaceutical goods against the total spending on healthcare. Both are relative indicators (being percentages) of the characteristics of healthcare systems in terms of economic organization. The first indicates the overall weight of healthcare costs on resources available, the second shows how these costs are spread, whether spent on pharmaceutical goods or on healthcare services (personnel, structures, prevention or other). These indicators are linked to the policies pursued by the public administrations of the various countries involved. The resources made available to meet the population's healthcare demands are allocated on the basis of management decisions by healthcare bodies. Over half of spending on pharmaceutical goods, for example, is reimbursed or paid directly by states (Jacobzone 2000). These two indicators constitute two good proxies indicating how European countries organize their public healthcare systems. By plotting the two indicators together we have a map which approximates quite well with the segmentation proposed by Figueras and colleagues (1994).
| Graph 5[11] . Percentage of healthcare spending against total GDP and percentage of spending of pharmaceuticals against total healthcare spending (in 2005) |
|
5.5 At this stage we have shown that the residual variance at the intercept of the final model represents a good predictor of health in the various countries, and also that economic organization of healthcare systems, classified according to the different spending of resources, can be grouped into four clusters of countries: 1) the Scandinavian countries (more Finland), Ireland and UK, 2) the Mediterranean countries, 3) countries of centre Europe and 4) countries of Eastern Europe.
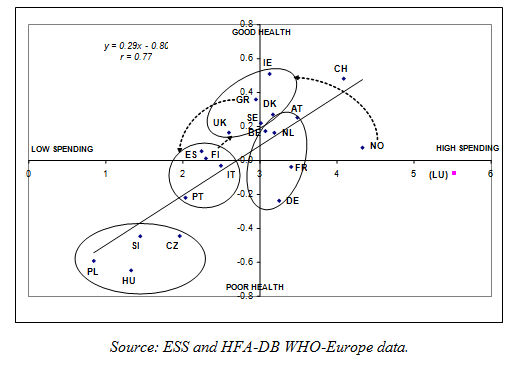
5.6 On the basis of these two elements we can compare different indicators of context in the search for a good macro-economic predictor of variability in health in the different European countries. We have focussed on two aspects. The first is the macro-economic context, measured by a factor summarizing the unemployment rate (expressed in percentage terms) and GDP per capita (expressed in PPP$) in 2005, the second is per capita spending on healthcare (equivalent) in 2005. By plotting the two datasets with residual variance at the intercept we obtain the following graphics.
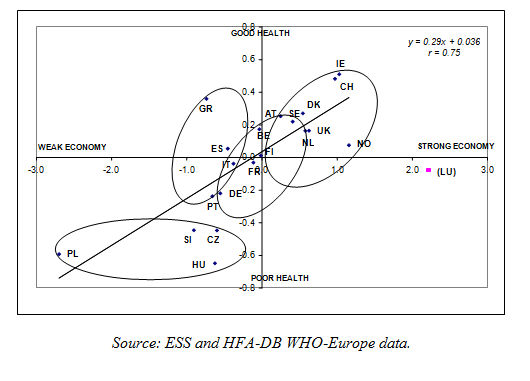
| Graph 6. Residuals at the intercept of the final model (y-coordinate) and economic factor based on unemployment rate and GDP (x-coordinate). |
|
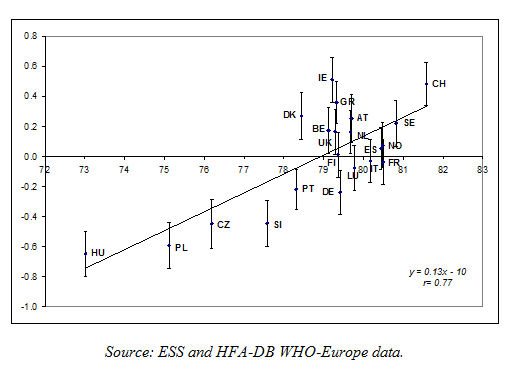
| Graph 7. Residuals at the intercept of the final model (y-coordinate) and total health expenditure, PPP$ per capita in thousands, WHO estimates in 2005 (x-coordinate). |
|
5.7 In both cases the correlation is positive, so that the countries that are economically better off and with greater per capita spending on healthcare tend to show higher average values for self-perception of health. (The correlations are fairly high in both cases, 0.75 and 0.77 respectively, and statistically significant).[12] It is also known that GDP and healthcare spending have been historically linked, although not independently of the organizational nature of healthcare systems (Clemente et al. 2004). The classification of European healthcare systems proposed by Figueras and colleagues (1994) seems to be confirmed by Graphics 6 and 7, which show that:
- the Scandinavian countries (more Finland) and UK have generally strong economies, average per capita spending on healthcare and a fairly good standard of general health. Finland is the one exception, which has lower spending on healthcare and slightly worse general health than other countries in the group.
- the economies of the Mediterranean countries are slightly weak, healthcare spending and general health are average (with the exception of Greece, which for the same economic conditions spends more on healthcare and has better general health).
- the countries of centre-western Europe have average economies, quite high per capita spending on healthcare, but with varied standards of health.
- Finally, the countries of eastern Europe have weak economies, low spending on healthcare and poor health.
6. Conclusions
6.1 The most significant result of the work here presented is confirmation of a social gradient in European health. The effects of traditional individual factors of diversity in health (age, gender, education) are more or less uniform across all European countries. In particular, from a sociological point of view, it is worth underlining the important role of education: for every additional year of formal instruction there is an increase of 0.031 in perception of health. This result confirm the relevance of structural factor in the explanation of inequalities in health. However, using cross sectional data we are not able to appropriately address the issue of reverse causality; caution is needed in the interpretation of results.6.2 Despite a common social gradient in health, there are differences among countries in the perception of general health, which remain even when the above mentioned factors are accounted for, constituting potentially significant compositional characteristics. It seems therefore that intercept differences may be due to macro level variables. We have hypothesized a possible role played by some economic indicators, such as per capita GDP (equivalent) or per capita healthcare spending, showing that these can effectively account, at least in part, for the differences in perception of general health amongst countries. We have also seen that such associations echo the classification proposed by Figueras and colleagues (1994) regarding organizational differences among the different European healthcare systems. There is good reason to suppose that the differences in mean self-perception of health among countries can be accounted for by macro characteristics, such as indicators of the country's economic wellbeing, and, more in general, its socio-institutional assets and policies.
6.3 However, we should remember that just a little amount (9%) of variability in health is attributable to macro-level factors, suggesting not surprisingly- that micro level factors are far more important predictors of individual health. Hence, actions aimed at reducing social inequalities in health should address the micro level determinants of health.
6.4 The reduction of social inequalities in health is a very important goal since health disadvantages tend to be added to pre-existing social disadvantages creating a vicious circle in which health problems interfere with the process of educational and occupational attainment ending up reinforcing inequality.
Notes
1 Health and socio-economic level are defined differently in different studies. Health is variously understood as mortality, life expectancy or as particular states of individual health (self-perception, number of chronic diseases and so on). The socio-economic level of an area is measured using various indicators (or mix of indicators); i.e., percentage of unemployed persons or of those with high educational qualifications, or mean or median income.2 This relation does not emerge in all studies, nor to the same extent at different territorial levels. In particular, there is greater evidence available for the U.S. than the UK (Subramanian and Kawachi 2004) and in the U.S., the relation is especially strong when measured at State level, and is weak or non existent when lesser territorial areas are considered (metropolitan or census areas).
3 See The European Health Report 2009 - Health and health systems, OMS-Europe (2009).
4 The concept of cumulative advantage was originally proposed by Merton (1968) to account for stratifications levels in scientific careers: the advantage enjoyed by a scientist at start of career is gradually augmented in the form of accumulated resources of income, power and reputation.
5 This is due to the fact that in older age groups (generally defined as over 65) such inequalities are diminished, so that the gradient between educational qualifications and health practically disappears, as confirmed by some empirical studies (House et al. 1990; Preston and Elo 1995). Other experts argue against this, citing the significant weight exercised by selection, so that only superselected individuals with low social position achieve old age, while others suffer a premature death (Ross and Wu 1996; Huisman et al. 2004).
6 Although data on educational qualifications is available for all, it should be noted that any given educational qualification can have different values in different groups and can therefore indicate different socio-economic situations. Cohorts may differ not only in terms of what is considered an average level of education, but also as regards the importance of qualifications (Arber et al. 2001).
7 The adaptability of the model (unconditional mean), measured by deviance (-2*LogLikelihood) is 115599.
8 The differences derive from the fact that in multilevel models the second level residual variance is estimated using a Bayesian procedure known as shrinkage factor.
9 The adaptability of the final model (-2*LogLikelihood ) is 99715.
10 The paternal educational qualifications is an ordinal variable with 7 categories, treated as a metric.
11 For Slovenia the data for 2005 was estimated by linear regression from the 1990-2001 series.
12 Luxembourg was excluded from the calculation of the two regression lines as the data is eccentric.
References
ARBER, S., Phillips, M., and Ginn, J. (2001) Disuguaglianze nella salute: classe sociale, età e genere, in Facchini, C. and Ruspini E. (edit by) Salute e Disuguaglianze, FrancoAngeli, Milano, pp. 114-144.BASEGAÑA, X., Sunyer J., Kogevinas M., Zock JP., Duran-Taulera E., Jarvis D., Burney P. and Anto J.M. (2004) Socioeconomic status and asthma prevalence in young adults, in "American Journal of Epidemiology", 160, 2, pp.178-188.
BLANE, D. (1985) An Assessment of the Black Report's Explanation of Health Inequalities, in "Sociology of Health & Illness", 7, pp.423-445. [doi:://dx.doi.org/10.1111/1467-9566.ep10832355]
BLANE, D., Bartley M. and Davey Smith G. (1997) Disease Aetiology and Materialist Explanations of Socioeconomic Mortality Differentials, in "European Journal of Public Health",7, pp.385-391. [doi:://dx.doi.org/10.1093/eurpub/7.4.385]
BLAXTER, M. (1990) Health and Lifestyles, Routledge, New York. [doi:://dx.doi.org/10.4324/9780203393000]
BRUNNER, E. and Marmot M. (2006) Social organization, stress, and health, in Marmot, M. and WILKINSON, R. G. (a cura di) Social Determinants of Health, New York: Oxford University Press, pp.6-30.
CARDANO, M. (2008) Disuguaglianze sociali di salute. Differenze biografiche incise nei corpi, in Polis, XXII, 1, pp.119-146.
CAVELAARS, A.E.J.M., Kunst A.E., Geurts J.J.M., Helmert U., Lundberg O., Mielck A., Matheson J., Mizrahi Ar., Mizrahi A., Rasmussen N., Spuhler T., and Mackenbach J.P. (1998) Morbidity differences by occupational class among men in seven European countries: an application of the Erikson-Goldthorpe social class scheme, in "International Journal of Epidemiology", 27, pp.222-230.
CLEMENTE, J., Marcuello C., Montanes A., Pueyo F. (2004) On the international stability of health care expenditure functions: are government and private functions similar?, in Journal of Health Economics, Volume 23, Issue 3, May 2004, Pages 589-613, ISSN 0167-6296, DOI: 10.1016/j.jhealeco.2003.08.007.
COSTA, G. and Spadea T. (2004) Introduzione, in "Epidemiologia e Prevenzione", (edit by) G.Costa, T.Spadea and M.Cardano, 28 (3), pp.3-14.
COSTA, G., Faggiano F., Ghetti V., Golini A., Muraro G. and Renga G. (1994) Introduzione: equità nella salute, lo scenario italiano, in L'equità della salute in Italia. Rapporto sulle disuguaglianze sociali, (edit by) Costa, G. and Fagiano, F., Milano: Fondazione Smith Kline: F. Angeli, pp. 23-42.
DE IRALA-ESTÉVEZ, J., Groth M., Johansson L., Oltersdorf U., Prättälä R. and Martínez-González M.A. (2000) A systematic review of socio-economic differences in food habits in Europe: consumption of fruit and vegetables, in "European Journal of Clinical Nutrition" 54, pp.706-714.
DE VOGLI, R., Mistry R., Gnesotto R., and Cornia G.A. (2005) Has the relation between income inequality and life expectancy disappeared? Evidence from Italy and top industrialised countries, in "Journal of Epidemiology and Community Health", 59, pp.158-16. [doi:://dx.doi.org/10.1136/jech.2004.020651]
DHSS (Black Report) (1980) Inequalities in Health: Report of a Research Working Group, London, Department of Health and Social Security. Disponibile on line all'indirizzo http://www.sochealth.co.uk/history/black.htm.
DI PRETE, T.A. and Eirich G.M. (2006) Cumulative Advantage as a Mechanism for Inequality: A Review of Theoretical and Empirical Developments, in «Annual Review of Sociology», 32, pp. 271-297.
FERRARO, K.F. and Farmer M.M. (1999) Utility of Health Data from Social Surveys: Is There a Gold Standard for Measuring Morbidity?, in "American Sociological Review", 64, pp. 303-315. [doi:://dx.doi.org/10.2307/2657534]
FIGUERAS, J. Mossialos E. Mckee M. and Sassi F. (1994) Health care systems in Southern Europe: is there a Mediterranean paradigm?,in "International Journal of Health Sciences",4, pp.135-146.
HERZLICH, C., Adam P. (1994) Sociologie de la Maladie et de la Médicine, Nathan, Paris, trad.it. Sociologia della Malattia e della Medicina, FrancoAngeli, Milano,1999.
HOUSE, J.S., Lepkowski J.M., Mero R.P., Kinney A.R. and Breslow R.J. (1990) Age, SES and Health, in "The Milbank Memorial Fund Quarterly", 68, pp.383-411.
HUISMAN, M., Kunst A.E., Andersen O., Bopp O.M., Borgan J-K., Borrell C., Costa G., Deboosere P., Desplanques G., Donkin A., Gadeyne S., Minder C., Regidor E., Spadea T., Valkonen T. and Mackenbach J.P. (2004) Socioeconomic inequalities in mortality among elderly people in 11 European populations, in "Journal of Epidemiology and Community Health", 58, pp.468-475. [doi:://dx.doi.org/10.1136/jech.2003.010496]
HUPKENS, C.L.H., Knibbe R.A. and Drop M.J. (2000) Social class differences in food consumption. The explanatory value of permissiveness and health and cost considerations, in "European journal of public health", 10, pp.108-113. [doi:://dx.doi.org/10.1093/eurpub/10.2.108]
IDLER, E.L. and Benyamini Y. (1997) Self-Rated Health and Mortality: A Review of Twenty-Seven Community Studies, in "Journal of Health and Social Behavior", 38, pp.21-37. [doi:://dx.doi.org/10.2307/2955359]
JACOBZONE, S. (2000), "Pharmaceutical Policies in OECD Countries: Reconciling Social and Industrial Goals", OECD, Labour Market and Social Policy Occasional Papers, No. 40, OECD Publishing, doi: 10.1787/323807375536.
JONSSON, J.O.e Mills C. (2001) Cradle to grave, Life-course change in modern Sweden, (a cura di), SociologyPress, Old Elvet, Durham.
JYLHA, M. (2009) What is self-rated health and why does it predict mortality? towards a unified conceptual model , in "Social Science and Medicine", 69, pp. 307-316.
KAPLAN, G.A., Pamuk E.R., Lynch J.W., Cohen R.D., Balfour J.L. (1996) Inequality in income and mortality in the United States: analysis of mortality and potential pathways, in "British Medical Journal", 312, pp.999-1003. [doi:://dx.doi.org/10.1136/bmj.312.7037.999]
LAHELMA, E., Martikainen P., Laaksonen, M. and Aittomäki, A. (2004) Pathways between socioeconomic determinants of health, in "Journal of Epidemiology and Community Health" , 58, pp.327-332.
LAUDERDALE, D.S. (2001) Education and Survival: Birth Cohort, Period, and Age Effects, in "Demography", 38, pp. 551-561. [doi:://dx.doi.org/10.1353/dem.2001.0035]
LINK, B.G. and Phelan, J. (1995) Social Conditions as Fundamental Cause of Health, in "Journal of Health and Social Behavior", "Extra Issue: Forty Years of Medical Sociology: The State of the Art and Directions for the Future", 35, pp. 80-94.
LUCCHINI, M. and Sarti S. (2009) Il peso dei fattori ascrittivi ed acquisitivi nelle disuguaglianze di salute: un modello di "Health Attainment", in POLIS ?????, XXIII, 1, 2009, Bologna, Il Mulino, pp.57-81.
Lucchini, M., Sarti S. and Tognetti, M. (2009) I welfare regionali e le differenze territoriali nelle disuguaglianze di salute, in Dimensioni della disuguaglianza in Italia: povertà, salute, abitazione, (edit by) A.Brandolini, C.Saraceno and A.Schizzerotto, Bologna, Il Mulino, pp.165-189.
LYNCH, J, and Davey Smith G, (2002) Commentary: Income inequality and health: The end of the story?, in "International Journal of Epidemiology", 31, pp. 549-551.
LYNCH, J.W , Davey Smith G., Kaplan G.A and House J.S. (2000) Income inequality and mortality: importance to health of individual income, psychosocial environment, or material conditions, in "British Medical Journal MJ", 320, pp. 1200-1204.
MACINTYRE, S. (1997) The Black Report and Beyond: What are the Issues, in "Social Science & Medicine", 44, pp. 723-745. [doi:://dx.doi.org/10.1016/S0277-9536(96)00183-9]
MACKENBACH, J., Bos V., Andersen O., Cardano M., Costa G., Harding S., Reid A., Hemstrom O., Valkonen T., and Kunst A. (2003) Widening socioeconomic inequalities in mortality in six western European countries, in "International Journal of Epidemiology", n.32 ,pp.830-837.
MACKENBACH, J. (2002) Editorial. Income inequality and population health, in "British Medical Journal", 324, pp.1-2. [doi:://dx.doi.org/10.1136/bmj.324.7328.1]
MANCINO, L., Lin B.H. and Ballenger N. (2004) The Role of Economics in Eating Choices and Weight Outcomes, in "Agriculture Information Bulletin" n. 791, Economic Research Service (ERS), U.S. Department of Agriculture (USDA) .
MARMOT, M. (2006) Introduction in Marmot, M. and Wilkinson R.G. (a cura di) Social Determinants of Health (second edition), New York: Oxford University Press, pp. 1-5.
MARMOT, M., Bobak M. and Davey Smith G. (1994) Spiegazioni per le disuguaglianze sociali nella salute, in Costa G. and Faggiano F. (edit by) L'equità della salute in Italia. Rapporto sulle disuguaglianze sociali, Milano: Fondazione Smith Kline: F. Angeli, pp. 273-326.
MCLAREN L. (2007) Socioeconomic Status and Obesity, in "Epidemiologic Reviews",29,pp.29-48. [doi:://dx.doi.org/10.1093/epirev/mxm001]
MULLERA. (2002), Education, income inequality, and mortality: a multiple regression analysis, in "British Medical Journal", 324, pp. 23-25.
NUVOLATI, G., Tognetti Bordogna M., (2008), Salute, Ambiente e qualità della vita nel contesto urbano, FrancoAngeli, Milano.
O'RAND, A. and Henretta J.C. (1999) Age and Inequality, Boulder, Westview Press.
OMS, (2000) The world health report.Health systems: improving performance, ISBN 92 4 156198 X, http://www.who.int/whr/2000/en/whr00_en.pdf.
OMS EUROPE, (2009) The European Health Report 2009 - Health and health systems, ISBN 978 92 890 1416 8 (ebook).
ROBERT, S.A. and House J. (2000) Socioeconomic Inequalities in Health: Integrating Individual-,Community-, and Societal-Level Theory and Research, in Albrecht, G.L, Fitzpatrick R. and Scrimshaw, S.C. (a cura di) Handbook of Social Studies in Health and Medicine, London, Sage, pp. 115-135.
ROBERT, S.A.(1999) Socioeconomic Position and Health: The Independent Contribution of Community Socioeconomic Context, in "Annual Review of Sociology", 25, pp.489-516. [doi:://dx.doi.org/10.1146/annurev.soc.25.1.489]
ROSS C.E., and Wu C. (1996) Education, Age, and the Cumulative Advantage in Health, 37, pp.104-120.
SINGH G.K., and Siahpush M. (2002) Increasing inequalities in all-cause and cardiovascular mortality among US adults aged 25-64 years by area socioeconomic status, 1969-1998, in "International Journal of Epidemiology", 31, pp.600-613. [doi:://dx.doi.org/10.1093/ije/31.3.600]
SPADEA, T. (2004) La prevenzione primaria e la diagnosi precoce, in "Epidemiologia e Prevenzione", (a cura di) G. Costa, T. Spadea and M. Cardano, 28, pp.97-102.
SUBRAMANIAN S.V, Kawachi I. and Kennedy B.P. (2001) Does the state you live in make a difference? Multilevel analysis of self-rated health in the US, in "Social Science & Medicine", 53, pp. 919. [doi:://dx.doi.org/10.1016/S0277-9536(00)00309-9]
SUBRAMANIAN S.V. and Kawaii, I.(2003) Response: In defence of the income inequality hypothesis, in "International Journal of Epidemiology", 32, pp.10371040 [doi:://dx.doi.org/10.1093/ije/dyg325]
(2004) Income Inequality and Health: What Have We Learn So Far?, in "Epidemiologic Reviews", 26, pp.78-91.
VAN DOORSLAER, E., Wagstaff A., van der Burg H., Christiansen T., De Graave D. , Duchesse I., et al. (2000) Equity in the delivery of the health care in Europe and the U.S., in "Journal of Health Economics", 19, pp. 553-558.
Velkova A, Wolleswinkel-van den Bosch JH, Mackenbach JP. (1997) The EastWest life expectancy gap: differences in mortality from conditions amenable to medical intervention, in "International Journal of Epidemiology", 26, pp. 7584. . [doi:://dx.doi.org/10.1093/ije/26.1.75]
WATERS, H.R. (2000) Measuring equity in access to health care, in "Social Science and Medicine" , 51, pp.599-612.
WILKINSON, R.G. (1992) Income distribution and life expectancy, in "British Medical Journal", 304, pp. 165-168 [doi:://dx.doi.org/10.1136/bmj.304.6820.165]
WILKINSON, R.G. (1997) Health Inequality: Relative or Absolute Material Standards?, in "British Medical Journal", 314, pp.1727-1728 [doi:://dx.doi.org/10.1136/bmj.314.7096.1727]
WILKINSON, R.G. (1996) Unhealthy Societies: the afflictions of inequality, Routledge, London. [doi:://dx.doi.org/10.4324/9780203421680]
WILKINSON R.G. and Marmot M. (a cura di) (2003) Social Determinants of Health: The Solid Facts (second edition), WHO Regional Office for Europe / Library Cataloguing in Publication Data (http://www.euro.who.int/document/e81384.pdf) .
WILLSON, A.E., Shuey K.M., Elder, G.H. 2007) Cumulative Advantage Processes as Mechanism of Inequality in Life Course Health, in "American Journal of Sociology", 112, pp.1886-1924. [doi:://dx.doi.org/10.1086/512712]
WOODS L.M., Rachet B., Riga M., Stone N., Shah A., and Coleman M.P. (2005) Geographical variation in life expentancy at birth in England and Wales is largery explained by deprivation, in "Journal of Epidemiology and Community Health", 59, pp.115-120 ZIMMER, Z. Natividad J., Lin H. and Chayovan N. (2000) A cross-national examination of the determinants of self-assessed health, in "Journal of Health and Social Behavior", 41, pp. 465-481.