How has Educational Expansion Changed the Necessary and Sufficient Conditions for Achieving Professional, Managerial and Technical Class Positions in Britain? A Configurational Analysis
by Barry Cooper and Judith Glaesser
University of Durham
Sociological Research Online 13(3)2
<http://www.socresonline.org.uk/13/3/2.html>
doi:10.5153/sro.1703
Received: 8 Nov 2007 Accepted: 4 Apr 2008 Published: 31 May 2008
Abstract
This paper, whose purpose is both substantive and methodological, focuses on changes over a nine year period, drawing on data from two British birth cohorts (individuals born in 1958 and 1970), and, substantively, employs set theoretic methods to explore the extent to which an upward shift in qualifications achieved led to any reduction in the roles class and gender played in the achievement of professional, managerial and technical (PMT) social class destinations in early adulthood. Our methodological purpose is to illustrate how a counterfactual modelling approach can be used together with Ragin's set theoretic methods to provide an alternative way of analysing relationships in this area. We draw on earlier work exploring the extent to which educational achievement was 'meritocratic' with respect to ability for these cohorts (Cooper 2005, 2006). Our configurational account of the causal pathways to various class destinations is set against the background of a simple model of 'meritocracy' (allocation to available class positions by qualifications alone taking account of the empirical marginal distributions). This model allows us to specify, counterfactually, what qualifications would have represented necessary and sufficient conditions in our modelled meritocracy for reaching the PMT class. By comparison of these conditions with the empirically derived necessary and sufficient conditions for achieving these outcomes (using Ragin et al's fs/QCA software) we show that while allocation processes were far from meritocratic in both cohorts, there were some changes in the way both class and gender combined with qualifications as conditions for destinations. We also show that Ragin's configurational methods, focussing on holistically-conceived cases and conjunctural causation rather than on the net effects of independent variables, provide a useful analytic technique for capturing relationships in this field.
Keywords: Boolean Methods, QCA, Social Class, Gender, Education, Meritocracy, Counterfactual Models
Introduction
1.1 This paper, drawing on data from two British birth cohorts, focuses on the occupational class destinations achieved by cohort members in 1991 (for the 1958-born) and 2000 (for the 1970-born). We employ set theoretic methods (Ragin, 2000) to explore the extent to which an upward shift over time in qualifications achieved was associated with changes in the extent to which the achievement of professional, managerial and technical (PMT) class destinations could be accounted for solely in terms of the qualifications achieved by individuals, i.e., in one interpretation of the term, meritocratically. Our configurational account of the empirical causal pathways to PMT class destinations is set against the background of an idealised alternative model of 'meritocracy' (allocation to available class positions according to qualifications alone). This model allows us to specify, counterfactually, what qualifications would have represented necessary and sufficient conditions for reaching a PMT class destination in the two cohorts in fully meritocratic worlds. By comparison of these conditions with the empirically derived necessary and sufficient conditions for achieving PMT class destinations in the real world we show that while allocation processes were some distance from being 'meritocratic' in both cohorts, there were changes in the ways both class and gender combined with qualifications as conditions for destinations. Methodologically, we show that Ragin's comparative configurational methods, focussing on holistically-conceived cases and conjunctural causation rather than on the net effects of independent variables, provide a useful analytic technique for capturing causal relations in this field (Müller, 1998).1.2 The work reported here is part of a larger programme of work exploring the use of configurational methods with large n datasets, in particular with two British birth cohorts (Cooper, 2005, 2006; Cooper & Glaesser, 2007). These set theoretic methods, developed in the sociological field largely by Ragin (for example, 1987, 2000, 2006a, 2006b), are designed to describe multiple conjunctural causation in terms of conjunctions of necessary and sufficient conditions rather than to establish the net effects of independent variables (as in additive regression models). They embody the assumption that causes frequently operate not individually but conjuncturally, i.e. that the effect of any cause may well be a function of the other causes with which it is conjoined (and therefore may not be well-captured by any average effects approach that does not take account of the context for any particular variable of other conjoined variables)[1]. Their prime purpose is descriptive rather than inferential. They effectively combine many of the assumptions of qualitative case study work with a concern for rigour more typically characteristic of the quantitative tradition. They have mostly been used, until recently, with small to medium n datasets. These methods have an inductive flavour, but we shall be using them here to compare a theoretical model with empirical data, and in a large n context.
1.3 This particular paper has been developed from a number of initial assumptions. First, given the analytic problems that arise when comparing crosstabulations across cohorts as a result of differences in various marginal totals, a method is needed that takes account of these. Second, that Boudon's queuing model (1974a, 1977) remains a useful device in this context and, in particular, it can provide an appropriate set of theoretical benchmarks against which to judge the degree of meritocracy characterising different periods. Third, that Boudon's model lends itself to analysis in the set theoretic language of necessary and sufficient conditions. It appears to have a greater affinity with these methods than with regression approaches (which partly accounts, we suppose, for Hauser's (1976) vigorous critique of Boudon's classic text). Fourth, that Ragin's Qualitative Comparative Analysis (QCA) method provides a useful tool for undertaking the set theoretic analytic work required in comparing the theoretical and empirical distributions of class destination according to meritocratic and ascriptive factors (see also Mahoney, 2001).
1.4 In recent years, a range of methods have been employed to answer the question 'might Britain be a meritocracy?' with vigorous debate ensuing over both the appropriateness of the methods employed and the meaning of the results obtained (Bond & Saunders 1999; Breen & Goldthorpe 1999, 2001, 2002; Lampard, 1996; Marshall & Swift 1993, 1996; Saunders 1995, 1996, 1997, 2002; Savage & Egerton, 1997). Meritocracy typically has been understood in this work as involving the achieving of positions via the exercise of 'ability plus effort' in contradistinction to a process whereby class destination reflects such ascriptive factors as class origin and gender (Young, 1958).
1.5 Here, we treat meritocracy as a potential property of the relationship between highest qualifications achieved and class destinations. This, of course, is a simplification of a complex matter. In relation to Young's (1958) treatment of meritocracy in terms of 'ability plus effort' we are effectively making the working assumption that an individual's highest qualification results from the joint operation of these two factors. This is clearly only partially the case for these cohorts (Bynner & Joshi, 2002; Cooper 2005; Cooper 2006). Furthermore, in constructing ideal-typical models of meritocratic allocation in the early part of the paper, we also assume implicitly that individuals seek as high a class destination as possible[2]. We also take the marginal distribution of class destinations as an indicator of the distribution of positions for which the individuals in our sample competed. This is also an approximation but not, we think, a problematic one.
1.6 The structure of the paper is a little unusual, as a consequence of the need to describe key elements of Ragin's approach at an appropriate point in the developing analysis. We begin by describing the sample and variables we employ, and then move on to construct our counterfactual meritocratic models. We then describe the key concepts and methods of Ragin's approach before using QCA in analysing some relevant empirical relationships in the two cohorts. Having established the extent to which some levels of qualification are either necessary or sufficient conditions for the achieving of PMT class destinations in our models, we turn our attention to using conjunctural methods in accounting for the modelled/real world discrepancies by introducing ascriptive factors into our models.
Data, Samples and Variables
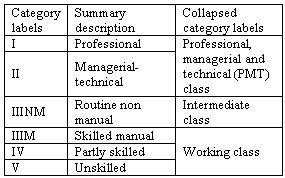
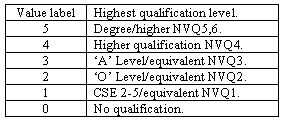
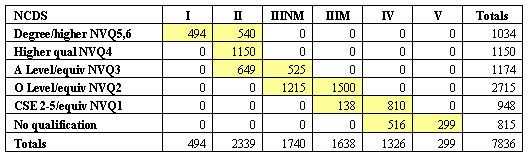
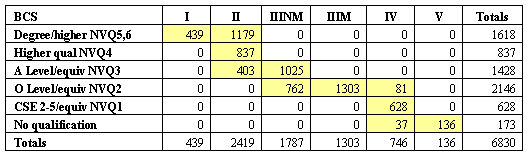
2.1 Our data are taken from the National Child Development Study (NCDS) and the British Cohort Study (BCS70). The NCDS comprises individuals born in Great Britain during one week in March 1958, the BCS70 those born during one week in April 1970. We use all those cases for whom complete data exist on social class of origin (father's social class) at age 11 (NCDS) or age 10 (BCS), cognitive ability at age 11 (NCDS) or age 10 (BCS70), highest level of qualification obtained[3] by age 33 (NCDS) or age 30 (BCS70) and social class of present or last occupation (at age 33 for the NCDS cohort or age 30 for the BCS70 cohort)[4]. For the NCDS sample, this leaves 7,836 cases and, for the BCS70, 6,830 cases. Since the original cohorts comprised some 17,000 cases each, there has clearly been a considerable loss of cases due to attrition and missing data.2.2 The social class categories employed are those of the UK's Registrar General's Scheme. We have collapsed the categories further to obtain the three categories shown in Table 1. We are aware of the problems associated with using the Registrar General's Scheme for sociological purposes (for example, Prandy 1999) but (i) we are constrained by the available datasets in this case, and (ii) given our primarily methodological purpose in illustrating the use of a set theoretic approach in conjunction with a counterfactual modelling approach, we do not believe the RG scheme results in any critical problems for our analysis of changes over a nine year period. The highest level of qualification variable refers to both academic and vocational qualifications obtained and is based upon whichever is the highest (see Table 2).
|
| Table 1. Social Class Categories |
|
| Table 2. Highest Level of Qualifications[5] |
Two Counterfactual Meritocratic Worlds
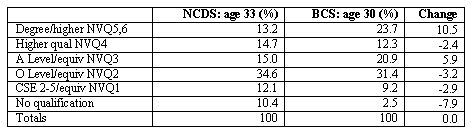
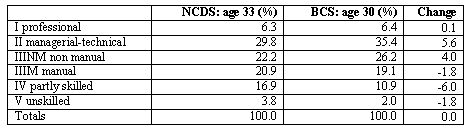
3.1 We begin by noting, for the 1958 and 1970 cohorts, the distributions of highest levels of qualification achieved and class destinations (Tables 3 and 4). At least within our subsets of the birth cohorts we can see that, while there had been upward shifts in both distributions, the shift upwards had been greater in the case of qualifications than in the case of class destinations. This is the scenario where the rate of educational expansion outstrips that of the growth in higher occupational positions treated in Boudon's classic work on education and mobility (Boudon 1974a).3.2 Before presenting our Boolean analyses of the degree to which a meritocratic principle seems able to capture the empirical relationship between qualifications and class destination for these cohorts we need to consider the ways in which the distributions in Tables 3 and 4 constrain and/or enable the results of meritocratic allocation. We therefore begin by considering the simulated meritocratic allocation of destination according to qualification, drawing on the queuing procedures employed by Boudon (1974a) and Thurow (1972). The results are in Tables 5 and 6. The distribution of cases across the cells in these tables is produced by a simple and strictly meritocratic procedure. It is assumed that individuals want the highest destination position possible and that allocation to destination positions is made by filling the class positions (from highest to lowest) with the most highly qualified individuals available.
3.3 Because we intend to present set theoretic analyses of the empirical crosstabulations of destination according to highest qualification in the body of this paper, it is appropriate when comparing these modelled data with the empirical data to refer to the related concepts of the necessary and sufficient conditions for achieving various outcomes (Boudon 1974b; Ragin 2000). For the moment, consider, for example, class destinations I and II, taken together to represent a PMT class. In both the NCDS cohort and the BCS cohort (Tables 5 and 6) all of those with a degree or its equivalent are allocated to a PMT class destination. Having a degree is a sufficient condition, in both of these modelled worlds, for reaching this class destination. The set of those with degrees is a subset of the set of those achieving a PMT outcome. In fact, having a qualification higher than 'A' level or its equivalent is also a sufficient condition for the outcome of reaching a PMT class destination. To see a change between the cohorts in respect of sufficient conditions for reaching this particular destination we need to consider those having a qualification of at least 'A' level standard. In neither modelled world is having a qualification of 'A' level or better a strictly sufficient condition for reaching a PMT class destination. Simple arithmetic shows that 84.4% of the relevant NCDS cases and 73.6% of the BCS cases with this level of qualification reach this class destination, with the remainder being allocated to ClassIII Non Manual.
|
| Table 3. Highest qualification (HQUAL) achieved in NCDS and BCS |
|
| Table 4. Class destinations achieved in NCDS and BCS |
|
| Table 5. A counterfactual meritocratic allocation model using NCDS marginals |
|
| Table 6. A counterfactual meritocratic allocation model using BCS marginals |
3.4 Later in the paper, we relax the test for sufficiency, moving from strict to weak implication, i.e. from 'if we have the condition, then we definitely obtain the outcome', to 'if we have the condition, then we are very likely to obtain the outcome' (Boudon 1974b). We might note, with this move in mind, that, in this particular NCDS / BCS comparison, the former cases are considerably nearer to perfect sufficiency (i.e. 100%) than the latter. Given the empirical marginal totals, but using a strictly meritocratic allocation procedure, we find that, over this nine year period, having 'A' level qualifications or better would, in this counterfactual meritocratic world, have moved further away from being a sufficient condition for achieving a PMT class destination. We will use the language of quasi-sufficiency (Ragin 2000) to refer to such situations of less than perfectly strict implication. A proportion greater than 0.80, for example, can be described as indicating an 'almost always' sufficient condition[6].
3.5 Examination of the tables also shows that, in both modelled meritocratic worlds, it is a necessary condition for achieving a PMT class destination to have at least 'A' level qualifications (see the I and II columns in the tables). Those achieving a PMT class outcome are a subset of those with this level of qualification. Furthermore, we can also observe that having qualifications above 'A' level would, over these nine years, have moved much nearer to being a necessary condition for achieving this outcome. While in the NCDS model, 77.1% of those achieving PMT class positions had this level of qualification, in the BCS model this rises to 85.9%. As we move from the NCDS model to the BCS model, having qualifications above 'A' level becomes nearer to being a strictly necessary condition for reaching a PMT class destination.
3.6 Clearly, looking at other outcomes (for example, avoiding manual destinations) would add to the set of statements that can be made about changes in the necessary and/or sufficient qualification conditions for achieving various outcomes. However, the important point to stress here is that this modelling exercise shows clearly (as did Boudon's original use of the approach with fictional marginals) that, even were the world to be strictly meritocratic in the sense assumed in the model, we would find shifting relationships of necessity and sufficiency simply as a consequence of the changing relationships between the empirical distributions of highest qualifications achieved and available PMT class positions over time. In comparing our various Boolean analyses of the two cohorts we will need to bear in mind constantly the background provided by these models. They effectively provide a set of meritocratic benchmarks against which to compare the empirical relationships between destination and qualification we shall describe later.
3.7 We have described two modelled worlds in which, based on certain assumptions, a meritocratic allocation principle operates. We have described some of the resultant relationships of sufficiency and necessity in these two worlds. To the extent that similarly meritocratic allocation occurs in the empirical worlds having the same marginal totals as the counterfactual worlds, we would expect to find the same relationships (perhaps muddied by random noise) in these worlds. Do we? We are going to explore this question using Ragin's Boolean approach to data reduction (Ragin 1987, 2000, 2006a). First, therefore, we need to describe some key elements of this set theoretic approach.
Some Set Theoretic Analytic Tools
4.1 QCA's general purpose is to address multiple conjunctural causation in the language of Boolean algebra. Boolean equations have a different functional form to the regression equations with which sociologists are familiar. Here is a crisp set[7] example taken from a recent paper contrasting the two approaches (Mahoney & Goertz, 2006), and where the upper and lower case letters indicate respectively the presence or the absence of 'qualitative' factors:
Y = (A*B*c) + (A*C*D*E)
In these Boolean equations the symbol * indicates Logical AND (set intersection), the symbol + indicates Logical OR (set union), and upper case letters indicate the presence of a factor, lower case letters indicate its absence. In this fictional example of causal heterogeneity, Y = (A*B*c) + (A*C*D*E), the equation indicates that there are two causal paths to the outcome Y. The first, captured by the causal configuration A*B*c involves the presence in the case of features A and B, combined with the absence of C. The second, captured by A*C*D*E, requires the joint presence of A, C, D and E. Either of these causal configurations is sufficient for the outcome to occur, but neither is necessary, given the existence of the other. The factor A is necessary but not sufficient. The factor C behaves differently in the two configurations. For the moment, we are assuming in these remarks that there are no empirical exceptions to the relationships embodied by the equation. Later, this assumption is relaxed and methods are described for dealing with the messiness of real data.
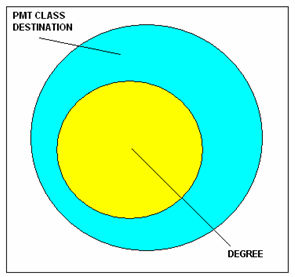
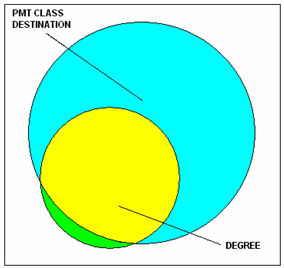
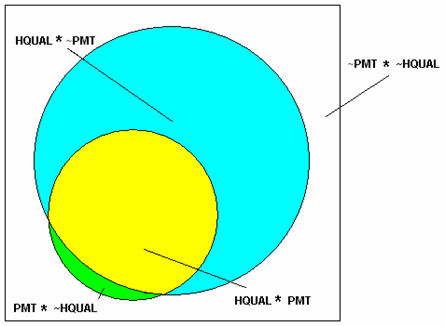
4.2 Sufficiency, understood causally or logically, involves a subset relationship. If, for example, a single condition is always sufficient for an outcome to occur, the set of cases with the condition will be a subset of the set of cases with the outcome. This is shown in Figure 1 based on the relationship between having a degree and achieving a PMT class destination (taken from the NCDS modelled data in Table 5). Given the condition, we obtain the outcome. In analysing empirical data, perfect sufficiency is unlikely to be found, and a situation like Figure 2 will often be found, where most but not all of the set of cases with the condition also are members of the outcome set. Using conventional crisp sets, the proportion of the condition set who are also members of the outcome set can be used as a measure of the degree of consistency of the empirical relation with a relation of perfect sufficiency (here: the number in the yellow subset divided by the number in the yellow and green subsets taken together). Figure 2 illustrates a relation that might be described as only 'nearly always sufficient'.
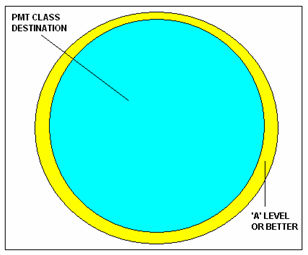
4.3 In Figure 3, returning to the data in Table 5, the relation between having qualifications of at least 'A' level standard and achieving PMT class membership is shown. This is another example of less than perfect sufficiency. Here the members of the yellow fringe of the 'A' level or better set are not also members of the outcome set. Most members of the condition set (84.4%) are, however. This example is also, in fact, a special case in that having at least 'A' level qualifications is a necessary condition for being in a PMT class position (and in the case of necessity the outcome set is, as can be seen, a subset of the condition set).
4.4 Venn diagrams can also illustrate Ragin's concept of explanatory coverage (Ragin 2006a). The proportion of the outcome set that is overlapped by the condition set can be used as a measure of the degree to which the outcome is covered ('explained') by the condition. In Figure 1, the coverage of the PMT class outcome by the condition of having a degree can be seen to be low, with 63.5% of the outcome set (shown in blue) not covered by the condition. In Figure 3, on the other hand, it can be seen that the whole of the outcome set (again in blue) is covered by the yellow condition set, and coverage is 100% (the arithmetic mark of a necessary condition in this simple case).
|
| Figure 1. Perfect Sufficiency |
|
| Figure 2. Quasi-Sufficiency |
|
| Figure 3. Quasi-Sufficiency (with perfect necessity) |
|
| Figure 4. Perfect Sufficiency (two conditions) |
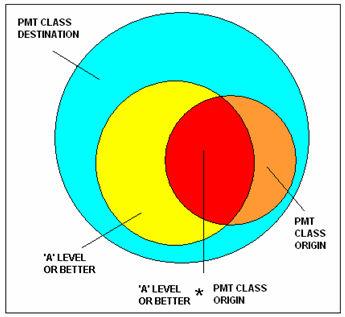
4.5 In more complex set theoretic models with more than one condition, coverage can be partitioned in a manner analogous to the partitioning of variance explained (Ragin 2006a). Since, later, in exploring some of the factors that account for the discrepancy between our modelled worlds and the real ones, we shall employ Boolean equations with more than one 'causal' condition we need to explain these central concepts. The partitioning of coverage into raw and unique components can be illustrated once again by reference to a (more complex) Venn diagram (Figure 4). This, at this stage of the paper, necessarily is based on entirely imaginary data since we have only considered one condition in our counterfactual models.
4.6 In this fictional case we have two crisp sets representing the conditions, 'AT LEAST "A" LEVEL QUALIFICATIONS' and 'PMT CLASS ORIGIN', and the outcome is the achievement of a PMT class position. The Boolean solution can be written as PMT_ DESTINATION = HQUAL_AT_LEAST_'A'_LEVEL + PMT_ORIGIN. Either having this level of qualification or being of PMT class origin (or both together) is sufficient for the outcome (since both condition sets, considered separately, are subsets of the outcome set). Greater coverage of the outcome is achieved by having both of these factors in the analysis rather than either alone.
4.7 We can also see here how coverage can be partitioned straightforwardly in the case of crisp sets. In the case of the relations illustrated in Figure 4 it is easy to see that the total coverage can be broken into three components:
- That due to being of PMT class origin while not having the qualification (the orange subset as a proportion of the blue outcome set)
- That due to having the qualification and being of PMT class origin (the red subset as a proportion of the blue outcome set).
- That due to having the qualification while not being of PMT class origin (the yellow subset as a proportion of the blue outcome set)
4.8 Taking highest qualification as an example, Ragin (2006a) would describe the first of these three (the yellow subset as a proportion of the outcome set) as the unique coverage due to having this level of qualification. On the other hand, he would describe the coverage due to having this level of qualification, whether or not this is conjoined with other causal conditions in the model (the yellow and red subsets taken together as a proportion of the outcome set), as the raw coverage due to membership in this set (having this level of qualification). Parallel arguments apply to the PMT class origin.
4.9 It only remains to illustrate the way in which a Boolean solution is generated from a crosstabulation (using Ragin's truth table algorithm) in the current version of the fs/QCA software (Ragin et al., 2006). Although this software makes it possible to use non-dichotomous factors (for example, an educational qualifications variable with more than two values) by employing fuzzy sets we use the less controversial crisp set approach (see Cooper 2005, 2006, and Cooper & Glaesser, 2007, for applications of fuzzy set methods to these data). We can use the real NCDS data to illustrate a multifactor conjunctural explanation of a general type to which we will return later. Of course, we will not expect to find perfect sufficiency in the real world and our example will show how the method embodied in the software addresses this problem. We will address the Boolean equation, PMT_DESTINATION = PMT_ORIGIN + HQUAL_DEGREE + MALE.
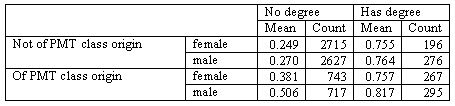
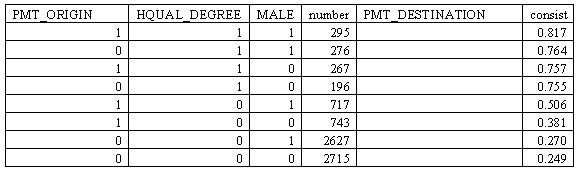
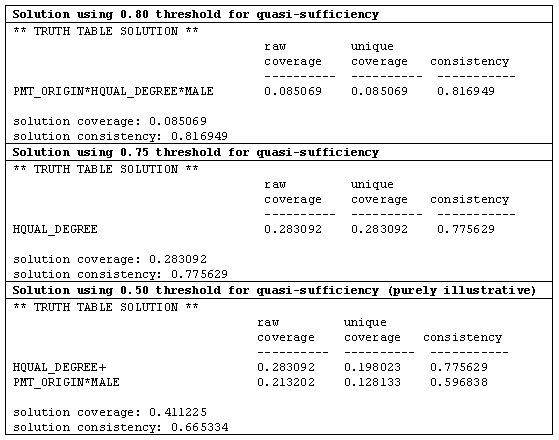
4.10 We begin with Table 7 showing the proportions gaining a PMT class destination by three factors (PMT class origin, having a degree, and sex). The first step is to reconfigure this as a truth table (Table 8). In this table, the first row, for example, represents the causal configuration PMT_ORIGIN*HQUAL_DEGREE*MALE with the upper case letters indicating membership in the three conjoined sets. The second step is to determine a threshold for quasi-sufficiency and, in the light of this decision, to enter a 1 into the empty outcome (PMT_DESTINATION) column against each row (or causal configuration) for which the consistency proportion in the final column passes the threshold set. This determines which configurations are allowed into the final solution[8]. There are two obvious possibilities for thresholds here, i.e. places where there is a jump in the consistency proportions, one at 0.8 and one at 0.75. Either of these might be considered to represent quasi-sufficiency[9] (or, if preferred, might be taken to indicate a much better than the weighted average chance of gaining a PMT class position, which is 0.362 for these 7836 cases, or a considerably better chance than the unweighted average for the eight configurations, which is 0.562).
4.11 Table 9 shows the two solutions, using first a 0.80 and, second, a 0.75 threshold. In the first case, just the first row of Table 8 is allowed through into the final equation; in the second the first four rows are. In this latter case these four rows (or 'causal configurations) are then subjected to an algebraic process of Boolean minimisation (Quine 1952) in order to create the final simplest solution[10]. Lastly although we would certainly not claim in a real application that a level of 0.5 should be used to indicate quasi-sufficiency we have included in Table 9, for purely illustrative purposes, a third solution using a 0.5 threshold simply to generate a more complex solution which we can use to illustrate the distinction between raw and unique coverage. The minimised solution, HQUAL_DEGREE + PMT_ORIGIN*MALE, based on the first five rows of Table 8, indicates that, at this purely illustrative 0.5 level for consistency, either having a degree or being a male from a PMT class background gives a better than 50% chance of reaching a PMT class destination. The overall solution has a consistency level (with sufficiency) of 0.665 and an overall coverage of 0.411. Of the 0.411, 0.198 is due uniquely to having a degree and 0.128 to being a male of PMT class origin. The remainder (0.411 minus these two, i.e. 0.085) is due to their overlap, i.e. being a male of PMT class origin with a degree[11].
|
| Table 7. Proportions achieving a PMT class destination (NCDS data) |
|
| Table 8. Truth table for the proportions achieving a PMT class destination (NCDS data) |
|
| Table 9. Three solutions of PMT_DESTINATION=PMT_ORIGIN + HQUAL_DEGREE + MALE |
4.12 After this diversion to describe these set theoretic methods, we now return to the substantive focus of the paper. In the next section we compare and contrast simple Boolean accounts (solutions of PMT_DESTINATION by HQUAL) of the modelled and real worlds for the two cohorts. In the subsequent section, we use more complex Boolean models to throw light on the nature of the modelled world / real world discrepancies we encounter.
The Two Empirical Worlds
5.1 The empirical distributions of destination according to highest qualification are shown in Tables 10 and 11. In these tables cells have been coloured to match those cells in the modelled tables that included cases. In the empirical NCDS world 57.6% of cases fall into cells that also contained cases in the modelled world; in the BCS case 63.0% do so.
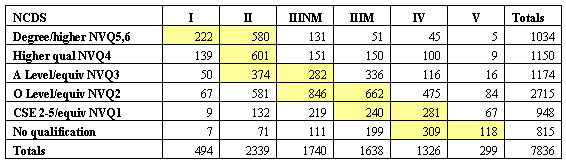 |
| Table 10. Actual Distribution of Class Destination by Highest Qualification (NCDS) |
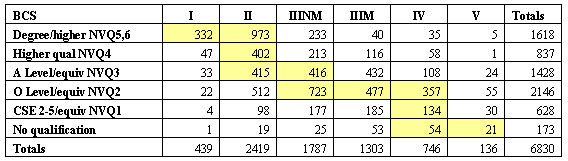 |
| Table 11. Actual Distribution of Class Destination by Highest Qualification (BCS) |
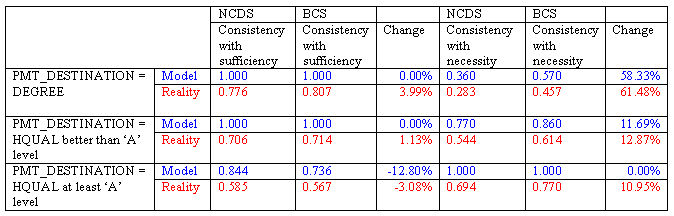 |
| Table 12. Sufficiency and Necessity measures for the modelled and actual worlds |
5.2 We turn now to an initial comparison of the relations of necessity and sufficiency (or approximations to them) that characterise these tables, focussing on a consideration of the outcome being a PMT class destination. In our earlier discussion of the modelled worlds, we considered three levels of the highest qualification variable, having a degree, qualifications higher than 'A' level and qualifications of at least 'A' level standard. Table 12 collects together the arithmetic measures of consistency with both sufficiency and necessity for the set theoretic equation PMT_DESTINATION = HQUAL, with HQUAL taken over the three levels, in both the modelled and the empirical worlds.
5.3 We begin with the real world findings (the red numbers in Table 12). There is a consistent pattern with respect to the necessity of having each level of qualification as we move from the NCDS to the BCS cohort. For each level, the index of consistency with a relation of necessity for each level of qualification (equivalent to explanatory coverage in this simple case) moves nearer to 1.00. Using a percentage change measure, the rate of change is greatest for the highest level of qualification[12]. It might be thought that such a tightening of the relationship of quasi-necessity between qualifications and destinations reflects an underlying change in the degree of meritocracy across the cohorts. In fact, an examination of the indices for the modelled worlds shows that, given the marginals for qualifications and destinations, a very similar pattern of changes would have been expected if meritocratic allocation, as defined in the model, had operated to exactly the same degree in the two cohorts, all else being equal. More precisely, in the two cases where change has occurred in the modelled worlds, those of having a degree or having a qualification greater than 'A' level, we have respectively, modelled and empirical change measures of 58.33% versus 61.48%, and 11.69% versus 12.87%. In summary, on the basis of the analysis so far, in so far as the higher levels of qualifications became more necessary for access to the PMT class destinations in the empirical worlds over time, this seems to be explicable in terms of a change in the relationship between the distributions of qualifications and destination positions rather than any change in the degree of meritocracy operating in the two cohorts.
5.4 Turning to sufficiency, the picture is more complicated. Ignoring the question of whether the nature and value of membership in the PMT class has changed over this nine year period, we can note that, empirically, the value of the two highest qualification levels has been maintained. In fact, in each case the relation between the condition of highest qualification and the outcome of a PMT class destination has moved very slightly nearer to strict sufficiency (for degrees, from 0.776 to 0.807; for other higher qualifications, from 0.706 to 0.714). On the other hand, the value of the lowest of the three levels of qualification in the table has declined, with the relation here moving very slightly further away from strict sufficiency (0.585 to 0.567). All of these changes are, however, small enough to be due to errors of measurement and sampling. As we found for necessity, the pattern of empirical changes is similar in structure to that for the modelled worlds. It is worth noting, however, that the model would have predicted a greater move away from strict sufficiency for the lowest of the three levels of qualification in the table (-12.80% for the model versus the empirical -3.08%). This discrepancy points us towards countervailing ascriptive factors that might be operating, some of which we explore in the next section.
5.5 We have compared, across the modelled and empirical worlds, the inter-cohort changes in consistency with the sufficiency and necessity of the relationship between highest qualification and a PMT class destination. There is also the simpler question to consider of the intra-cohort comparisons of the model with the reality. Looking at the relation of reaching the PMT class to having a qualification better than 'A' level as an example, we can see that the model indicated that, in a meritocratic world, we should expect this level of qualification to be sufficient for reaching the PMT class in both cohorts, and to be not that far away, especially in the second cohort, from being a necessary condition. In fact, in the empirical world, each of the four relevant consistency measures is about 70% of the comparable modelled value. We have a substantial discrepancy between the modelled meritocratic world and the partially meritocratic empirical world to address.
Accounting for the Modelled Worlds / Real Worlds Discrepancies: Sufficiency
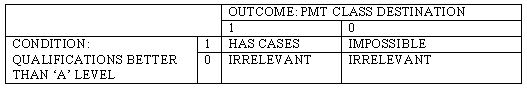
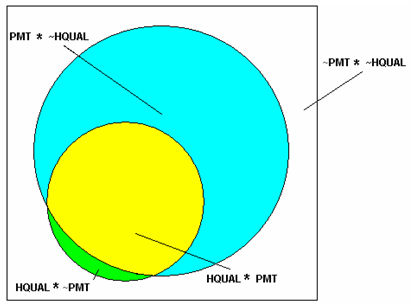
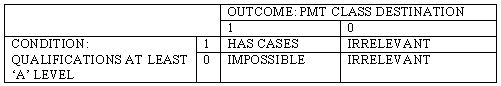
6.1 Consider the case of perfect sufficiency for the relationship between having qualifications higher than 'A' level and a PMT class destination (Table 13). The modelled meritocratic worlds have no cases in just the cell marked impossible, reflecting the fact that, in these worlds, this level of qualification was strictly sufficient for reaching the PMT class. In the empirical worlds, however, there were cases in this cell, reflecting the less than perfect consistency with the relation of sufficiency in the real world. This suggests that, in order to account for the discrepancy between the modelled worlds and the empirical worlds at least with respect to sufficiency we should aim to explain these cases and, in particular, what it is that accounts for their being in this cell. A key question is whether membership in the 'impossible' cell in the empirical world is associated with membership of causal configurations including such ascriptive factors as class origin and gender. If we consider the Venn representation of the empirical case (Figure 5), using PMT to represent a PMT class destination and HQUAL to represent the highest qualification entered into an analysis, then we can see that the green subset is the 'impossible' cell from Table 13. It is the subset that contradicts the subset relation required by strict sufficiency (i.e. that the condition be a subset of the outcome). We wish to explore whether configurations containing some particular ascriptive factors alongside the factor of HQUAL are especially likely to contribute cases to this green subset.
|
| Table 13. Strict sufficiency of having above 'A' level qualifications for a PMT class destination |
|
| Figure 5. Imperfect Sufficiency (where blue and yellow mark the outcome, a PMT class destination, and ~ indicates negation) |
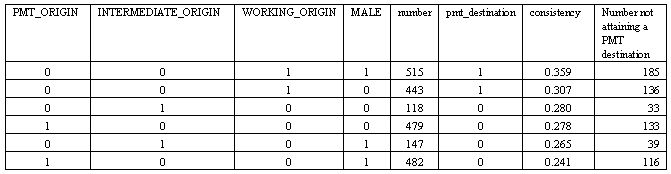
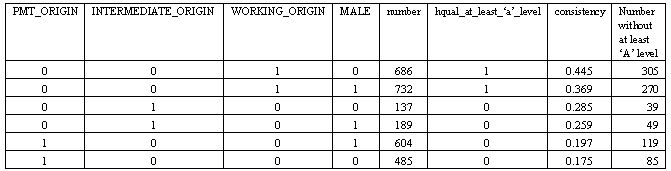
6.2 We therefore now introduce the key ascriptive factors of class origin and gender to explore which causal configurations involving particular categories of these factors, amongst those with qualifications better than 'A' level, are most likely, relatively speaking, to contribute cases to the 'impossible' cell in Table 13. Table 14, generated by the fs/QCA software, but just for cases where highest qualification (HQUAL) is better than 'A' level, is the truth table for the Boolean model:
pmt_destination = PMT_ORIGIN + WORKING_ORIGIN + MALEwhere the outcome, pmt_destination, refers to the negation of PMT class membership.
6.3 This model includes two dummy factors to take account of the three categories of social class origin, allowing membership of the origin class INTERMEDIATE_ORIGIN to be included in the configurational analysis. We have added a column indicating the number of cases for each of the configurations who do not attain PMT class membership.
6.4 If we were to create a weighted mean of consistency (with sufficiency) for these six rows, the figure we would obtain (0.294) would be 1.000 minus the associated 0.706 appearing in Table 12 for attaining PMT class membership. However, we intend here to compare the relevant outcome not attaining PMT class membership for these configurations irrespective of the number of cases in each of them[13]. This may seem paradoxical, given that the configurations contribute differentially to filling the 'impossible' cell. However, given our concern with the degree of meritocratic allocation in this empirical world, we want to examine the relative chances of cases with particular logical combinations of features of ending up in this cell. For this reason, we will take the simple unweighted mean (0.288) of the consistency levels of the six rows as a benchmark to employ in our Boolean analysis[14]. We are effectively creating a new crisp set to use as an outcome set. Configurations with higher than this average proportional chance of contributing members to the 'discrepancy' subset are in this set while the remainder, with lower than average chances, are out of it. We have entered 1s and 0s in Table 14 (and any following similar tables) to indicate this.
6.5 Two rows fall above this benchmark and four below. The two above the benchmark, those more likely than others to end up in the 'impossible' cell are:
- WORKING_ORIGIN*MALE
- WORKING_ORIGIN*male
- INTERMEDIATE_ORIGIN*male
- PMT_ORIGIN*male
- INTERMEDIATE_ORIGIN*MALE
- PMT_ORIGIN*MALE
6.6 These four configurations can be simplified to working_origin, i.e. not being of working class origin. For the NCDS cohort, it is the ascriptive factor of working class origin that operates most strongly here, within the set of those with the relevant qualification, to increase the likelihood of an individual's outcome contradicting the relation of perfect sufficiency we constructed in the modelled world. If we were to push the conjunctural analysis further, paying attention to the difference between the first two rows, we would find some evidence of interaction between class origin and gender.
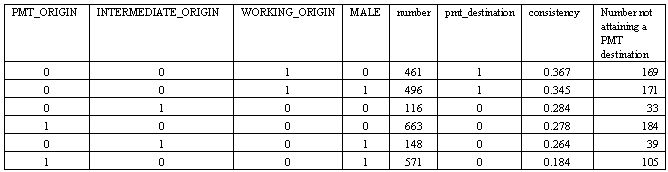
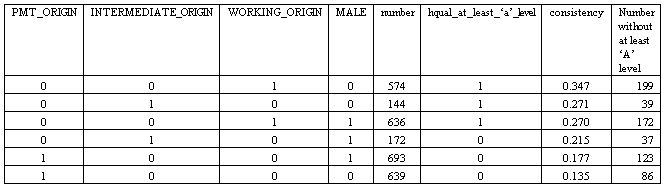
6.7 Turning to the BCS cohort (Table 15), and undertaking the same exercise, using the corresponding benchmark of 0.287, we obtain the same result in relation to class. We might also note that the consistency figures for these six configurations are broadly similar across the two cohorts. We can, however, note two important changes between the cohorts. First, if we take the configuration from each cohort that has the highest likelihood of contributing cases to the 'impossible' cell, it is WORKING_ORIGIN*MALE for the NCDS, but WORKING_ORIGIN*male for the BCS. Furthermore, the relevant intra-cohort gender difference in consistency for these working class cases is higher in the NCDS than in the BCS[15]. Second, there is a substantial drop between the cohorts in the consistency figure for males of a PMT class origin. They become considerably less likely to contribute to the "impossible" cell.
|
| Table 14. pmt_destination= PMT_ORIGIN + INTERMEDIATE_ORIGIN + WORKING_ORIGIN + MALE (just for NCDS cases with HQUAL_BETTER_THAN_'A'_LEVEL =1) |
|
| Table 15. pmt_destination= PMT_ORIGIN + INTERMEDIATE_ORIGIN + WORKING_ORIGIN + MALE (just for BCS cases with HQUAL_BETTER_THAN_'A'_LEVEL =1) |
Accounting for the Modelled Worlds / Real Worlds Discrepancies: Necessity
7.1 In the case of the necessity relation between reaching a PMT class destination and having at least 'A' level qualifications we need to apply a parallel argument to that we used for sufficiency. Here the cell marked impossible in Table 16, which has no cases in the modelled worlds but has cases in the empirical worlds, is the one we need to address. If we consider the Venn representation of the empirical case of a less than perfect relation of necessity (Figure 6, where the blue circle now represents the condition set, HQUAL), then we can see that the green subset is the 'impossible' cell from Table 16. It is the subset that contradicts the subset relation required by strict necessity (i.e. that the outcome be a subset of the condition). Again, as we did in the case of sufficiency, we wish to explain what it is in configurational terms that results in some cases with a PMT class destination (PMT) being in the green subset rather than the yellow one, i.e. not having the quasi-necessary condition of HQUAL of at least 'A' level. We will, effectively, be examining factors that, in the actual world, appear to have acted, either alone or conjuncturally, as substitutes for what was a single necessary condition in the counterfactual world.
|
| Table 16. Strict necessity for reaching a PMT class destination of having qualifications of at least 'A' level |
|
| Figure 6. Imperfect Necessity (where blue and yellow mark the condition, HQUAL, and PMT indicates class destination, and ~ indicates negation) |
7.2 Here, in analysing the empirical data, we need to look down the PMT CLASS DESTINATION=1 column of Table 16 and consider a model that 'explains' being in the 'impossible' cell. Here is a relevant Boolean model, just for cases with a PMT class destination, again using dummy factors to cover class origin:
hqual_at_least_'a'_level = PMT_ORIGIN + WORKING_ORIGIN + MALE
7.3 This, of course, has an unusual appearance, since we have an empirical condition (not having this level of qualification) rather than an outcome on the left hand side and several empirical conditions on the right hand side. However, since we wish to examine, amongst those who have reached a PMT class destination, the relative chances of various configurations of class origin and gender not having this prior level of qualification, it does appear to have the logical form that we require. Effectively, in order to answer a question about necessity, we are going to present, just for those who reached the PMT class, a logical analysis of the sufficiency of the terms on the right hand side for predicting the 'outcome' (i.e. not having had this level of qualification) on the left[16]. We should stress this is a logical test, and that we are not suggesting that causation is running backwards!
7.4 Proceeding as before, we examine the configurations, just for those with a PMT class destination, that are associated with the 'outcome' hqual_at_least_'a'_level and examine which of these fall, respectively, above and below the unweighted average of the consistencies for the relevant six rows of the truth tables. For the NCDS, we have, above the mean of 0.288, being of working class origin and, below the mean, not being of working class origin (Table 17). Here, configurations are more likely, relatively speaking, to contribute cases to the 'impossible' cell if they include a working class background. For the BCS, where the unweighted mean is 0.236, the pattern is slightly different (Table 18). Here being of working class origin OR being of intermediate origin and female fall above the cut, and being of PMT class origin OR of intermediate origin and male fall below it[17].
7.5 It is individuals from lower down the social hierarchy who are more likely, relatively speaking, to enter the 'impossible' cell in the necessary conditions table, and, given the numerical distribution of cases across configurations, they also happen to be the ones accounting for most of the absolute discrepancy between the modelled and the empirical worlds in respect of the necessity of this level of qualification for a PMT class outcome. It seems that, in these cohorts, amongst those who had attained a PMT class position, individuals from working class origins (especially if female) were more likely to have attained the position by a route not linked to at least 'A' level qualifications. It is therefore worth noting the quite substantial drops between the two cohorts in the consistency figures for these six configurations. The figures for WORKING_ORIGIN*male drop, for example, from 0.445 to 0.347, reflecting the general shift in Table 12 towards the increasing necessity of at least 'A' level qualifications for achieving a PMT class destination.
|
| Table 17. hqual_at_least_'a'_level= PMT_ORIGIN + INTERMEDIATE_ORIGIN + WORKING_ORIGIN + MALE (just for NCDS cases with PMT_DESTINATION=1) |
|
| Table 18. hqual_at_least_'a'_level= PMT_ORIGIN + INTERMEDIATE_ORIGIN + WORKING_ORIGIN + MALE (just for BCS cases with PMT_DESTINATION=1) |
Conclusion
8.1 Breen & Goldthorpe (2001) have previously employed these cohorts to assess changes in the degree of meritocracy over time, but using data collected at earlier points in the respondents' lives than we have here. Their focus was on the extent to which meritocratic factors, including educational achievement in the form of qualifications, mediated the association between class origin and class destination within these cohorts. Our focus has been different, and narrower, in that we have considered just the question of changes in the extent to which qualifications account for a PMT class destination. We have, however, worked, as they did, on the assumption that questions concerning meritocracy are most fruitfully addressed by considering changes in the relevant relationships over time.8.2 We have used set theoretic methods, privileging a configurational approach to the study of causation and/or association. However, rather than simply comparing the results of relevant configurational analyses between the NCDS and the BCS cohorts we have, because of the problems posed in this area by unequal rates of change in the marginal distributions of achieved qualifications and available class positions over time, chosen to begin our work by creating for each cohort a counterfactual and strictly meritocratic distribution of class destinations according to highest qualifications achieved. These distributions are derived from the actual distributions of qualifications and destinations by applying a meritocratic queuing rule. The results of this modelling exercise have been analysed in terms of the necessary and sufficient conditions for achieving PMT class positions, and this analysis provided us with benchmarks against which to view our subsequent analyses of the empirical distributions.
8.3 Our comparison of the modelled results and the empirical results suggested that, in so far as there have been empirical changes in the necessary and sufficient conditions for achieving PMT class positions, these mirror in their overall pattern the changes that would have occurred had a strictly meritocratic allocation procedure been in operation in both the cohorts, given the empirical marginal distributions of qualifications and destinations. This is not, we should note, the same as saying that the allocation procedures were fully meritocratic in both cohorts, only that the comparison of the modelled with the real world shows no evidence, once the marginals are controlled for, of a change in the degree of meritocratic allocation. In fact, we found a substantial discrepancy between the counterfactual meritocratic worlds and the real worlds. Many cases failed to reach the PMT class in spite of having the qualifications that the model showed would be sufficient in a meritocratic world. Other cases found themselves in the PMT class in spite of lacking the qualifications that the model showed would have been necessary in a meritocratic world. The key point is that the discrepancies were similarly structured for both cohorts. These results are broadly similar to those of Breen and Goldthorpe for the respondents' earlier careers.
8.4 We then used set theoretic reasoning and analysis to explore the nature of the modelled/real discrepancies, with respect to both sufficiency and necessity. First, we looked at sufficiency, and by introducing class origin and gender into our set theoretic models, we compared the relative contributions of various causal configurations to populating, in the empirical world, the 'impossible' cell that, in the modelled world showing qualifications better than 'A' level to be sufficient for reaching the PMT class, was empty of cases. Here we found, in line with the results of earlier work (Breen & Goldthorpe, 2001), that class origin was the key factor in partitioning configurations into being higher and lower contributors to the 'impossible' cells. In the NCDS it was the working class, and working class males in particular, who were most likely to contribute to this cell, i.e. who were most likely, in spite of having this level of qualification, not to have reached the PMT class. In the BCS, it was again those of working class origin who were most likely to contribute to this cell, but here females were slightly ahead of males[18].
8.5 The comparable analysis of the modelled/real discrepancy with respect to necessity is more challenging conceptually. Again, having identified the 'impossible' cell here those gaining PMT class positions without having the model-derived necessary condition of qualifications of at least 'A' level we compared the relative contributions of configurations conjoining ascriptive factors to this 'impossible' cell in the empirical world. We found that, in the NCDS, those of working class origin were relatively more likely to contribute to the 'impossible' cell, i.e. were relatively more likely to be in the PMT class without the model-derived necessary condition of at least 'A' level qualifications[19]. In the BCS, we found that intermediate origin females joined the working class as key relative contributors.
8.6 The methods we have used are currently unconventional ones in this field. In this and other work we are undertaking we are still exploring their strengths and weaknesses (Cooper & Glaesser, 2008). In this particular case, we believe they have shown themselves, as part of our approach of using necessary and sufficient condition analyses in conjunction with the construction of benchmarks in modelled worlds, to be a useful way of analysing the question of meritocratic access to PMT class positions in Britain. In this paper we have used crisp sets. We are currently intending to consider how we might usefully apply fuzzy set methods to the topics considered here. These methods, which we have already employed in analysing the achievement of qualifications (Cooper 2005, 2006; Cooper & Glaesser, 2007) might allow us to analyse, in a set theoretic manner, finer details of the relationships we have explored here. In particular, these methods should allow us to explore more than one particular class outcome in an efficient manner.
Notes
1We recognise, of course, that regression analyses with interaction terms and multi-level modelling offer established approaches to analysing contextualised causation. They do not, however, present their results in the Boolean language of necessary and sufficient conditions (Cooper and Glaesser, 2008). Interaction effects can also be difficult to interpret in complex models. For an interesting recent attempt to use regression to assess causation and/or association in a Boolean manner, see Clark et al. (2006). For papers debating the relative merits of the set theoretic and regression approaches, see the special issues of Qualitative Methods: Newsletter of the American Political Science Association Organized Section on Qualitative Methods in 2004 (Vol. 2, No. 2), Sociological Methods and Research in 2005 (Vol. 33, No. 4), and Political Analysis in 2006 (Vol. 14, No. 3).2We will assume, for the sake of this paper, that the class destination categories (see Table 4) are ordered. Clearly, this assumption can be challenged, especially in respect of class III non-manual in relation to class III manual. In so far as we focus in this paper on the boundary between classes I and II and the rest this will not become an important issue.
3We should note that this is not a perfectly suitable measure for our purposes since some of the qualifications will have been gained after entry to the PMT class. Considering, for example, the NCDS, we have a choice of a 'highest qualification' measure taken at age 23 or age 33. We consider that age 23 is too young to pick up enough of the qualifications achieved by the sample prior to their class destination at age 33, hence our choice of highest qualification at age 33, notwithstanding this leaves something to be desired.
4Although the latest data available for the NCDS sample are from the 1999/2000 sweep, we use the 1991 sweep for the information on highest qualification obtained and social class destination because this enables us to draw comparisons with the BCS70 respondents at a similar age. The variables we use for the NCDS sample are n1687 for father's social class when respondent was aged 11, n920 for ability, hqual33 (a derived variable based on information collected in 1991 on all qualifications) and n540078 for social class of present or last occupation. The variables used with the BCS70 sample are c3.4 for father's social class when respondent was aged 10, score20 for ability and hqual30 (again, a derived variable, based on information collected in the 1999/2000 follow-up survey and supplemented by information from the 1996 sweep in cases where the highest level of qualification given then was higher). The variable for the social class of the respondent at age 30 for the BCS, SC, refers only to the current occupation, unlike the analogous one for the NCDS sample which gives the current or last occupation. In order to make the two cohorts as comparable as possible, and also to reduce the number of missing cases, we have used information on occupation from the 1996 sweep (rgsc91) to replace missing values on the 1999/2000 SC variable.
5During this period in Britain, there existed a range of academic qualifications. The CSE was the Certificate of Secondary Education, a qualification taken at ages 15/16 that was of a lower level than Ordinary level ('O' level, also taken at ages 15/16) but whose highest grade counted as an 'O' level pass. Advanced level courses ('A' level, taken two years after 'O' level) were a higher level qualification than 'O' level, and were preparatory for university entrance. The NVQ(i) refer to (officially) equivalent National Vocational Qualification levels. The 'O' level examination had replaced the School Certificate at the beginning of the 1950s. Taken at age 16, it played a key selective role in allowing further academic study after this age.
6From the fs/QCA manual (Ragin et al., 2006): Instead of using absolute standards, the researcher can make inferences about necessity and sufficiency using probabilistic methods. The different benchmark values can be translated using linguistic qualifiers into: more often than not (.5), usually (.65), almost always (.80). We are aware that some readers will be unhappy with the verbal labelling of 0.80 as 'almost always' or 'nearly always sufficient', etc. Alternative ways of viewing this are to regard the use of a 0.80 threshold as indicating that the 'causal' conditions are sufficient either (i) to raise the probability, ceteris paribus, of the outcome for an individual to 0.80 or more or (ii) to raise the proportion of the cases comprising a configuration that achieves the outcome to this level, again ceteris paribus.
7Crisp sets are those in which a case can simply be in or out of a set (for example, the set of Protestants).
8It is possible at this stage to decide that the number of cases for some configurations is too low to provide reliable evidence. On how to deal with such rows, see Ragin (2005). On the use of statistical criteria, see Ragin (2000) and Smithson and Verkuilen (2006). For some discussion of the use of statistical significance testing in conjunction with set theoretic analysis of these data, see Cooper (2005).
9It might be worth pointing out here for those who are sceptical about such threshold setting that the use of arbitrary levels of statistical significance (and often in contexts where the conditions for their use are not even met) plays a similar role in regression based approaches. For a recent discussion of the role of judgement in quantitative analyses, see Gorard (2006).
10We have these four rows (re PMT_ORIGIN, HQUAL_DEGREE, and being MALE) going forward: 111, 011, 110, and 010. The first two can be reduced to -11 where the dash indicates the factor makes no difference (at our chosen threshold level). The latter two can be reduced to -10. Then -11 and -10 can be reduced to -1-, i.e. having a degree.
11The method employed here does not aim to determine the net effects of each factor, but is rather based on the assumption that causes operate conjuncturally, i.e. their effects vary according to the context of other factors they find themselves conjoined with (Ragin 1987, 2006b).
12However, it must be noted that these change measures may be differentially affected by ceiling effects. An initial figure of 0.77 can only rise to a maximum of 1.00, giving a maximum percentage increase of approximately 30 percent, but an initial figure of 0.36 can, in principle, in rising to its maximum of 1.00, undergo a percentage change of approximately 178 percent.
13In saying this we have assumed that a sample size of 118 is an adequate basis for entering the least numerically represented configuration into the analysis.
14We are effectively assuming here that any other factors operating are randomly related to those in this model. This is likely to be only partially true.
15The differences here between males and females in the NCDS do not appear to be due to ability. Within the NCDS, the overall mean for all the cases in the cohort who took the ability tests at the end of primary schooling is 42.94 (with s.d.=16.15). Within the configuration WORKING_ORIGIN*HQUAL_BETTER_THAN_'A'_LEVEL, males have a mean ability of 50.96, and females 51.63. The difference is not statistically significant. Within the BCS, where the overall mean for all the cases who took the ability tests is 100 (with s.d.=15), the comparable scores are 105.54 and 104.77 (a non significant difference).
16Some readers may be wondering why we don't simply use the 'coverage' figures for each configuration with HQUAL_AT_LEAST_'A'_LEVEL = 0 from the model PMT_DESTINATION = PMT_ORIGIN + WORKING_ORIGIN + MALE + HQUAL_AT_LEAST_'A'_LEVEL. Our view is that these indices, in so far as they assess the absolute contribution of each configuration (Ragin 2006a) to the outcome are not the appropriate ones, given our focus on the extent of apparently meritocratic allocation.
17As in the discrepancy analysis in the sufficiency case, the two cohorts are similarly patterned across the tables. We should perhaps note that, in the NCDS table, intermediate origin females, at 0.285, are very close to the cut-off point of 0.288. Given the relatively small sample size for this group, it is possible that, without sampling and measurement error, this configuration would pass the threshold. However, we would note that there is a large gap between the threshold and the next higher consistency figure of 0.369.
18We should note that the NCDS cohort have had a little longer than the BCS cohort to achieve PMT positions.
19There may be selection effects operating here, given that earlier configurational analyses of these data showed that higher class origins conjoined with higher ability were associated with higher levels of achieved qualifications (Cooper 2005, 2006). Able but less well qualified working class cases may have been more likely to find alternative routes to the PMT class than those assumed in the counterfactual model of necessary qualifications.
References
COOPER B. (2005) Applying Ragin's crisp and fuzzy set QCA to large datasets: social class and educational achievement in the National Child Development Study. Sociological Research Online. Vol 10, Issue 2 http://www.socresonline.org.uk/10/2/cooper.htmlCOOPER B. (2006) Using Ragin's Qualitative Comparative Analysis with longitudinal datasets to explore the degree of meritocracy characterising educational achievement in Britain. Paper presented to the Sociology of Education SIG at the Annual Meeting of the American Educational Research Association, San Francisco.
COOPER B. and Glaesser, J. (2007) Exploring Social Class Compositional Effects on Educational Achievement with Fuzzy Set Methods: A British Study. Paper presented to the Sociology of Education SIG at the Annual Meeting of the American Educational Research Association, Chicago.
COOPER B. and Glaesser, J. (2008) Exploring alternatives to the regression analysis of quantitative survey data in education: what does the configurational approach have to offer? Paper presented at the Annual Meeting of the American Educational Research Association, New York.
BOND, R. and SAUNDERS, P. (1999) 'Routes of success: influences on the occupational attainment of young British males', British Journal of Sociology, Vol. 50, No. 2, pp. 217-249.
BOUDON, R. (1974a) Education, Opportunity and Social Inequality. New York: Wiley-Interscience.
BOUDON, R. (1974b) The logic of sociological explanation. Harmondsworth: Penguin.
BOUDON, R. (1977) 'Education and social mobility: a structural model', in J. Karabel and A.H. Halsey (editors) Power and Ideology in Education. Oxford: Oxford University Press.
BREEN, R. and GOLDTHORPE, J.H. (1999) 'Class inequality and meritocracy: a critique of Saunders and an alternative analysis', British Journal of Sociology, Vol. 50, No. 1, pp. 1-27.
BREEN, R. and GOLDTHORPE, J.H. (2001) 'Class, mobility and merit: the experience of two British birth cohorts', European Sociological Review, Vol. 17, No. 2, pp. 81-101.
BREEN, R. and GOLDTHORPE, J.H. (2002) 'Merit, mobility and method: another reply to Saunders', British Journal of Sociology, Vol. 53, No. 4, pp. 575-582.
BYNNER, J. and JOSHI, H. (2002) 'Equality and opportunity in education: evidence from the 1958 and the 1970 birth cohorts', Oxford Review of Education, Vol. 28, No. 4, pp. 405-425.
CLARK, R.C., GILLIGAN, M.J. AND GOLDER, M. (2006) 'A simple multivariate test for asymmetric hypotheses', Political Analysis. Vol. 14, No. 3, pp. 311-331.
GORARD, S. (2006) 'Towards a judgement-based statistical analysis', British Journal of Sociology of Education, Vol. 27, No. 1 , pp. 67-80.
HAUSER, R.M. (1976) 'On Boudon's Model of Social Mobility', The American Journal of Sociology, Vol. 81, No, 4, pp. 911-928.
LAMPARD, R. (1996) 'Might Britain be a meritocracy? A comment on Saunders', Sociology, Vol. 30, No. 2, pp. 387-393.
MAHONEY, J. (2001) 'Beyond Correlational Analysis: Recent Innovations in Theory and Method', Sociological Forum, Vol. 16, No. 3, pp. 575-593.
MAHONEY, J. and GOERTZ, G. (2006) 'A tale of two cultures: contrasting quantitative and qualitative research', Political Analysis, Vol. 14, No. 3, pp. 227-249.
MARSHALL, G. and SWIFT, A. (1993) 'Social class and social justice', British Journal of Sociology, Vol. 44, No. 2, pp. 187-211.
MARSHALL, G. and SWIFT, A. (1996) 'Merit and mobility: a reply to Peter Saunders', Sociology, Vol. 30, No. 2, pp. 375-386.
MÜLLER, W. (1998) Erwartete und unerwartete Folgen der Bildungsexpansion', ('Expected and unexpected consequences of educational expansion') in: Friedrichs, J., Mayer, K.-U. and Schluchter, W. (Eds.) Die Diagnosefähigkeit der Soziologie. (KZfSS, Sonderheft 38, pp. 81-112).
PRANDY, K. (1999) 'Class, stratification and inequalities in health: a comparison of the Registrar-General's Social Classes and the Cambridge Scale', Sociology of Health & Illness, Vol. 21, No. 4, pp. 466484.
QUINE, W.V. (1952) 'The problem of simplifying truth functions', American Mathematical Monthly, Vol. 59, No. 8, pp. 521-531.
RAGIN, C.C. (1987) The comparative method. Berkeley & Los Angeles: California University Press.
RAGIN, C.C. (2000) Fuzzy set social science. Chicago: Chicago University Press.
RAGIN, C.C. (2005) 'From fuzzy sets to crisp truth tables', http://www.compasss.org/Raginfztt_April05.pdf
RAGIN, C.C. (2006a) 'Set relations in social research: evaluating their consistency and coverage', Political Analysis, Vol. 14, No. 3, pp. 291-310.
RAGIN, C.C. (2006b) 'The limitations of net effects thinking', in B. Rihoux and H. Grimm (editors) Innovative Comparative Methods for Political Analysis, New York: Springer.
RAGIN, C.C., RUBINSON, C, SCHAEFER, D., ANDERSON, S., WILLIAMS, E. and GIESEL, H. (2006) User's Guide to Fuzzy-Set/Qualitative Comparative Analysis 2.0. Tucson, Arizona: Department of Sociology, University of Arizona.
SAUNDERS, P. (1995) 'Might Britain be a meritocracy?' Sociology, Vol. 29, No. 1, pp. 23-41.
SAUNDERS, P. (1996) Unequal but fair? A study of class barriers in Britain. London: Institute of Economic Affairs.
SAUNDERS, P. (1997) 'Social mobility in Britain: an empirical evaluation of two competing explanations', Sociology, Vol. 31, No. 2, pp. 261-288.
SAUNDERS, P. (2002) 'Reflections on the meritocracy debate in Britain: a response to Richard Breen and John Goldthorpe', British Journal of Sociology, Vol. 53, No. 4, pp. 559-574.
SAVAGE, M. and EGERTON, M. (1997) 'Social mobility, individual ability and the inheritance of class inequality', Sociology, Vol. 31, No. 4, pp. 645-672.
SMITHSON, M.J. and VERKUILEN, J. (2006) Fuzzy Set Theory: Applications in the Social Sciences. Thousand Oaks: Sage.
THUROW, L.C. (1972) 'Education and Economic Equality', The Public Interest, Vol. 28, Summer, pp. 66-81.
YOUNG, M. (1958) The Rise of the Meritocracy. Harmondsworth: Penguin.