Environmental Injustice or Just the Lie of the Land: an Investigation of the Socio-Economic Class of Those at Risk from Flooding in England and Wales
by Jane Fielding
University of Surrey
Sociological Research Online 12(4)4
<http://www.socresonline.org.uk/12/4/4.html>
doi:10.5153/sro.1570
Received: 13 Mar 2007 Accepted: 3 Jul 2007 Published: 31 Jul 2007
Abstract
An outcome-based analysis using surface population models and logistic regression analysis shows that significant inequalities exist between the middle and working classes, and also between the middle classes and the inactive (the unemployed and unclassifiable classes, not the retired), in risk factors associated with flood emergencies in all Environment Agency Regions of England and Wales except the Midlands region. This analysis demonstrates overall inequality is reproduced in both the fluvial and tidal flood plains, although that within the tidal flood plains is especially significant and more pronounced in some areas, especially, in the Eastern regions of England. The paper then discusses whether this inequality is unjust or discriminatory, and considers that further, more process-driven, analysis would be necessary to explore this issue, especially looking at neighbourhood generation processes with respect to migration into and out of areas.
Keywords: Environmental Justice; Environmental Inequality; Natural Disaster; Environmental Risks; Surface Population Models
History of environmental justice research
1.1 The academic concepts of environmental justice and environmental inequality originated in the United States in the early 1980s when grassroots campaigning, linked with civil rights, was concerned about the location of waste sites and heavy industries in areas predominantly populated by ethnic minorities. This movement and other drivers, such as concern about climate change and the integration of social and environmental factors in the sustainable development agenda resulted in the drawing up of US Executive Order 12898 in 1994. This order required all federal US agencies to develop strategies to combat any evidence of environmental injustice or environmental racism. Environmental justice has been defined by the US Environmental Protection Agency as the fair treatment and meaningful involvement of all people regardless of colour, race, national origin or income with respect to the development, implementation, and enforcement of environmental laws and regulations (US Environmental Protection AgencyEPA 1998 ).1.2 In the UK, the issue of environmental justice was slower to develop, but NGO activists such as the Friends of the Earth have long campaigned for environmental justice, especially in the location of polluting factories. Their research identified a relationship between polluting industrial sites and low income communities in England and Wales (FoE 1999;FoE 2001). Other research in the UK, especially in relation to the unequal distribution of environmental health impacts (Acheson, Chambers et al. 1998; Stephenson, Stephens et al. 1998), but also in relation to ethnicity and poverty (Walker et al. 2000; Tapsell et al. 2002) has been influential in defining the environmental justice agenda. A comprehensive summary of evidence on environmental justice in the UK, collected by the ESRC Global Environmental Change Programme and other academics and civic groups, has highlighted the need for further research in this area and also the importance for policy-makers to take into consideration social justice dimensions during the development of environmental policy (ESRC 2001).
Approaches to environmental justice research
2.1 Environmental justice research has come to distinguish between two main approaches to analysis. Much of the original research and grassroots campaigns concentrated on the physical proximity of environmental hazards and disadvantaged sections of society, but more recently attention has also been turned to the origins of such inequalities (Talih and Fricker, 2002). Talih and Fricker describe the first approach, the association of demographics and environmental hazard, as outcome-based and the second approach, exploring the origins of the associations, as process-based. The second approach takes into account community formation and neighbourhood change in explaining environmental inequality and does not necessarily assume that the community is disproportionately affected because it is a minority community. However, the first approach identifies potentially vulnerable communities and individuals and although their proximity to hazard may not be due to overt discrimination, the social characteristics of the at-risk population are of vital importance, not only in hazard management planning but also as part of any social justice agenda.2.2 While it could be argued that both approaches to inequality analysis should be used in tandem to provide a complete picture of any underlying mechanisms of social inequality, this paper concentrates on the value of an initial outcome-based analysis to identify the structure of any inequalities amongst residents living within the flood plains of England and Wales.
Hazards, risk and vulnerability
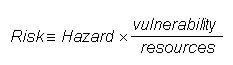
3.1 Conventionally in the disaster literature, risk is seen as a function of the physical, social, economic and environmental factors which increase the susceptibility of a community or individual to the impact of hazards, both natural and human-induced (ISDR 2004, Blaikie et al.1994, Wisner et al. 2004). At the micro-level, this may be represented by the following:
|
3.2 There are two components to consider. Firstly, there is the nature and likelihood of exposure to the hazard which may be seen as the 'vulnerability of place'. In this context, the hazard, which may be natural (earthquake, flood) or human-induced (pollution, melt-down in a nuclear plant), is defined as a potentially damaging physical event which may lead to loss of life or disruption of social or economic life or environmental damage. And secondly, there are the characteristics of the affected populations and their ability to recover from such a hazard - the 'vulnerability of the population' mitigated by their resources and capacities, which may be physical, financial or psychological, to pull through in the face of disaster. Furthermore, a disaster may be considered to occur when the numbers of people affected, and the impact on everyday life, physical, structural and financial, is of such a magnitude that they are unlikely to be able to recover without external aid.
3.3 In this paper, we are considering the extent of the vulnerability of place defined by the Environment Agency flood maps and just one of the characteristics (social class) of the 'at risk' or vulnerable populations, who may inhabit those risky places. However, the selection of just one population characteristic does not preclude the importance of other factors such as gender and age among many other competing factors, which may mitigate against actual risk, or, perhaps more importantly, the perception of risk, and will be discussed in more detail below.
3.4 At this point it is worth further exploring the meaning and conceptualisation of 'vulnerability' in this context. Vulnerability is a multi-faceted and dynamic concept, determined not simply by personal and demographic characteristics but also by social, political, cultural and economic conditions. One useful way of thinking about vulnerability to flood is in terms of emic and etic approaches (Spiers 2000). These concepts, borrowed and re-interpreted from the linguistic and anthropological literature can be understood to refer to two complementary perspectives: the etic perspective can be interpreted as being an "outsider" view; the emic as being an "insider" one. The etic viewpoint imposes a definition of "vulnerability" on individuals defined as 'at risk' on the basis of various demographic characteristics. Relevant characteristics in this context would be those which increase social dependence: i.e. old age; ill-health and disability; poverty. Within the etic perspective, the method most commonly used to identify group vulnerability is a quantitative one and is often the method of choice used to inform public policy. This methodology is not without criticism however. Individuals often have to promote themselves as "members" of a such a vulnerable group in order to attract aid, and in so doing become stereotyped based on the defining functional deficit. Thus people may become labelled as "vulnerable". Concomitantly, areas may become known as "no-go areas" or crime "hot spots". In addition, it is important to emphasise that 'vulnerable groups' are not necessarily homogeneous; just as groups are heterogeneous, so too are households. Most people will experience and respond to a hazard event as a member of a household, yet not all members of the household will experience it in the same way; women and children, for example, will often bear the brunt of the hazard experience (Fordham, 1998).
3.5 In contrast, the emic perspective seeks to identify vulnerability on the basis of meanings held by individuals arising from their lived experience and tends to be aligned with qualitative methodology. Emic vulnerability is founded on the individual's sense of their own resilience and ability to respond in the face of a flood, or indeed on the resilience and ability of the family or community. Vulnerability is thus defined by the people directly involved rather than being defined in terms of disadvantaging socio-economic characteristics. Some of those who would be seen as vulnerable from an etic viewpoint may not consider themselves to be so, and vice-versa. The emic perspective, therefore, conceptualizes vulnerability as a dynamic rather than a static categorization. It emphasizes the necessity for individuals to identify themselves as being 'at risk' before they are able to prepare effectively for any potential emergency. People may be knowledgeable about flood risk in general terms yet remain unaware that their own property may be 'at risk'. Indeed, there is evidence to suggest that many residents of floodplains within England and Wales fail to accept that they live in a flood-risk area (Burningham et al in press, Fielding et al 2007), a mistaken belief that all too often results in little or no suitable preparation for, or response to, an emergency and is of considerable concern to emergency managers.
Extending environmental inequality to natural hazards
4.1 While much of the original activism and environmental justice research was concerned with proximity to human-induced hazards such as factories and waste-disposal sites, there has been growing evidence of unequal risk to populations exposed to natural hazards such as earthquake and flooding (Blaikie et al. 1994; Buckle et al. 2000; Enarson and Fordham 2001; Wisner et al. 2004). And although most of this research has been conducted in what may be considered more hazard-prone areas such as the cyclone belts in Australia and the USA and earthquake vulnerable areas of South America and Turkey, the recent floods in the UK (especially in Autumn 2000 and events such as the flooding of Boscastle in 2004 and Carlisle in early 2005) and growing concerns over global climate change, have highlighted the importance of more research even in regions with historically less dramatic natural events, such as the UK (EA 2001).4.2 Recent research for the UK Environment Agency (Walker et al. 2003) found no disproportionate distribution of the population in the lower (more deprived) deciles residing within the fluvial flood plain of England, although there did seem to be a relationship between more deprived ward populations and flood hazard in tidal flood plains. Using unit postcode centroids to estimate the proportion of the population within a ward that lies within the flood plain, they were able to relate total population figures to the rating of that ward within the index of deprivation (IMD 2000) (ODPM 2000). Thus total at-risk and not-at-risk populations were calculated for each decile of the IMD. The authors acknowledge, however, that using ward level deprivation data assumed that all people within each ward share the same deprivation characteristics. Wards as aggregation units are comparatively large, estimated to contain approximately 2000 households and 5000 people, and generalisations to this level will necessarily involve many assumptions about the population residing within them. Walker et al (2006) further extended this work using the more recent Environment Agency 2004 flood maps, deprivation deciles derived from the IMD 2004 data (ODPM 2004a) aggregated to super output areas (SOAs) (population, approx 1,500), and the Ordnance Survey's Address-Point® to capture those addresses at risk within each SOA. Again though, it was acknowledged that a limitation of this method is that 'all addresses within a SOA are still necessarily assumed to have the same deprivation characteristics'(Walker et al. 2006:52). Once again, they found that inequality existed within the tidal flood plains in all regions within England and Wales but no overall inequality within the fluvial flood plains although there was great regional variation in inequalities within the fluvial flood plains.
4.3 To explore different measures of inequality within the flood plains and to try to address the problem of aggregating deprivation profiles to large areas such as wards and SOAs, Fielding and Burningham (2005) employed a spatial method which re-distributed population characteristics, derived from the 1991 Census data, as population grids using Surface Builder, a freely-available program. These spatially distributed, characterised, populations were then 'captured' and defined as 'at risk' if they resided within the extent of the Environment Agency indicative flood map. They found that this 'outsider' perspective of those 'at risk' found that overall, the lower social classes and the unemployed experienced a greater flood risk but no distinction was made between tidal and fluvial risk (Fielding & Burningham 2005). As previously discussed, defining risk in this way from an objective, etic perspective of the population 'at risk' may not match the subjective, 'insider' perspective of the individuals concerned. Such an objective view of risk is actuarial while the subjective, perception of risk is socially constructed. However, objective measures such as these are often used to develop policies, target resources and direct flood warning campaigns. Elsewhere we have argued to engage local people, their views and perspectives in flood warning campaigns to develop strategies to raise local awareness of flood risk Burningham et al. (2007). This paper however, extends the previous research characterising those at flood risk from an etic, 'outsider's' viewpoint, not only differentiating between tidal and fluvial risk, but also using the 2001 Census and the latest Environment Agency flood maps (2004).
Methodology for exploring the social distribution of flood risk
5.1 Following a mainly outcome-based analysis of flood risk, populations 'at risk' from both tidal and fluvial flooding were identified and their social class distributions were compared to the no/low flood risk populations. Logistic regression analysis was then used to estimate the likelihood of each social class being at flood risk, both overall and by Environment Agency region. The research therefore firstly identifies the risk prone areas (the flood plains) and then seeks to classify the social class of those that live within those areas.Identification of risky areas
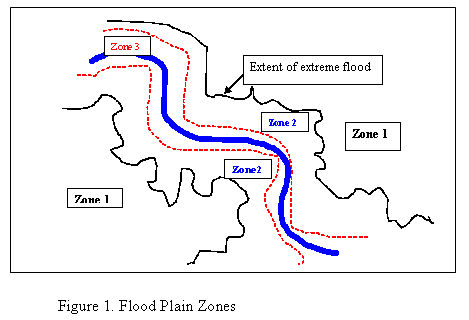
6.1 Areas 'at risk' were those defined by the Environment Agency as within the zone 2 flood plains (FPs). Flood plain maps, based on annual risk, differentiate between areas with little or no risk (zone 1: less than one in a thousand year chance of any flooding), those with low to medium risk (zone 2: more than 1 in a 1000 year risk of flooding from both rivers or the sea) and those living in high risk areas (zone 3: those with more than a 1 in a 100 year chance of river flooding and/or more than a one in 200 year chance of sea flooding). Zone 2 flood zones represent the extent of an extreme flood event. Note that those living within zone 2 will also include those living within zone 3. This research uses flood zones 2 and 3, the extent of an extreme flood, to define those 'at risk' ie all those living within the solid black line on either side of the river (the thick line) in Figure 1.
|
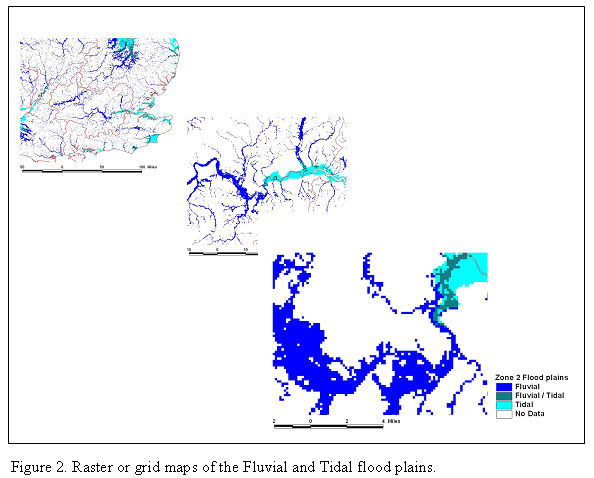
6.2 The vector flood maps were converted into raster grid layers in ArcView 3.3. Thus three grid layers were created: a fluvial grid, a tidal grid; and an overlapping fluvial and tidal grid. See Figure 2 for a representation of the grid flood maps used for the analysis. Figure 2.
|
6.3 In our analyses, fluvial risk was defined as the combination of the fluvial and fluvial/tidal grid and correspondingly, tidal risk was a combination of tidal and the fluvial/tidal grid. Thus the sum of these areas 'at risk' exceeds their separate areas since some areas experience both fluvial and tidal flooding.
Social Class in the 2001 Census
7.1 This paper takes an etic, quantitative, approach to characterize those 'at risk' using social class as an indicator of social standing within society, and potentially, a measure of dependency or vulnerability within a community. While the conceptualisation of social class as an indicator of poverty or social deprivation, may be contended, it is commonly used to investigate health inequalities (Scambler & Higgs 2001; Chandola 2000). In quantitative studies of inequality, measures of social division or difference are often defined by available data and this study is no different. Thus, while using such categorized class indicators (such as that available in the 2001 UK Census) to measure economic difference departs from some more recent cultural approaches to class analysis which theorise class as individualized hierarchies (Devine and Savage, 2000;Bottero, 2004), such analysis nevertheless has value in identifying quantifiable difference, especially at the household level.7.2 The social class variable (NS-SEC) used in the 2001 UK Census was developed from the 'Goldthorpe Schema' (Erikson and Goldthorpe 1992), a widely used predictor of health and educational outcomes (Marshall et al. 1997), and was designed to measure social relationships in the work place based on employment relations. Further validation of the use of this social class classification, especially of the classification of the long-term unemployed (as a separate category) and of the retired (by their last main occupation), can be found in Rose and O'Reilly (1998). Our analyses relate to households at risk from flooding, and therefore a household measure of social class is most appropriate. This is measured by the class of the household reference person (HRP) defined as the member of the household in whose name the accommodation is owned or rented. Where the household is in joint names, that member with the highest income is the HRP. This is an example of the 'dominance' approach to measuring class (Erikson, 1984).
7.3 Area statistics for social class were downloaded from the 2001 Census via CASWEB[1] from Table CAS044, NS-SEC of Household Reference Persons (HRP) aged 16-74 in England and Wales. Data, with spatial referents, were then entered into SPSS for preliminary recoding of social class (NS-SEC) before entering (as csv format files) into Surface Builder[2] to create six separate social class grids:
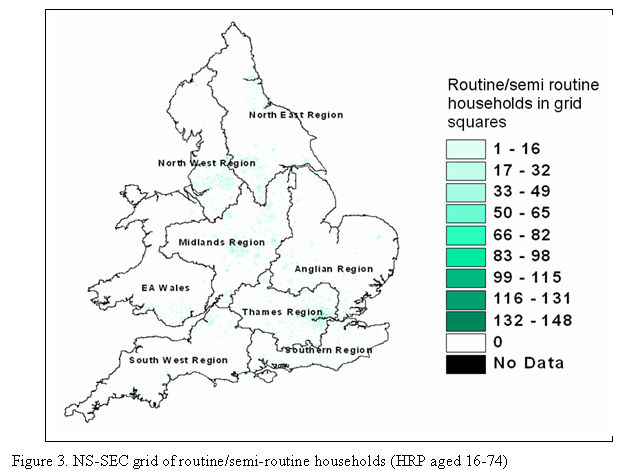
7.4 Surface Builder, developed by David Martin (Martin & Brackan 1999), imputes the distribution of larger area statistics (in this case, output areas) into 200m grid squares based on the population centroids for each area (Martin 1989; Brackan & Martin 1989). These surface population grids are then imported into Arc View for analysis. The surface population grid map of those classified as semi-routine and routine is seen in Figure 3 (see Fielding and Burningham 2005 for a full description of this methodology).
|
Identification of 'risky' people
8.1 Within ArcView, the flood grids and the social class grids were introduced as separate layers and the map calculator was used to identify class grid squares (for each social grouping) which intersected with the flood grid squares (separately for zone 2, tidal and fluvial flood plains). Thus the 'at risk' populations were identified by the coincidence of populated grid squares with flood grid squares. Figure 4 demonstrates 'at risk' grid squares containing routine/semi-routine households within the zone 2 flood plain.

|
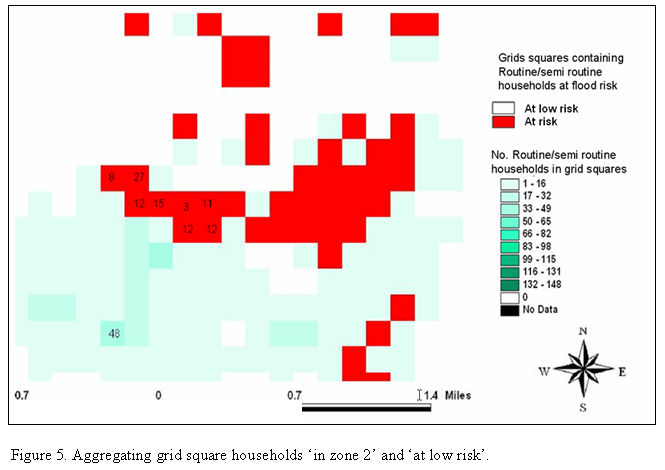
8.2 Data was then summarised to zones to aggregate the total numbers of households 'in zone 2' and 'at low risk' within each Environment Agency region in both the fluvial and tidal flood plains (see Figure 5). In Figure 5, several of the grid squares have been labelled to indicate the total number of households which have been distributed within those grid squares. The map calculator was used to simply sum these figures for each social class within, and not within, risky areas (all zone 2, fluvial and tidal flood plains).
|
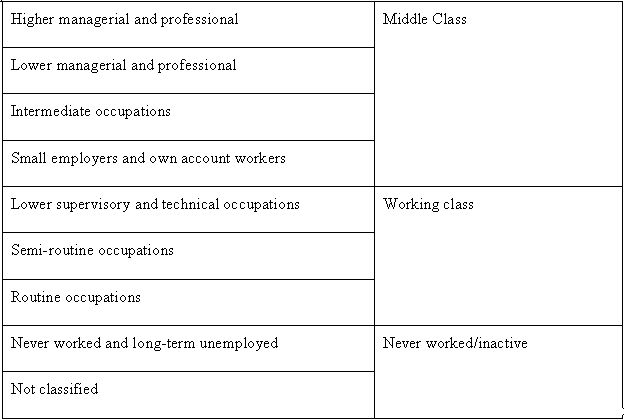
8.3 The resulting data were then imported into SPSS for transformation and analysis. For the purpose of comparison and a clearer analysis, the following class groups were derived:
|
Note that, because of a known error in Census processing which underestimated those aged between 65-74 in the 'never worked' category, the category of 'Not classified' and 'Never worked' has been collated, as guided by Census notes:
'Users are advised either to restrict analyses of ever worked and NS-SeC to the economically active population and to economically inactive people aged under 65, or to combine the 'never worked' and 'not classifiable for other reasons' categories when analysing NS-SeC. The latter is the approach adopted by ONS in the production of commissioned tables, unless otherwise specified by the customer'.[1]
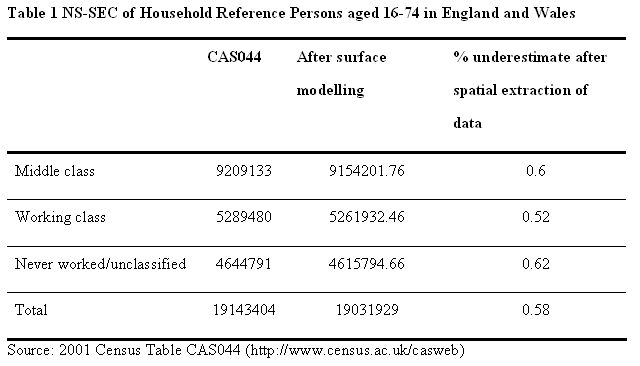
8.4Thus social class data was re-distributed from that within output areas to that within 200m grid squares. Then the sum of those within each class was 'captured' within and without the extent of the zone 2 flood plains. This process necessarily involves error. An estimation of that error, and the percentage error within each class group overall is seen in Table 1. The size of the underestimate expressed as a percentage amounts to 0.58% overall, and furthermore, varies only within 0.1% between the three classes. This overall uniform variation is acknowledged and was deemed acceptable within the parameters relating to the present methodology.
|
Results
Which areas are most likely to be in the flood plains?
9.1 In order to make area comparisons, the distribution of flood risk was explored by geographic region. The regional divisions were those defined by the Environment Agency and are based on river catchments. Thus there are eight regions in England and Wales. Regional analysis was considered an important analytic strategy since the predicted increased flood risk due to climate change is also predicted to be differentially felt throughout the British Isles. This differential effect will arise due to the independent tilting of the NW/SE longitudinal axis of the British Isles which would see those areas in the South East suffering an increased flood risk as the axis tilts (ODPM, 2004b).
|
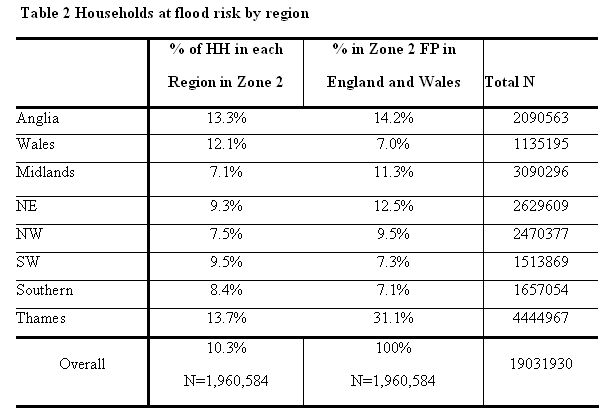
9.2 Table 2 shows that overall, ten percent of all households in England and Wales are 'at risk' from flooding. This compares well with the Environment Agency report of "Around 5 million people, in 2 million properties, living in flood risk areas in England and Wales"[4]. Looking at the distribution of this risk by Environment Agency Region, we see a greater percent of the Thames Region in zone 2 than anywhere else, followed by East Anglia. Households in the Midlands and the NW are least likely to be 'at risk' from flooding.
9.3 Expressed as a percentage of the total flood risk, nearly a third of all households 'at risk' in England and Wales in the zone 2 flood plains are in the Thames Region, twice to four times the likelihood of anywhere else.
|
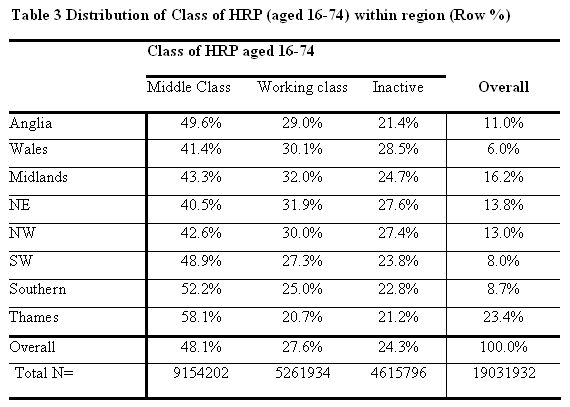
9.4 Table 3 demonstrates the distribution of class by region. Here we see that overall, the Thames region contains nearly a quarter of all households, while Wales is the least populated, with only 6 percent of households. The Thames and Southern Regions are predominately middle class, closely followed by those in East Anglia and the SW. Wales is the region most likely to contain 'inactive' households, while the Midlands, the NE, NW and Wales have the highest percent of working class households.
Likelihood of living within the flood plains
10.1 A statistical technique which can predict likelihood of being 'at risk' (defined as being within the zone 2 flood plains) is logistic regression. The dependant variable is the binary variable, 'in zone 2' / 'not in zone 2' and independent variables are then entered into the analysis in a step-wise fashion. Firstly, social class was entered as the primary independent variable to explore inequality between classes and likelihood of flood risk. This was then followed by Environment Agency Region since we have already seen great regional variation (Table 2 above). Finally, the interaction between class and region, which also shows great variation (Table 3 above), was entered to allow inequalities in class within regions to be explored. Three models will be described; predicting presence in the zone 2 flood plains overall; presence in the fluvial flood plains and finally, presence in the tidal flood plains of England and Wales.Zone 2 flood plains of England and Wales
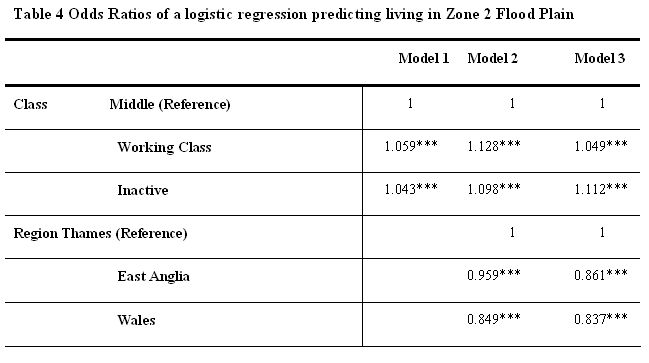
10.2 Table 4 displays the logistic regression analysis results predicting the overall likelihood of being in the zone 2 flood plains of England and Wales, comparing the middle classes (the reference category) to both the working class and the inactive in model 1, and comparing all regions to the Thames Region (the reference category) in model 2 , and finally exploring the interaction between class and region in model 3. Thus to read these tables, the odds of being in the flood plains against not being in the flood plains is expressed as either (significantly) greater or lesser odds than that in the reference category. Thus the odds ratio of the reference category is 1.00 to which we can compare all other odds ratios.
|
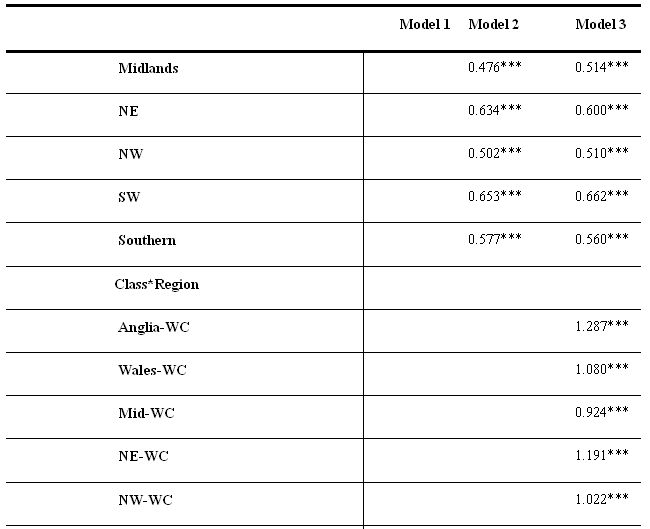
10.3 Model 1 shows that the working class and inactive households (as measured by the class of the household reference person (HRP), usually the householder) are more likely to be in the zone2 flood plains than the middle class. The odds ratio for the working classes (1.059), compared to the middle classes (1.00) shows that there is a 6% greater likelihood of the working classes being in the flood plains than the middle classes. However, controlling for region in model 2 increases the likelihood of being in the flood plains for both working class ( 13% more likely) and the inactive (10% more likely) compared to the middle class but all regions are less likely to be in zone 2 compared to the Thames Region, with the Midlands, NW and Southern regions being least likely.
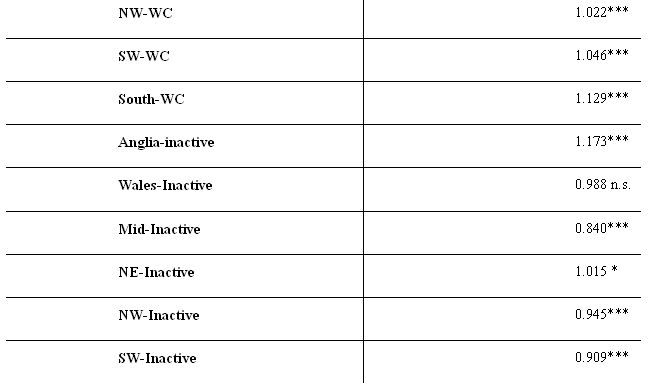
10.4 Model 3 introduces the interaction between class and region. Since we have seen a relationship between region and class (see Table 3) we may expect there to be regional differences by class which may impact upon the analysis. Here we see that the effect of being working class seen in the Thames region (ie. that the working classes are more likely to be in the zone 2 FP) is significantly stronger in all regions except the Midlands. However, the effect of being inactive on likelihood of being in the Zone 2 FP (compared to the Thames region) is significantly weaker or non-significant in all areas except East Anglia and the NE where there is a marginally stronger inequality . The reduction in the class effect seen in the Midlands shows that the working class are in fact less likely to be in the zone 2 flood plains in this area (0.924 * 1.049 = 0.969 - odds ratio of being working class in the Midlands and in the zone 2 FP compared to the middle class). Note that in the NW and the SW, despite displaying a weaker effect for the inactive in these regions than that in the Thames Region, the odds ratios still show that the inactive are marginally more likely to be in the zone 2 FPs in these areas compared to the middle classes (NW: 0.945 *1.112=1.05 and SW: 0.909*1.112=1.01).
Fluvial Flood Plains of England and Wales
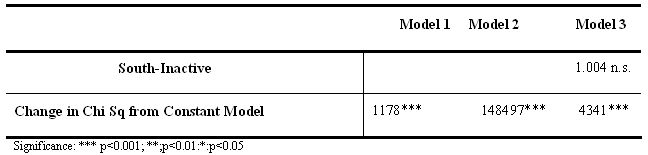
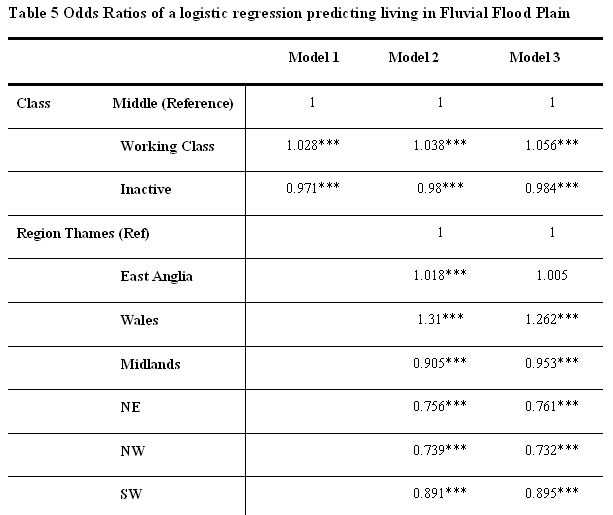
10.5 The second analysis, predicting presence in the fluvial flood plains, is seen in Table 5.
|
10.6 Model 1, using class to predict presence in the fluvial flood plains, shows that overall, the working class are more likely to be in the fluvial flood plains and the inactive less likely than the middle class. Model 2, with the addition of Environment Agency Region, shows that even controlling for region, there remains the same inequality between classes. So, the effect of class cannot simply be explained by where someone lives. Conversely, we see that region, controlling for class, does have a big impact on the likelihood of living in the fluvial FP with those living in East Anglia and Wales being much more likely to be living in the fluvial flood plains than those living in the Thames area. Those in the NE, the NW, SW and Southern regions are less likely than those in the Thames region to be in the fluvial flood plains.
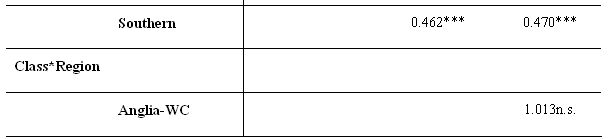
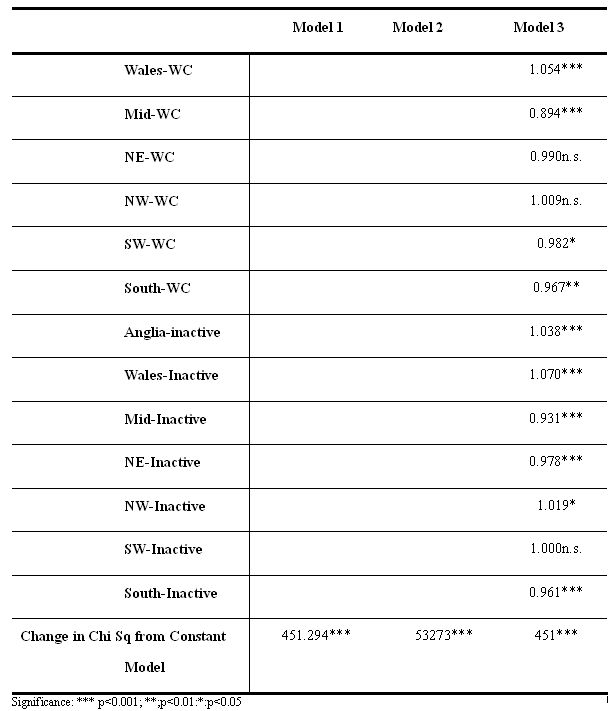
10.7 Model 3 explores the likelihood of living within the fluvial FP, not only controlling for the main effects of class and region, but also controlling for the interaction between class and region. Perhaps the regional differences seen in class, systemically affect risk likelihood. However, despite these controls, the overall inequality remains: the working class are more likely and the inactive less likely to be in the fluvial FPs. However, there is considerable regional variation. While the class effect seen in the Thames region is largely mirrored in the SW, the South and the NE (ie. Working class more likely; inactive less likely), that seen in Wales is significantly greater and consequently, both the working class and the inactive are more likely, compared to the middle classes, to be in the fluvial flood plains. The effect for East Anglia however, shows that while the inactive are significantly more likely to be in the fluvial flood plains than the corresponding class in the Thames region, the working classes, while still more likely to be in the fluvial flood plains, are not significantly more so than those in the Thames region. The only region where there is a significantly lower likelihood of the working class, compared to the middle class, of being in the fluvial FPs is in the Midlands (1.056* 0.894=0.944).
Tidal Flood Plains of England and Wales
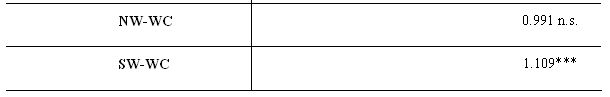
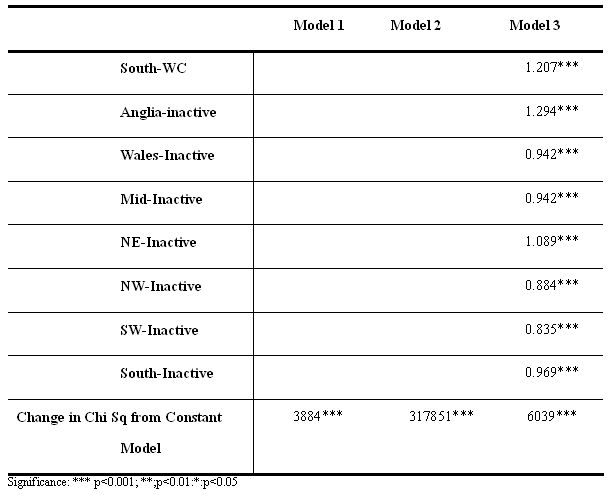
10.8 Table 6 shows the logistic regression analysis predicting the likelihood of inequality within the tidal flood plains of England and Wales.
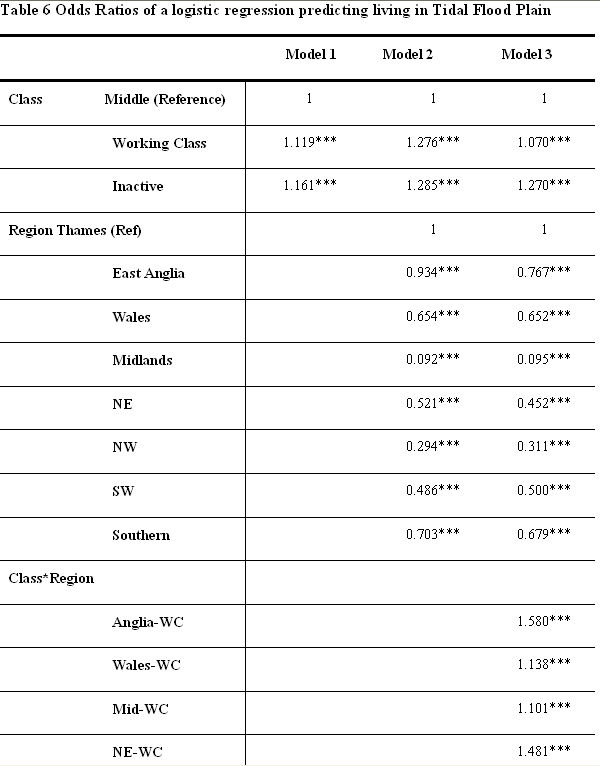   |
10.9 In model 1 both the working class and the inactive are significantly more likely to be in the tidal FPs compared to the middle class. Controlling for region, in model 2, the inequality remains and strengthens. Model 2 also shows that there is great regional variation in likelihood of being in the tidal FPs. Households in all regions are less likely to be living in the tidal FPs compared to those living in the Thames regions and not surprisingly, those in the Midlands are least likely, despite this EA region containing the Humber and Avon catchments including estuaries.
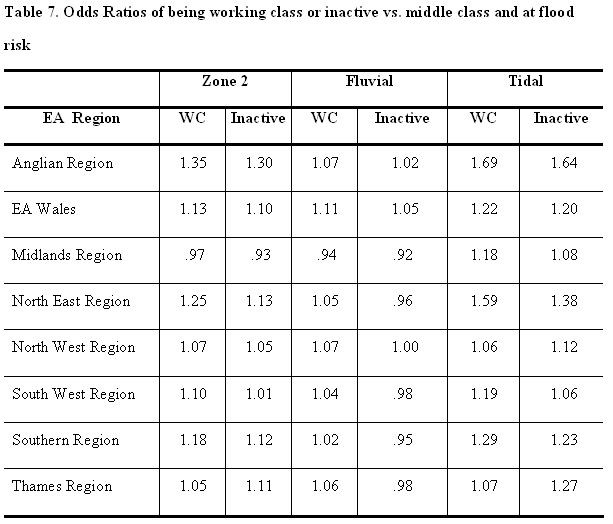
10.10 Adding the interaction between class and region (model 3) allows a comparison of the effect of being either working class or inactive in the Thames region to all other regions. Adding this term reduces the greater likelihood of the working class living in the tidal FPs compared to the middle class, although a significant inequality remains. The addition of the interaction term has minimal effect on inequality seen between the inactive and the middle class; this remains very significant. However, once again, regional differences in class effect exist. All areas show a greater likelihood for the inactive and the working classes, compared to the middle classes, of being in the tidal FPs but this effect is much stronger in the NE and strongest of all in East Anglia (odds ratio of being in the tidal FPs compared to the corresponding classes in the Thames Region of 1.58*1.07=1.69 and 1.294*1.27=1.64 for the working class and inactive respectively). The class effect in Wales, the Southern Region, and marginally in the SW, is also stronger than that seen in the Thames Region, with the working classes being significantly more likely of being in the tidal FPs than the middle classes. These class and region effects are summarised in Table 7 which shows the odds ratios in all EA regions of being working class or inactive vs. middle class and at flood risk.
 |
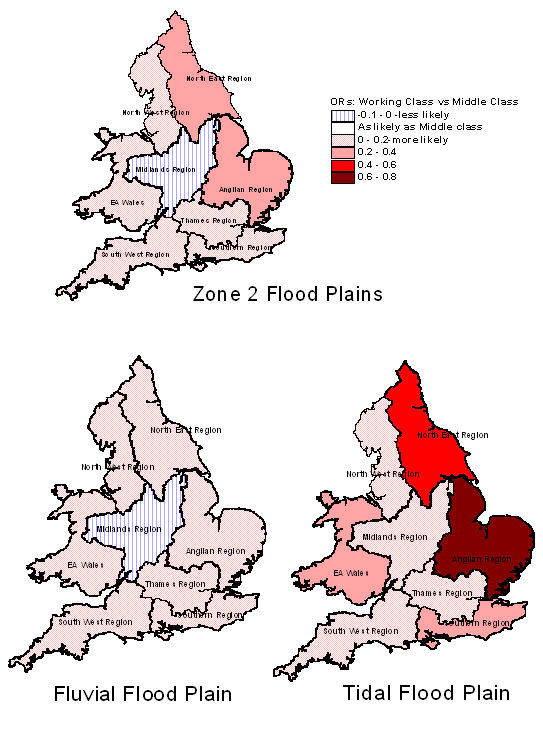
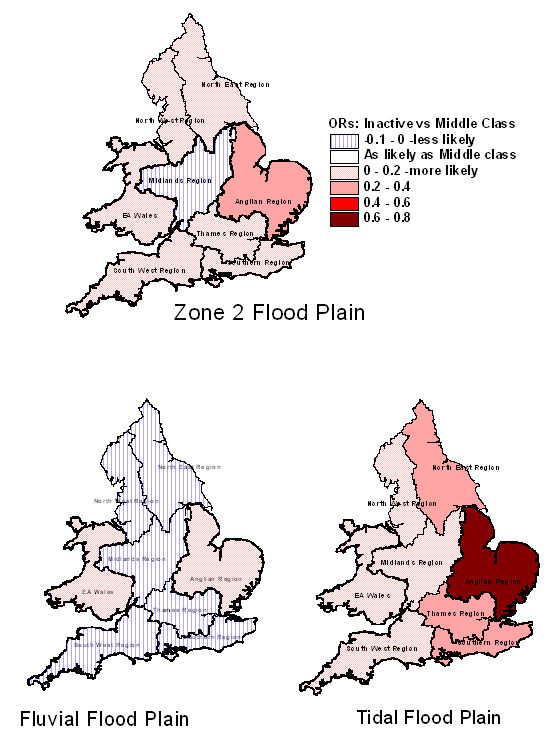
10.11 These results are perhaps more strikingly portrayed in Figures 6 and 7 below, depicting the odds ratios of being working class or inactive vs. middle class and at flood risk controlling for class and region. In these maps, note that one has been subtracted from the odds ratios in order to create an effect with odds of greater likelihood of being in the FPs (of either the working or inactive compared the middle classes) as positive numbers and those of lower likelihood as negative numbers.
| Figure 6. Odds ratios of working class vs. middle class in the flood plains |
 |
| Figure 7. Odds ratios of being inactive vs. middle class within the flood plains |
 |
Conclusions
11.1 If all things were equal, then there would be no disproportionate distribution of social classes within the flood plains of England and Wales. The affluent and the less so would have an equal chance of living in a flood risk area and any impact of a flood event would be indiscriminate a social leveller. On the face of it, there is no reason to suppose that where we might live, and our exposure to flood hazard, would depend on the topographical lie of the land. Yet we could extend this to play on the use of 'lie' as in 'untruth' perhaps belying the assumed equality of distribution. Indeed, this research has clearly shown there is inequality in the distribution of flood risk in England and Wales when comparing more deprived groups and the middle and upper classes. Those classified as inactive include the unemployed and those who have never worked and, would usually be considered to constitute a deprived grouping. However, the grouping also includes those difficult to classify. Thus, although inequalities exist between areas in this group, it is perhaps best, due to the various nature of this classification, to concentrate on the inequalities that have been shown to exist between the middle class and the working classes in England and Wales. Looking at zone 2 flood risk overall would seem to mask the more striking inequalities in the tidal flood plains compared to the fluvial risk. This result conforms to that found by Walker et al. (2003& 2006) in his studies exploring inequalities in the flood plains using deprivation indices in output areas.
11.2 However, our results differ from Walkers' in finding that there is significant inequality overall between the middle classes and both the working classes and the inactive, even in the fluvial flood plains of England and Wales (except in the Midlands Region). The working class in the Eastern regions of England seem to be exposed to particular inequality compared to the middle classes, especially in East Anglia and the NE, in both the fluvial and tidal FPs, although inequalities exist in Southern and Welsh regions as well. Why the tidal flood plains seem to attract particular inequality would be a subject to explore, possibly approached by an analysis of the migration patterns of people into coastal areas, particularly upon retirement. These spatially distributed inequalities are particularly interesting in light of recent research into the spatial distribution of the economic costs of the emergency response to flooding (Penning-Rowsell and Wilson 2006). They found that in the UK floods of 2000, while the spatial distribution of the non-structural costs incurred by the emergency services broadly mapped onto the pattern of property damage sustained, the overall emergency costs severely underestimates the total economic flood losses. This would be particularly hard felt by those on low income who are less likely to be insured (Whyley et al. 1998).
11.3 Research into the costs involved during a flood emergency is particularly important in highlighting the non-structural elements within the flood hazard management policy. Such policy is now seen, certainly in Scotland, and to some extent in England and Wales, to be gradually moving away from the more historical, structural responses of building flood defences and land reclamation, towards more sustainable non-structural solutions (Penning-Rowsell and Wilson 2006, Werritty 2005). It is generally recognised that the effects of climate change will only increase the flood risk and furthermore, this change in flood hazard management policy seeks to share responsibility with the communities and individuals at risk. Indeed, the message from the Environment Agency is 'Flooding. You can't prevent it. You can prepare for it'5. This message is also evidenced by publications such as 'Learning to live with Rivers' (Institute of Civil Engineers 2001), 'Preparing for Floods' (ODPM 2002), and 'Making space for water' (Defra 2005). This returns us to the etic and emic conceptualisations of vulnerability previously discussed that suggests that despite an individual being defined objectively at flood risk (ie. by residing within the boundaries of the flood risk areas), it is only when that risk is recognised, does that individual feel vulnerable and may take appropriate action.
11.4 However, this simple dichotomy of viewpoints belies a more complex social mechanism. On the one hand, claims to objectivity may also be considered to be socially constructed: the flood maps used in this paper may make claims of scientific objectivity but be based on political boundaries and insurance company principles and viewpoints. And on the other hand, while those at flood risk may have differing perceptions of the significance and importance of such statistical information, that does not make their views any less "objective". Rather than regard emic and etic perspectives as competing versions of social reality, complex social phenomena require coordination of the perspectives and their associated methodologies. Latterly the dominant approach to such multiple-method research has been one that seeks to combine methods in order to gain analytic depth, an approach that partly reflects recognition of the epistemological difficulty of combining methods based on differing fundamental assumptions and partly reflects the increasing complexity of the social phenomena with which social research engages (Fielding and Schreier 2001).
11.5 Another main point to make is that while inequalities exist in the flood plains this does not necessarily indicate that an injustice has occurred. Recall that there is a distinction between inequality and injustice. The question, 'Is inequality inequitable?' could be answered in the affirmative. There are many studies which show that the poor, the disabled, the young, women, the very old etc. are less able to cope, physically, financially and psychologically in extreme situations such as during or following a flood (Fordham 1998; Fordham 1999; Tapsell et al. 2002; Cutter 2003; Wisner et al. 2004; Cutter et al. 2003; Cutter & Emrich 2006). But the question 'Is inequality unjust?' poses a different matter that revolves around whether it can be shown that people are discriminated against because they are poor/disabled/very young/very old etc. There is some evidence of this in the UK with the building of social housing on the flood plains (Mayo & Tickell 2006) against Environment Agency advice, clearly designed to attract the more deprived households. The question of freedom to choose where one lives is clearly a factor and unequal opportunity to choose to avoid environmental hazard could be seen as an injustice. Generally, it is necessary to show why the more deprived are more likely to be living 'at risk' and the answers to these kinds of questions may be addressed by longitudinal studies of migration into areas 'at risk' process-driven analysis. Here investigation into neighbourhood formation before and after the occurrence of any hazard event is important and should be the subject of future studies.
Notes
1 http://census.ac.uk/casweb/(accessed 9th March 2007)2 http://www.geog.soton.ac.uk/users/martindj/davehome/software.htm(accessed 9th March 2007)
3 http://www.statistics.gov.uk/census2001/unprocess_forms.asp(accessed 9th March 2007)
4 http://www.environment-agency.gov.uk/subjects/flood/(accessed 9th March 2007)
5 http://www.environment-agency.gov.uk/commondata/acrobat/167219(accessed 17th April 2007)
References
ACHESON, D., Chambers, J., Graham, H., Marmot, M., & Whitehead, M. (1998) The 'Acheson Report': Independent Inquiry into Inequalities in Health., The Stationery Office, London, 164.BLAIKIE, P.,Cannon,T. ,Davis,I. and Wisner, B. (1994). At risk, natural hazards, peoples vulnerability and disaster, Routledge, London, 1994.
BOTTERO, W. (2004) . Class Identities and the identity of class. Sociology 38:985-1003.
BRACKAN, I. & Martin, D. (1989) 'The generation of spatial population distributions from census centroid data', Environment and Planning A, vol. 21, pp. 537-543.
BUCKLE, P., Marsh, G., & Smale, S. (2000) 'New approaches to assessing vulnerability and resilience', Australian Emergency Management Journal pp. 8-15.
BURNINGHAM, K., Fielding, J. and Thrush, D. (in press) "It'll never happen to me": Understanding public awareness of local flood risk. Disasters ,
CHANDOLA, T. (2000) Social class differences in mortality using the new UK National Statistics Socio-Economic Classification. Social Science & Medicine 50 (5):641-649, 2000.
CUTTER, S. L. (2003) 'The Vulnerability of Science and the Science of Vulnerability', Annals of the Association of American Geographers, vol. 93, no. 1, pp. 1-12.
CUTTER, S. L., Boruff, B. J., & Shirley, W. L. (2003) 'Social Vulnerability to Environmental Hazards', Source Social Science Quarterly, vol. 84, no. 2, pp. 242-261.
CUTTER, S. L. & Emrich, C. T. (2006) 'Moral Hazard, Social Catastrophe: The Changing Face of Vulnerability along the Hurricane Coasts', The Annals of the American Academy of Political and Social Science, vol. 604, no. 1, pp. 102-112.
DEFRA (2005) Making space for Water: taking forward a new government strategy for flood and coastal erosion risk management in England.. Department for the Environment, Food and Rural Affairs, London.
DEVINE, F. and Savage, M. (2000) Conclusions: Renewing class analysis. In: Renewing class analysis, edited by Crompton, R. Devine, F., Savage, M. and Scott, J. p. 184-199 Oxford:Blackwell.
ENARSON, E. & Fordham, M. (2001) 'Lines that divide, ties that bind: race,class and gender in women's flood recovery in the US and UK.', Australian Journal of Emergency Management, vol. 15, no. 4, pp. 43-52.
EA (Environment Agency) (2001) Achieving Environmental Equality. Environment Agency AGM Debate 5th September 2000. Bristol: Environment Agency.
ERIKSON, R. (1984) Social class of men, women and families, Sociology 18 (1984), pp. 500514
ERIKSON, R. and Goldthorpe, J.H. (1992) The Constant Flux, Clarendon, Oxford.
EPA (US Environmental Protection Agency ) (1998). Guidance for incorporating environmental justice in EPA's NEPA compliance analysis. Washington DC: U.S Environmental Protection Agency.
ESRC.(2001) Environmental Justice. Rights and means to a healthy environment for all. ESRC Global Environmental Change Programme Special Briefing No.7. University of Sussex.
FIELDING, J. & Burningham, K. (2005) 'Environmental inequality and flood hazard', Local Environment, vol. 10, no. 4, pp. 379-395.
FIELDING, J. Burningham, K., Thrush, D. and Catt, R (2007). Public Response to Flood Warning. Environment Agency. Science Report SC020116
FIELDING, N and Schreier, M. (2001) . Introduction: On the Compatibility between Qualitative and Quantitative Research Methods. FQS (Forum: Qualitative Social Research) 2 (1).
FOE. (1999). Polluting Injustice: the geographic relation between household income and polluting factories. London: Friends of the Earth.
FOE. (2001). Pollution and Poverty - Breaking the link. London: Friends of the Earth
FORDHAM, M. (1998) 'Making Women Visible in Disasters: Problematising the Private Domain', Disasters, vol. 22, no. 2, pp. 126-143.
FORDHAM, M. (1999) 'The Intersection of Gender and Social Class in Disaster: Balancing Resilience and Vulnerability', International Journal of Mass Emergencies and Disasters, vol. 17, no. 1, pp. 15-37.
INSTITUTE OF CIVIL ENGINEERS (2005). Learning to Live with Rivers. ICE, London.
ISDR.(2004) Living with Risk - A global review of disaster reduction initiatives. Inter-Agency Secretariat of the International Strategy for Disaster Reduction (UN/ISDR).. Available at http://www.unisdr.org/eng/about_isdr/bd-lwr-2004-eng.htm [Accessed 4 April 2007]
MARSHALL, G., Swift, A. and Roberts, S. (1997) Against the Odds; Social class and social justice in industrial societies. Oxford University Press, Oxford.
MARTIN, D. (1989) ' Mapping population data from zone centroid locations', Transactions of the Institute of British Geographers NS, vol. 14, pp. 90-97.
MARTIN, D. & Brackan, I. (1999) CCS605:1981 and 1991 Population Surface Models: a Guide, Census Dissemination Unit, University of Manchester.
MAYO, E. & Tickell, J. (2006) A consumer audit of social housing, National Consumer Council.
ODPM (2000) Indices of deprivation 2000 [online].London. Available from http://www.communities.gov.uk/index.asp?id=1128449
[accessed 4 April 2007]
ODPM (2002) Preparing for Floods: Interim guidance for improving flood resistance of domestic and small business properties, Office of the Deputy Prime Minister, London.
ODPM (2004a) Indices of deprivation 2004 [online].London: ODPM. Available from: http://www.communities.gov.uk/index.asp?id=1128440
[Accessed 4 April 2007]
ODPM. (2004b) The Planning Response to Climate Change: advice on better practice. London: HMSO
ROSE, D. and O'Reilly, K. (1998) ESRC Review of Government Social Classification. Office for National Statistics. http://www.statistics.gov.uk/downloads/theme_compendia/ESRC_Review.pdf [Accessed 17th April 2007]
SCAMBLER, P & Higgs, P. (2001) `The dog that didn't bark': taking class seriously in the health inequalities debate. Social Science & Medicine 52 (1):157-159.
SPIERS, J. (2000) New perspectives on vulnerability using emic and etic approaches. Journal of Advanced Nursing 31 (3):715-721.
STEPHENSON, S., Stephens, C., Landon, M., Pattendon, S., Wilkinson, P., & Fletcher, T. (1998) 'Examining the inequality and inequity of car ownership and the effects of pollution and health outcomes such as respiratory disease', Epidemiology, vol. 9, no.4, pp. S29.
TALIH, M. & Fricker, R. D. (2002) 'Effects of neighbourhood demographic shifts on findings of environmental injustice: a New York City case-study', Journal of the Royal Statistical Society: Series A (Statistics in Society), vol. 165, no. 2, pp. 375-397.
TAPSELL, S. M., Penning-Rowsell, E. C., Tunstall, S. M., & Wilson, T. L. (2002) 'Vulnerability to flooding: health and social dimensions', Philosphical transactions - Royal Society of London Series A Mathematical and Physical Sciences., vol. 360, no. 1796, pp.1511-1525.
WALKER, G., Burningham, K., Fielding, J., Smith, G., Thrush, D., & Fay, H. (2006) Addressing Environmental Inequalities: Flood Risk, Environment Agency, Bristol. Science Report SC020061/SR1
WALKER, G., Fairburn, J., Smith, G., & Mitchell, G. (2003) Environmental Quality and Social Deprivation, Environment Agency, R&D Technical Report E2-067/1/TR.
WALKER, G., Fairburn, J., & Bickerstaff, K. (2000) 'Ethnicity and risk; the characteristics of populations in census wards containing major accident hazard sites in England and Wales', University of Staffordshire, Department of Geography Occasional Paper, 15.
WISNER, B., Blaikie, P., Cannon, T., & Davis, I. (2004) At risk: natural hazards, people's vulnerability and disasters, 2nd edn, Routledge.
WHYLEY, C., McCormick, J., Kempson, E. (1998) Paying for peace of mind: access to home contents insurance for low income households, Policy Studies Institute, London.