By Slow Degrees: Two Centuries of Social Reproduction and Mobility in Britain
by Paul Lambert, Kenneth Prandy and Wendy Bottero
Stirling University
Sociological Research Online, Volume 12, Issue 1,
<http://www.socresonline.org.uk/12/1/prandy.html>
doi:10.5153/sro.1493
Received: 13 Nov 2006 Accepted: 19 Jan 2007 Published: 31 Jan 2007
Abstract
This paper discusses long term trends in patterns of intergenerational social mobility in Britain. We argue that there is convincing empirical evidence of a small but steady linear trend towards increasing social mobility throughout the period 1800-2004. Our conclusions are based upon the construction and analysis of an extended micro-social dataset, which combines records from an historical genealogical study, with responses from 31 sample surveys conducted over the period 1963-2004. There has been much previous study of trends in social mobility, and little consensus on their nature. We argue that this dissension partly results from the very slow pace of change in mobility rates, which makes the time-frame of any comparison crucial, and raises important methodological questions about how long-term change in mobility is best measured. We highlight three methodological difficulties which arise when trying to draw conclusions over mobility trends - concerning the extent of controls for life course effects; the quality of data resources; and the measurement of stratification positions. After constructing a longitudinal dataset which attempts to confront these difficulties, our analyses provide robust evidence which challenges hitherto more popular, politicised claims of declining or unchanging mobility. By contrast, our findings suggest that Britain has moved, and continues to move, steadily towards increasing equality in the relationship between occupational attainment and parental background.
Keywords: Social Mobility; Intergenerational Change; Occupations; CAMSIS; Social Stratification; Longitudinal Trends
1. Findings in social mobility research
Perfection is attained by slow degrees; it requires the hand of time. Voltaire1.1 Sociology remains some way from a consensus on the nature of trends in intergenerational social mobility patterns (Breen and Jonsson 2005). In the United Kingdom, recently influential contributions have suggested both stability (esp. Goldthorpe and Mills 2004), and decline (esp. Blanden et al. 2004), in the extent of social mobility. In contrast to both, this paper, using extended data resources charting long-term trends in mobility patterns, shows a small but persistent increase in social mobility throughout the course of the last two centuries.
1.2 Breen (2004, chapters 1 and 2) gives a recent review of theory and methodology in social mobility research. Intergenerational social mobility is defined as the difference between social origins (during childhood) and current social circumstances. Social origins and current circumstances are measured by indicators relating to structural advantages and disadvantages in life chances. This means that trends (or their absence) in the extent of social mobility over time are believed to tell us about trends in social structural inequalities, such as progress towards 'social justice' or 'equality of opportunity'. Indeed, normative interpretations of social mobility trends have penetrated well beyond the realms of sociological research (cf. Aldridge 2001; Ellen 2005; Blair 2006).
Social mobility in the nineteenth century
1.3 Although historical research into social mobility in Britain in the nineteenth century is very limited, what there is seems to indicate a change towards greater openness during this period (cf. Kaelble 2001). Looking at the returns on English marriage registers for four periods between 1839 and 1914, Miles detects a 'process of loosening-up evident in the rates of mobility which can be observed between classes' (1993: 34; 1999). Similarly, although they tend to stress the degree of continuity, Prandy and Bottero (2000a) find in their Cambridge Family History Study that an adequate statistical model covering the early- and late-worklife occupations of fathers and sons and the occupations of fathers-in-law, involves a step change between those born before and after 1880 (rather than a continuing trend over the period). The latter cohorts experience markedly greater social mobility, resulting from the modernisation of British industry around the turn of the century.Social mobility in the twentieth century
1.4 Until recently, the prevailing sociological position held that any nineteenth century trend towards greater mobility was not continued into the next. Two major studies concluded that the twentieth century was characterised by stability in social mobility rates. Comparing successive birth cohorts in a 1949 study, Glass and his colleagues concluded that 'there have been no major differences between successive generations in the overall intensity of the status association between fathers and sons' (Glass 1954: 216). Similarly, the authors of the 1972 Oxford study wrote that 'the general underlying processes of intergenerational class mobility - or immobility - have apparently been little altered, and indeed have, if anything, tended in certain respects to generate still greater inequalities in class chances', with the result that 'no greater degree of openness has been achieved in British society over recent decades' (Goldthorpe 1980: 85-6). This conclusion was reaffirmed in a subsequent comparison with a further dataset, with the observation that 'a very large measure of continuity can be observed. Relative mobility rates have remained essentially constant on the same pattern that they would appear to have displayed for most of the century' (Goldthorpe and Payne 1986: 18). Studies using more contemporary data have also argued for stability in twentieth century mobility patterns see Breen and Goldthorpe's (2001) comparison of 1958 and 1970 birth cohort studies; and Goldthorpe and Mills' (2004) analysis of 1975-1992 General Household Survey data.1.5 Since these findings have been reported by the leading researchers in the field, it is hardly surprising that they have, for the most part, become the generally accepted, conventional view (Payne and Roberts 2002). Notably, in a discussion paper prepared for the UK government's Cabinet Office Performance and Innovation Unit, it is accepted that 'relative social mobility (the relative chances of people from different social backgrounds making it to a given social class) has been fairly stable' (Aldridge 2001: para. 6; see also Aldridge 2003). This model of 'constant social fluidity' was absorbed into international comparative analyses with the British pattern of stability said to fit into a broader pattern of 'trendless fluctuation' and minimal difference between industrial or post-industrial societies. In a major comparative study it was argued that, whatever changes might be detected in one or another country, 'the emphasis may better be placed on the degree of stability of relative rates over time' (Erikson and Goldthorpe 1992a: 99).
1.6 The 'constant social fluidity' view of mobility rates has recently been supplemented by a number of studies which use contemporary survey datasets to argue that intergenerational mobility rates have, in fact, fallen between recent birth cohorts (Gershuny 2002a; Blanden and Gregg 2004; Blanden et al. 2004, 2005; Machin and Gregg 2003; Machin and Vignoles 2004). This 'tightening up' position is one which chimes with some recent outputs from the United States (Rytina 2000a; Hauser et al. 2000), and one that has found immediate political influence and populist support in the UK (e.g. Pearce and Paxton 2005; Kelly 2005)[1].
1.7 Both the 'constant social fluidity' and 'tightening up' views of social mobility suggest some discontinuity from nineteenth century social structures. Miles (1993; 1999) described a steady rise in both relative and absolute mobility rates over the course of the nineteenth century. Equally, the data of the Cambridge Family History Study (Prandy and Bottero 2000) can be interpreted as indicating an increase in relative mobility rates over the period[2]. However, if these nineteenth century trends are accurate, the thesis of no subsequent change represents something of a puzzle.
1.8 A third view of mobility patterns in Britain can be contrasted with the 'constant flux' and 'tightening up' perspectives. The argument that aggregate levels of social mobility have increased over time albeit slightly - has been made in five meta-analyses of survey datasets over the latter half of the twentieth century (Ganzeboom et al. 1989; Heath et al. 1992; Noble 1995; Heath and Payne 2000; Payne and Roberts 2002), along with our own study below.
1.9 Several international studies support this position. The argument that there is 'strong support for the claim of a world wide secular trend towards increased social openness' was first developed by Ganzeboom et al. (1989: 44), and was supported by the evidence from across Europe in the nineteenth century presented in Miles and Vincent (1993). The national analyses collected in Breen (2004) broadly lead to this position for the majority of European countries, although it is argued that the case of rising mobility in Britain is, at best, not proven (Breen and Luijkx 2004; Goldthorpe and Mills 2004; Wong 1994). Such a trend - towards increasing mobility over the twentieth century in Britain - would seem more consistent with previous evidence from the nineteenth century, and more comparable with other European countries. If correct, it would be of interest to know whether the profile of change has declined or accelerated over the period. If erroneous, it would be helpful to have further data to explain how the discontinuity from the nineteenth century to the 'constant flux' or 'tightening up' positions arose.
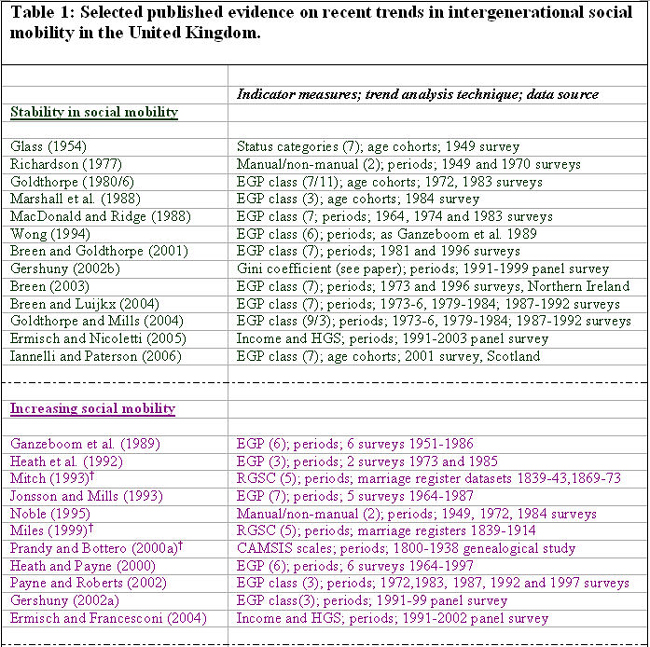
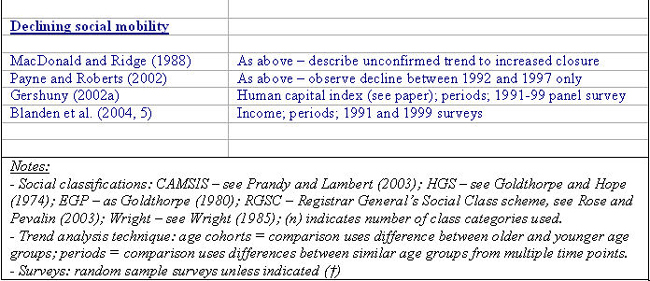
1.10 Table 1 summarises a selection of published findings on the nature of recent trends in intergenerational social mobility in Britain and the UK. The publications are divided into those that find evidence of increase, decrease and stability in mobility (our allocation inevitably ignores some subtleties to the respective reports). Table 1 indicates considerable variation, and numerous outright contradictions, in the findings of different authors (see also the review of Ermisch and Nicoletti 2005).
  |
2. Methodological Issues
2.1 Three methodological difficulties affect conclusions on social mobility trends[3]. These have not been fully addressed in many previous studies of social mobility, which may help to explain the numerous contradictions summarised in Table 1. We discuss these issues below, and describe why we believe that our own data resource, an extended micro-social dataset combining records from an historical genealogical study with responses from 31 random sample surveys conducted over the period 1963-2004, is able to address them.Distinguishing life-course effects from cohort or period effects
2.2 As Table 1 shows, many studies have used survey data from a single period (or a short range of time points). This can lead to the conflation of mobility trends with differences between age cohorts. It is well established that outcome measures such as occupational position and income are substantially influenced by life course stage in the UK (Stewart et al. 1980; Egerton and Savage 2001), yet numerous mobility analyses omit a satisfactory control for ageing and life-course effects. Since period effects are precisely what we are interested in, this approach is unsatisfactory (cf. Abbott 2006). Nevertheless, many studies have published results in which mobility trends are potentially conflated with life-course effects: examples include the highly influential Oxford mobility studies (Goldthorpe 1980/86; Erikson and Goldthorpe 1992a; see critical comments on the over-influence of these studies by Payne and Roberts 2002); and the politically influential analyses of Blanden et al. (2004), which compare young adults from two closely connected time periods.
2.3 Inadequate controls for life-course effects are identified by Ermisch and Nicoletti (2005) as the most significant flaws of previous mobility research (see also Abbott 2006). Longitudinal data resources, whether based upon repeated cross-sectional surveys or repeated contacts panel data, are expected to be much more appropriate to studies of trends over time. Repeated cross-sectional survey data have been increasingly exploited in contemporary analyses, including contributions to internationally comparative research (Ganzeboom et al. 1989; Breen 2004), and studies of the UK (MacDonald and Ridge 1988; Jonsson and Mills 1993; Heath and Payne 2000; Payne and Roberts 2002; Breen 2003; Goldthorpe and Mills 2004). As well as offering us multiple observation points, repeated measures studies allow us to control for age differences across time, whether by standardising age across different time points, or by specifying age effects within statistical models across time.
2.4 In fact, repeated cross-sectional meta-analyses have disproportionately reported trends towards increasing social mobility (Table 1). At the very least, this indicates that increasing the number of points of observation can alter conclusions on social mobility trends. Researchers outside the UK argue that the small magnitude of the trend in (increasing) social mobility observed in many European countries can only be readily identified when we exploit extended data resources covering a long period of time (see esp. Ganzeboom et al. 1989; Vallet 2001).
2.5 Our strategy for confronting the conflation of life course and period effects is to concentrate upon repeated cross-sectional data, maximising the range of micro-social survey studies employed in order to maximise the study time-span. We control for age effects and test our analyses on various restricted age-range samples. We also exploit a limited range of repeated-contacts longitudinal surveys[4].
Data Quality and Evidence of Trends
2.6 A second reason for inconsistent conclusions between different studies of social mobility trends may involve differences in data quality, particularly when comparing separately collected surveys. An advantage of our exploitation of major secondary survey datasets from the period 1963-2004 is that we are able to benefit from the high methodological standards employed during the collection and preservation of these data resources (e.g. Dale 2006; for details on each survey, see the references from Table 2 below). Nevertheless, several previous authors note the considerable difficulties and ambiguities in constructing comparable records from different survey studies (esp. Goldthorpe and Mills 2004)[5].
2.7 One difficulty involves major differences between the content and contexts of different surveys, such as their use of different sampling methods. Our reaction is to collect data from as many major survey studies as possible, and test within our analyses for the over-influence of certain surveys, and indicator measures of survey contexts (see section 4). Several texts on the methodologies of repeated cross-sectional surveys have argued that exploratory reviews of survey effects of this style can ordinarily be expected to expose inconsistencies between surveys, and, subsequently, help to justify the drawing of comparable conclusions (e.g. Firebaugh 1997; Harkness et al. 2003)[6].
2.8 Another challenge to comparative analysis involves the harmonisation of variables that are compared across the range of studies. Our own analysis uses a small range of variables, the most important of which are the occupation of the respondent and their father[7]. The coding of occupations over time has been subject to considerable methodological attention, with the prevailing opinion being the need for a transparent process of coding textual occupational titles to defined occupational unit group schemes, then a second transparent translation from the occupational unit group to a relevant social classification (e.g. Bechhofer 1969; Rose and Pevalin 2003). We therefore restrict our analysis to data where full occupational titles have been recorded[8] and preserved[9], then implement translation indexes[10] which operate on detailed occupational unit group data[11].
2.9 Our analyses also use data on the time of the survey interview and the age of the respondents at interview (coded in years). For ease of comparison, we usually work with measures of the age of respondents and their year of birth (equal to the time of the interview minus their age).
2.10 Another data quality issue concerns our criteria for deciding at what point slight patterns of trend may be confirmed as statistically significant. The trends in mobility that we report from our data are modest and incremental, so similar trends might easily be overlooked, or dismissed as negligible, in other analyses[12]. The identification of slight trends clearly benefits from extended data resources, but also requires an analytical strategy which is not unduly parsimonious. The influential paradigm of log-linear modelling in mobility research has proved particularly conservative in this regard, as its model fit criteria tend to favour parsimony, and thus the model of stability (Breen 2004). By contrast our methods estimate trends according to the coefficients of regression models predicting respondent's own occupational position. An interaction term between time period (or year of birth) and the effect of parental occupation is estimated, and, if significant, taken as evidence of changing social mobility patterns. The significance of any interaction term is influenced merely by the number of cases in the overall study, balanced against the magnitude of the total interaction effect. In this estimation, even very slight trends are likely to be confirmed as statistically significant, provided they follow the specified functional form of the interaction in a consistent way.
Measuring Social Mobility
2.11 A third reason for inconsistent conclusions between studies could involve differences in the measures of intergenerational positions. Most often in sociology occupationally based social classifications have been deployed, but recent interest has widened to measures of income (Blanden et al. 2004), and aggregate measures of life course experience (Gershuny 2002a). Indeed, recent reviews of social mobility research have emphasised the widening array of measures which may be exploited to summarise social mobility processes (Treiman and Ganzeboom 2000; Breen and Jonsson 2005; Morgan et al. 2006).
2.12 We contend that occupational measures are generally to be favoured, as numerous studies have indicated that occupations are strongly related to the patterns of those lifetime inequalities in which the normative evaluations of social mobility research are most frequently interested in (e.g. Stewart et al. 1980; Rose and Pevalin 2003; Goldthorpe and McKnight 2006). Additionally, procedures for coding and treating occupational data within major surveys are relatively transparent and reliable (Rose and Pevalin 2003), and the availability of intergenerational occupational data from survey records is much better when compared to measures such as income (Ermisch et al. 2006).
2.13 The precise way in which occupational data are coded into an occupation-based social classification for the purpose of studying social mobility has been the subject of extended debate. To summarise, early studies in the UK, such as that of Glass and colleagues, assumed that social classes were the units between which movement should be studied. However, those researchers had no strong attachment to the class groupings, the divisions being regarded as 'arbitrary but convenient boundaries' (Glass 1954: 36). It was in many ways a natural development that this approach was superseded by one in which the social order was seen as a hierarchy of occupations differing in their level of prestige or socio-economic standing, and mobility studied as the correlation or regression coefficients between fathers' and sons' occupational scale scores (Blau and Duncan 1967). However, it was argued that this style of approach neglected other important occupational divisions, and in Britain class analysis reasserted itself in a more sophisticated, neo-Weberian form. This was reflected in the widespread use of the 'EGP' class scheme[13] (Goldthorpe 1980).
2.14 The shift toward class schemes was accompanied by the use of log-linear analysis. One aspect of this was an emphasis not simply on trends in absolute mobility rates - the chances of individuals moving from one class to another - but on relative rates, that is the relative chances of individuals attaining class positions given their origins, after controlling for 'structural' changes in the total distribution of social classes between generations. It was the fact that log-linear analysis, incorporating relative rates in the form of odds ratios, indicated no significant difference between cohorts that led to the widespread adoption of the associated 'constant social fluidity' model (Goldthorpe 1980: 77-84).
2.15 Although it is acknowledged to include a hierarchical element, the EGP class scheme is not primarily conceived in terms of hierarchy (Erikson and Goldthorpe 1992a chpt2; 1992c). The point has been made that, mainly as a result of its use of highly aggregated occupational categories, 'the CASMIN model understates the importance of hierarchy relative to sector and inheritance in the determination of mobility patterns' (Hout and Hauser 1992: 262). Further, Prandy (1998) and Rytina (2000b) have argued that the most important aspect of mobility analyses using the CASMIN schema is hierarchy, but that this is obscured by the nature of its conceptualisation.
2.16 This paper concentrates on the hierarchical element in stratification, which is measured by means of CAMSIS (the Cambridge Social Interaction and Stratification scale <http://www.camsis.stir.ac.uk/>). This is not a single measure, but a family of scales each of which is specific to a particular country, time period, and occupational classification. However, the scales are directly comparable, because all are developed from equivalent empirical analyses. Comparability is further enhanced by standardising all scales to have a mean value of 50 and a standard deviation of 15. The historical versions of the scale were constructed from data available at marriage registration for two periods - 1777-1866 and 1867-1913 - on the occupations of grooms, their fathers and their fathers-in-law (for further details, see Bottero and Prandy 2001; Prandy and Bottero 1998). For the modern data we have used scales derived from analyses of the occupations of married partners in the 1971 and 1991 UK censuses. The 1971 version was used, with minor adaptations, for data coded to the 1961 occupational classification, and similarly the 1991 version for data coded to that used in 1981 and 2000.
2.17 The scales are based on empirical analysis of patterns of social interaction. These are taken as reflecting the current structure of hierarchical advantage and disadvantage. Although other forms of interaction, such as friendship, are suitable, the present CAMSIS scales use marriage (the results using friendship are very similar, see Prandy and Lambert 2003). Marriage is particularly suitable because, by uniting families at similar social locations, it constitutes one of the major processes by which such a structure is reproduced within a generation and is the natural prelude to the other major process of reproduction between generations (Haller 1981).
2.18 The great advantage of using these measures is that, on the one hand, each is based on a specific society at a specific period, while being, on the other hand, comparable across countries and time periods. This periodic updating means there is less of a problem of dealing with structural change. Unlike class schemes, which have distinct class groupings and associated boundaries, these measures adapt to changing structure; the scores represent the relative location of an occupation in the hierarchical structure at any given time.
2.19 The CAMSIS scales have been described as 'specific' measures of relative occupational position[14]. A distinction can be made among occupation-based social classifications between 'universal' measures (which locate the same occupational titles in the same relative positions at all time points), and 'specific' measures, which allow the same occupational positions to be allocated to different relative locations at different time points (e.g. Lambert et al. 2005). In the measurement of mobility trends, the distinction noted earlier between 'absolute' and 'relative' mobility is, in fact, entirely an artefact of universal occupational measures[15]. Although approaches which use universal measures are forced to grapple with statistical methods for distinguishing relative from absolute mobility[16], we believe that studies using specific approaches have no such problem, since they generate, by definition, measures of change in relative positions.
2.20 Economists have similarly understood changes in intergenerational relative positions by estimating functions for intergenerational income 'elasticities' through regression formulations which use income measures as specific positional indicators (Ermisch et al. 2006). However, some previous authors have wrongly stated that the only available specific measures of intergenerational positions are based upon relative incomes (e.g. Blanden et al. 2004; Reed and Robinson 2005). By contrast, occupational (and other) measures of social circumstances can also be scored according to empirical estimations of specific distributions. We suggest that the elasticisties studied by economists' analyses of intergenerational income mobility are broadly comparable with our own calculations of the coefficients from simple regression models in which respondent's occupations (coded to CAMSIS scales) are predicted as a function of their parents occupations (also CAMSIS scales) and other characteristics.
2.21 Although it is well established that alternative occupation-based social classifications reveal slightly different patterns of structural inequalities (Prandy 1998), it is equally important to emphasise that broad patterns of occupational inequalities prove largely robust to alternative social classifications (Ganzeboom 2006, and see our own analysis, Figure 3)[17]. We favour CAMSIS measures of occupational positions for this research, not simply because of their difference from other schemes per se, but also because of their intrinsic capacity to measure patterns of mobility in relative terms though simple regression models which can control for age, survey, and other effects.
3. Data
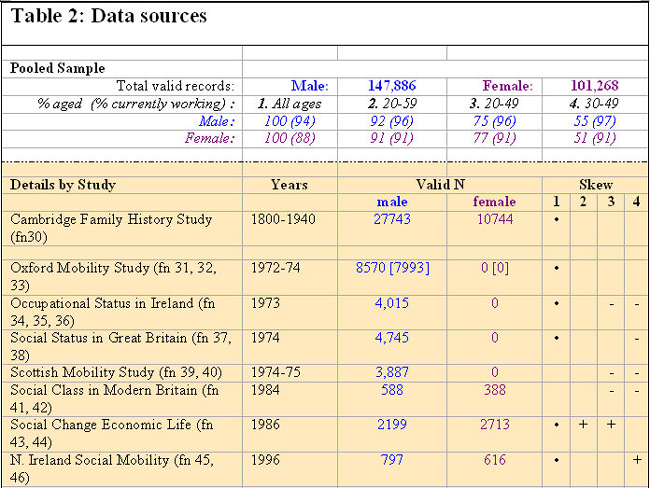
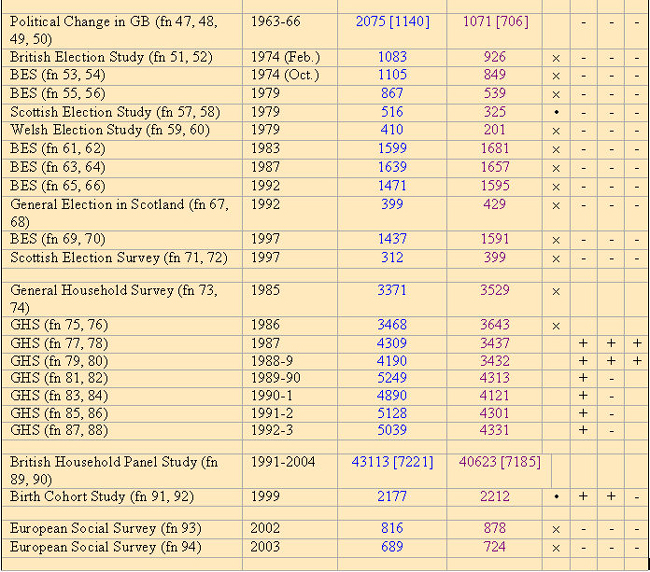
3.1 Table 2 summarises the data used in our study. We combine records from the Cambridge Family History Study dataset, with results from 31 contemporary sample surveys which included data suited to the study of intergenerational occupational mobility. Of the contemporary datasets, we have collected all those large-scale, primarily national studies that we could find that included detailed information on the occupations of fathers and children[18]. In combination with the Family History Study data, in total we have available 147,886 records from men, and 101,268 records from women, for whom both own and parental occupation was recorded[19].
   |
| Table Footnotes: 30, 31, 32, 33, 34, 35, 36, 37, 38, 39, 40, 41, 42, 43, 44, 45, 46, 47, 48, 49, 50, 51, 52, 53, 54, 55, 56, 57, 58, 59, 60, 61, 62, 63, 64, 65, 66, 67, 68, 69, 70, 71, 72, 73, 74, 75, 76, 77, 78, 79, 80, 81, 82, 83, 84, 85, 86, 87, 88, 89, 90, 91, 92, 93, 94 |
3.2 Our data is drawn predominantly from Britain, although two studies include cases from the Republic of Ireland (the Cambridge Family History Study, and 1973 the Occupational Status in Ireland survey), and four studies include records from Northern Ireland (the Cambridge Family History Study, and 1973 the Occupational Status in Ireland survey, the British Household Panel Survey after 2001, and the 1996 Northern Ireland Social Mobility survey). We explore regional effects in section 4 below, but for most purposes we refer to our results as concerning Britain.
3.3 Most of the contemporary survey records derive from national samples, although two of them are purposive: the Social Status in Great Britain project targeted a specific set of occupations, intended to cover a representative spectrum, while the Social Change and Economic Life study was carried out in six areas intended to cover different labour market conditions. We have also included records from several regional studies. There is no simple way of adjusting weights in our pooled sample in order to achieve representative samples across regions. Most often below we pool all records across regions, although in section 4 we test for separate regional differences.
3.4 While most of the contemporary surveys constitute isolated cross-sectional samples, in three of the studies we also extracted data obtained through repeated contacts with the same individuals (the Political Change in Great Britain panel, the Oxford Mobility Survey re-contacts; and the British Household Panel Study). Most of our analyses exploit cross-sectional analytical methods, and we select from each panel only one time-point record from the array of possible contacts per respondent (the earliest valid contact from the two older panels; and the most recent valid contact from the BHPS). In section 4 we also briefly report results from a simple panel model which tries to exploit the extra information garnered from the panel data re-contacts.
3.5 We also include occupational information on 27,743 men, and 10,744 women[20], from the Cambridge Family History Study, in which the great majority of cases were persons born in the nineteenth century. The majority of these spent their working lives in England, but there are cases from Scotland and Wales and a relatively small number from Ireland. These records are derived from genealogical studies conducted by people who had studied their family histories, and clearly cannot be regarded as a random sample (see Prandy and Bottero 1998; Prandy and Bottero 2000b). In many cases the data include information on several occupations throughout an individual's lifetime, so we have attempted to reconstruct the information in such a way that it is roughly comparable with data collected from a social survey. That is, for each individual we selected the occupation closest in time to the year in which he or she would have been aged 42, and the occupation for his or her father closest to the year in which that individual was aged 14. There is nevertheless a considerable age range within the FHS data.
3.6 Of course, the position of the FHS data within our pooled study is to some degree uncertain. Ermisch and Nicoletti (2005) have expressed doubt about its comparability with the later samples. We are inclined to trust its validity as a representative study of intergenerational occupational relationships for two reasons. First, its basic structural features overlap with a dataset from a comparable period constructed by Miles (1999). Second, our own analyses of contemporary studies indicate that data on patterns of social interaction (such as intergenerational mobility) prove remarkably robust to substantial sampling variations (Prandy and Lambert 2003). Nevertheless, it may help to clarify that our use of the Family History Study data in the analyses below proves to be more heuristic. The trends we observe for the twentieth century data resources are consistent in themselves. Their close overlap with trends from the FHS serves to accentuate the trends in a remarkable way. However we would have reached the same conclusions if the FHS data were excluded from all analyses.
3.7 An important feature of many of the sample surveys are differences in the age ranges covered by different studies. Those studies specifically concerned with social mobility have tended to restrict respondents to those aged between 21 and 65; however the British Election Studies cover all persons of voting age; and the General Household Studies have information on all household members, although not always coded with occupational records (Goldthorpe and Mills 2004). Our initial sample summarised in Table 2 includes records from all age ranges available, though many of our analyses are conducted on more limited age ranges.
|
4. Results
Core pattern of increasing social mobility
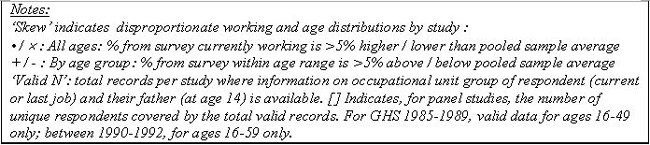
4.1 Figure 1 depicts the headline story of our analyses. We separate the male and female records into ten year birth cohorts, and, within studies, calculate the father-child CAMSIS correlation for each cohort. Figure 1 plots those correlations for all study-by-cohort combinations which are represented by more than 50 responses, and fits a weighted regression line to all of the calculated correlations (two regression lines are shown, one for the whole sample and the other excluding those records from the Family History Study).4.2 The male panel of Figure 1 shows a very clear pattern. It shows a trend towards increasing intergenerational social mobility. It also shows a remarkably consistent result: a trend line for the contemporary data coincides almost exactly with the pattern of the Family History Study records[21]. The female panel of Figure 1 shows a very similar pattern, again with a close relationship observed between the trend predicted by the contemporary data and that generated after including the FHS. The trend line for women is less steep than for men, and the scattergram points more varied, although the magnitude of the correlations for men and women is closely aligned.
4.3 At the same time, it is important to emphasise that whilst Figure 1 shows a clear trend in declining correlations over time, the decline is not particularly steep, and remains some way from reaching zero within the period of observation of our data. For example, to aid presentation we have shown the predicted correlation values of the regression lines for men and women, for cohorts hypothetically born in 1900 and in 2000. For those born in 1900, the intergenerational correlation predicted for men would be 0.44 and women 0.35; for those in born in 2000, the predicted correlations are 0.32 for men and 0.29 for women. To reiterate, this is a clear change, but, in one sense, it is also stability, since across the period the intergenerational correlation could be described as moderately strong.
4.4 Both panels of Figure 1 show the substantial variation in the estimates from the contemporary samples. It is easy to understand how such variations might have contributed to the variety of contradictory patterns reported in Table 1. Perhaps surprisingly, we have observed that the large dispersions in correlation values do not appear to be systematically related to differences between specific surveys. It is not the case that certain surveys overestimate all correlations, and others underestimate them; on the contrary estimated correlations from different cohorts within surveys show almost as much variation as do correlations between surveys[22]. However, the contribution of the Family History Study data in understanding the male and female trends is particularly important (and a unique feature to this data resource). The regression lines tell a clear story, but without the FHS records, many social scientists, on observing the scattergrams of Figure 1, would be inclined to believe the data represented little systematic trend. With the FHS, it is clear that the twentieth century trend is a remarkably close continuation of that of the nineteenth.
Methodological robustness of the core pattern
4.5 Figure 1 indicates a clear linear trend towards increasing social mobility in the UK. The remainder of our analyses are concerned with validating the trends shown in this graph. Our use of CAMSIS occupational measures on repeated cross-sectional datasets allows us to address three methodological concerns with understanding mobility trends which have not always been dealt with in previous studies. We use Figures 2-6 to try to demonstrate the robustness of our findings of a long term trend of declining social immobility.
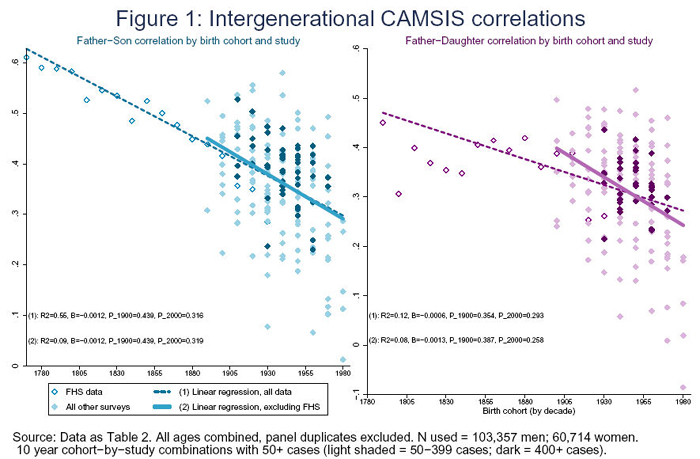
4.6 In Figure 2, we evaluate the impact of life course effects and survey effects. The graph shows, for men and women, the evolution in the predicted intergenerational effect after imposing a variety of constraints on our sample data. These constraints involve limiting the analysis to a number of different age ranges within the sample (reflecting some of the different age ranges on which previous studies have focussed), and limiting the analysis to a number of subsets of survey data collections. Within each selected sample, the graphs depict how much the predicted gain in own CAMSIS score increases for a single unit gain in father's CAMSIS score. The predictions are based upon a regression model which controls for the effect of age and predicts the father's effect as a combination of a linear main effect (always positive and significant in all models) and a linear interaction effect with year of birth (negative significant in almost all models). This interaction term is the crucial part of our analysis: when negative and significant, it indicates that the positive increment of father's CAMSIS score declines for people born in a later year (i.e., increasing social mobility).
 |
4.7 Figure 2 provides convincing evidence of robustness of the interaction term to different permutations of the data. In almost all situations, a decline in predicted values is observed which is of broadly the same magnitude. There are several other consistent observations. First, there are regional differences in mobility trends - the decline in intergenerational immobility is greater in Scotland, Wales and Northern Ireland than it is in England. Second, the broad pattern of stability is greater for men than for women (corresponding to the greater variation in scatter points for women seen in Figure 1). Third, the impact of restricting a sample to those currently working (instead of those who have ever worked) is negligible, since almost the same results are observed for the two data permutations (the second and third clusters of plots). Fourth, there are modest impacts associated with using alternative age ranges (over and above the control for age effects also present in our regression model). For men, there are minimal differences, but for women, there is a substantial decline associated with one age restriction, of limiting the sample to 30-59 year olds.
4.8 Figure 2 suggests that survey effects have some impact upon intergenerational trend estimates. For men, excluding regional differences, the most substantial departures from the core pattern of increasing mobility are observed for the subset of stratification surveys (the first seven contemporary surveys listed in Table 2, which show a greater decline than average), and for the General Household Surveys (which if isolated show less decline than average supporting the conclusions of stability in mobility rates observed by Goldthorpe and Mills 2004 from the same data). For women, excluding regional differences and the 30-59 age range, we see that the Family History Survey and British Election Surveys show on average less decline in intergenerational effects.
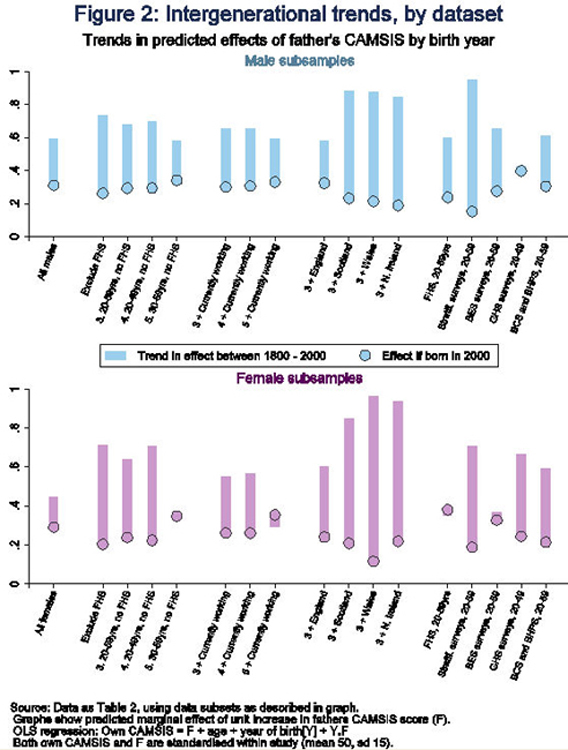
4.9 In Figure 3 we return to the issue of the measurement of stratification positions, by plotting patterns in the average father-child association according to different occupation-based social classifications. We compare trends in the average absolute intergenerational change in CAMSIS scores; the average absolute change in ISEI scores (see Ganzeboom and Treiman 1996); the average absolute proportion with different EGP seven-category class positions (the 'Total Mobility Rate' used by Goldthorpe and Mills 2004); and the cohort parameters from a 'Unidiff' association model[23] using EGP seven-category class schemes (used as an indicator of change in relative class mobility, see Breen 2004)[24].
 |
4.10 For men, the core patterns of association have a similar nature regardless of the occupation-based stratification scheme used. The coincidence between CAMSIS and ISEI-based trends is particularly close. The trend in the total mobility rate based upon the EGP 7-class scheme is also broadly aligned to that observed in the CAMSIS and ISEI measures. The trend in the unidiff parameters for men follows the same pattern as that of the other three measures for the first 150 years of the period, but might be said to decline or to stabilise in the most recent 50 years, in contrast to the pattern of continuous increase seen in the other schemes. For women, Figure 3 shows that the patterns of father-daughter occupational mobility observed using either CAMSIS or ISEI schemes are also similar, and broadly coincide with the male patterns. However there is some divergence in the trends for women using the EGP based calculations. The TMR using the EGP 7-class scheme shows no clear evidence of change over the period. On the other hand the trend in Unidiff parameters follows a sharper line than other examples. The estimates seem to suggest two periods of stability, interspersed with a short period, the 1925-1945 birth cohorts, where there is a rapid increase in social mobility rates. From Figure 3 we conclude that social mobility trends will generally tend to be robust to the type of occupation-based social classification, with the exception that the EGP scheme for women seems less consistent.
4.11 Figure 3 also illustrates another important aspect of our data: the average age of the respondents represented in our pooled dataset. Even despite the repeated cross-sectional design, it emphasises that the younger age cohorts are on average observed at younger ages than the older cohorts (this of course arises in part by definition). There is also a suggestion that the oldest cohorts from the Family History Survey are generally observed when a little younger than are the younger cohorts. In part this potential problem was addressed by the analyses contributing to Figure 2. To further examine the effects of aging on the shape of intergenerational mobility trends, in Figure 4 we present comparable trend lines to those of Figure 3, after using a crude control for the effect of aging on own occupational position, and after testing a selection of functional forms for the father-child trend in occupational associations. Firstly, Figure 4 shows that even if we adjust individual CAMSIS observations for potential age effects increments, the same patterns of trend persist. Secondly, Figure 4 shows that the basic functional form is very adequately described as linear, particularly given the coincidence of the linear and quadratic specifications for both men and women.
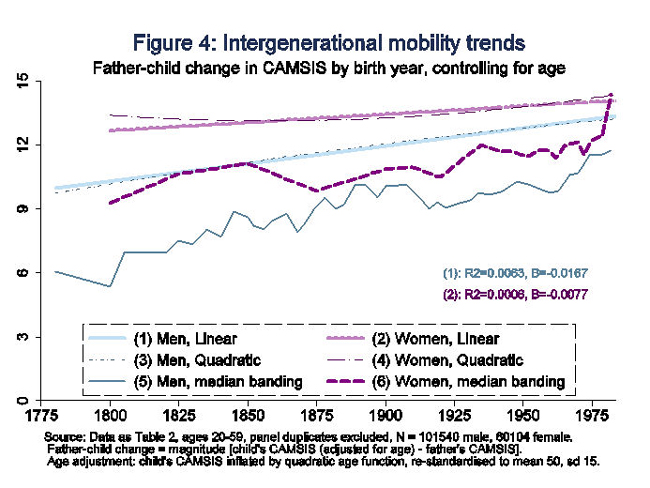 |
4.12 The optimal functional form of the mobility trend is particularly interesting, since it tells us about possible shorter term fluctuations in mobility trends. Firstly, the adequacy of the linear form (particularly the absence of a sudden quadratic increase or decrease) is strong evidence against pronounced changes in more recent cohorts (cf. the 'collapsing' of social mobility announced by Cohen 2006). Secondly, the median banding lines of Figure 4 might be taken to tell us about modest fluctuations away from the linear trend over the period, after controlling for age (these median banded lines allow for more variations in short term differences than the smoothed quadratic and linear lines). For women, the fluctuations shown are difficult to interpret, but for men, the fluctuations around the birth years 1890-1940 do seem to coincide with certain historical accounts of cohort change. First, males born around the turn of the century seem to have experienced relatively favourable opportunities. Those cohorts may have benefited, occupationally, from the social upheavals brought about by the First World War. Subsequently, males born around 1905-1925 appeared to experience something of a lull in mobility rates, potentially influenced by the labour market depression of the Thirties and the Second World War. Subsequently, mobility rates increase again, in coincidence with those born after 1925 and thus reaching adulthood in the post-war period[25].
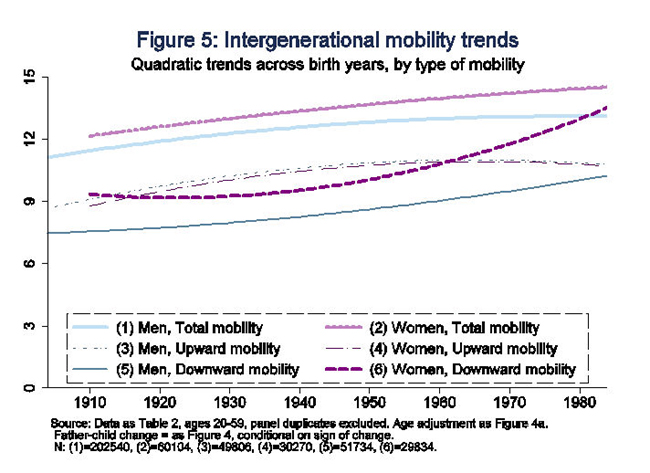
4.13 Whilst Figures 1-4 demonstrate a marked pattern of increasing social mobility over the two hundred year observation period, they direct their attention to the total magnitude of intergenerational occupational relative mobility. In the popular, normative interpretations of social mobility trends, however, the direction of any social mobility which has occurred whether upward or downward - is of greatest significance (Aldridge 2003; Swift 2004). Using CAMSIS measures of occupational position, it is straightforward to partition individuals' mobility records according to whether they were in the direction of increasing advantage for the child (upward mobility) or of reduced advantage (downward mobility). However, as a specific rather than universal measure of relative occupational advantage, there is no question of a structurally induced imbalance over time between upward and downward mobility. Instead, whatever the period, the standardisation of specific scales means that by definition the total amount of upward and downward mobility must balance out. Examined linearly, this would preclude divergent trends of increasing or decreasing upward or downward mobility. However, if we examine the magnitude of upward and downward mobility squared, we can discern whether those moving upward, compared to those moving downward, tended too make larger or smaller relative moves. We argue that this pattern of relative difference in the extent of mobility is closer to what is understood, normatively, as upward and downward mobility.
4.14 In Figure 5, we show quadratic trend patterns for mobility rates, comparing a quadratic function of total mobility, with quadratic functions of upward and downward mobility squared. The graph is restricted to the twentieth century data, to concentrate on the changing mobility profiles of greater sociological interest. The first two lines of Figure 5 correspond to those also shown in Figure 4, and suggest a linear trend of increasing mobility over the period. However lines 3 to 6 of Figure 5 prove extremely informative. They suggest that for both men and women, the extent of both upward and downward mobility has increased over the period (a result which arises by definition). However they also indicate through the quadratic trends that the increasing magnitude of upward moves has fallen off over the period, whilst the downward mobility magnitudes have increased. This is an extremely important finding. It suggests that younger cohorts tend to experience relatively more long range downward mobility than long range upward mobility, in contrast to the experience of older cohorts. Many sociological accounts have argued that protective intergenerational strategies serve cumulatively to prevent long range downward mobility (e.g. Devine 2004), but such strategies appear to be less successful than formerly.
 |
4.15 Finally, Figure 6 re-emphasises the stark finding that the trend towards increased social mobility persists across a variety of methodological controls. Here, we return to summarising the coefficients of regression models which predict current occupational CAMSIS score according to father's CAMSIS, with an interaction term between father's CAMSIS and year of birth. Figure 6 summarises the predicted impact of father's CAMSIS over a 200 year period. The light shaded bars indicate the predicted effect of a 15 unit gain in CAMSIS for those born in 1800, and the dark bars the decline in predicted effect which would have arisen for those born in 2000. In the first 3 models, we allow for different functional forms to the evolution of the interaction effect (the functional form of the trend, also examined in Figure 4). We see little difference between linear and quadratic specifications, and a small increase in the trend to increased social mobility if we allow for more variation in the year of birth effects, by using 10-year bands[26].
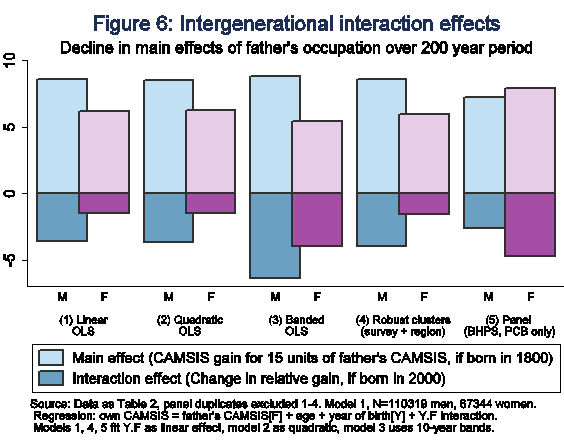 |
4.16 The last two models of Figure 6 summarise slightly more complex regression formulations. The first includes main effects for regional differences (18 dummy terms for respondent's residence in one of 18 different regions in the UK and Ireland) and variance component corrections for survey collections. Both regional and survey effects are globally significant in predicting current CAMSIS scores. However, they do not affect the story of declining mobility, generating interaction effects which are closely comparable to the first model. Finally, the fifth model of Figure 6 deals with a slightly different sample. It includes only the panel data records from two surveys, the British Household Panel Study and Political Change in Great Britain. It includes all valid responses from these surveys (including repeated records for respondents) and estimates a population averaged panel model to the regression prediction (including controls for age, region and survey). The motivation for this model is that a more detailed panel model can control for residual heterogeneity between observations and thus may eliminate some of the other patterns of trend over the time period which could be conflated with intergenerational occupational mobility trends (we should be cautious here that we are only scratching the surface of the modelling possibilities and controls associated with this data). For men, the mobility trends from the panel data are similar, though a little smaller (perhaps in agreement with Ermisch and Nicoletti's 2005 findings of no strong evidence of mobility trends using BHPS data). For women, the trends are similar to those of other models, but slightly higher.
5. Conclusions
5.1 There have been numerous conflicting reports of trends in inter-generational mobility in Britain. In this article we have argued that when extended data resources are exploited, in combination with analytical methods which control for life course effects and other data structures, we can see remarkably consistent patterns of trend in social mobility rates over the last two hundred years. The trend of slowly increasing social mobility is particularly stable for men, and is also clear, though less stable, for women. Equally, intergenerational inequalities persist, and, given the current trajectory of the rate of change, can be expected to continue to do so for some time to come. Indeed, the slow rate of change can easily explain why many studies that looked at relatively short time periods do not find evidence of significant differences.5.2 Our findings support a growing recent literature which has acknowledged the possibility of rising social mobility rates in the twentieth century (esp. Heath and Payne 2000; Payne and Roberts 2002), and they concord with several historical studies form the nineteenth century (esp. Miles 1999). However they contradict both the 'constant flux' and 'tightening up' hypotheses on social mobility trends. These contradictions are significant, because the latter two hypotheses have proved highly influential in political and social policy formulations (esp. Aldridge 2001; Kelly 2005). One feature of our findings was evidence of a relative growth in long-range downward mobility in recent decades, and a relative decline in long-range upward mobility (see Figure 5). Such patterns have considerable normative significance, yet they are denied by the dominant models of stable or declining social mobility.
5.3 Another unfortunate influence of the 'constant flux' and 'tightening up' hypotheses may prove to be the relative abundance of sociological literature in Britain which offers explanations for trends of stability or increasing closure (cf. Goldthorpe 2005), contrasted to more limited attention to possible explanations for increasing social mobility[27]. The best known explanations of increasing mobility are associated with functionalist theories, whereby the logic of modern capitalism is expected to promote meritocracy and by implication social mobility (Blau and Duncan 1967). However, the rate of increasing mobility that we observe is too small, and its origins too longstanding, to be satisfactorily explained by functionalist theories[28]. Alternatively, many authors have anticipated that the most likely explanations for changing patterns of mobility (of any nature) lie with changing intergenerational influences on the educational system (e.g. Arrow et al. 2003; Breen 2004). Our dataset also includes information of the educational attainment of respondents, and in a forthcoming paper we evaluate the changing interactions between parental occupation, educational attainment and occupational outcomes[29].
5.4 Although our attention has focussed upon checking the empirical evidence on social mobility trends, there is clearly room for further speculation over increasing rates of social mobility in Britain. At present, our evidence of such long term trends of increasing social mobility is, in many ways, something of a puzzle. Further examination of the occupational data from the Family History Study suggests that in the nineteenth century the major channels of upward mobility were those of entrepreneurship, in services, manufacturing and construction. Education, or at least formal qualification, would seem to play a very minor part in these processes and it is only for those born at the very end of the century that these channels were beginning to be replaced by organisational advancement and the professions. Thus, we suspect that the clear overall trend might not be a consequence of a similar trend in any single determining factor. Rather, it could be the case that declining occupational opportunities via the entrepreneurial route were first offset by increasing chances through the educational one (then perhaps, later in the twentieth century, offset by other influences on occupational attainment). Two major milestones in educational reforms were the introduction of compulsory schooling to age 13 in 1870, and the provision of a proportion of non-fee-paying secondary school places in 1907. Our results suggest that previous sociological publications may have been wrong to cast doubt upon the effectiveness of these changes in fostering upward social mobility. These and other speculative conclusions illustrate the rich explanatory potential which we suggest arises from the fundamental re-orientation to understanding social mobility processes which, we contend, should follow from accepting our evidence of rising social mobility rates, and rejecting the hitherto dominant models of stability and declining rates.
5.5 Whilst we emphasise the robustness of our empirical findings, there are inevitably further methodological questions. For instance, our analyses do not include sophisticated attention to missing data across the samples (we use listwise deletion of cases without valid occupational records). The robustness of this missing-at-random assumption could be further explored, although we anticipate that its impact on the regression functions we study will be limited. Additionally, our analyses do not confront the sample selection concerns related to the non-random distribution of father's occupational positions (father's records being selected conditional on having an adult child with a valid occupational record). Payne (2003) suggests the broad robustness of mobility analysis to this sample selection, but Ermisch and Nicoletti's (2005) analysis suggests that these effects may have small influences. Ermisch and Nicoletti's response is to restrict their attention to a recent dataset which includes sufficient records to allow for a model of sample selection effects. We anticipate that their conclusions are therefore compromised by the restricted time period of coverage of their resource. There is no easy resolution to this tension.
5.6 Finally, though, we return to the point that in Britain the change in impact of parental occupational background has proceeded at a funereal pace, albeit a steady one. 'Perfect' occupational mobility, like other forms of perfection, is, as the quotation from Voltaire at the head of this article suggests, attained only by slow degrees; certainly in the case of Britain it does, indeed, require the hand of time and in considerable measure.
Acknowledgement
The data analysed in this paper was provided by the UK Data Archive, <http://www.data-archive.ac.uk>, the Cambridge Family History Project, and by the European Social Survey, <http://www.europeansocialsurvey.org>. Research for this paper was assisted by ESRC research awards R000238265 and R000223899. We thank Vernon Gayle and Marge Unt for helpful comments on this paper.
Notes
1 See for instance the adoption of these findings by two national newspaper columnists: "Study after study indicates that social mobility is at a standstill like never before" (Ellen, 2005), and "Although there are no figures that measure the impact of the Labour government, all the information we have from before 1997 shows that social mobility is collapsing in Britain" (Cohen, 2006).2 These data are used below. Prandy and Bottero (2000) concluded that the patterns of mobility for the twelve ten-year birth cohorts from 1790 to 1909 could be represented by just two models, which allowed for a weakening of the effects of father's social position on that of the son for cohorts after 1880 as compared with those before. However, inspection of actual values of the father-son correlation for succeeding cohorts (see figure 1 below) suggests that another interpretation, that of a fairly steady decline, is also possible. In effect, the change in value is so slow that only the difference between the early and late periods shows up as statistically significant, despite the relatively large numbers (around 2,000 for each cohort).
3 These three issues are broadly equivalent to those identified by Ermisch and Nicoletti (2005).
4 Ermisch and Nicoletti (2005) argue that a further account for aging effects is required, using panel data to control for the endogeneity of stratification measures to life course differences.
5 Ermisch and Nicoletti (2005) express sufficient doubt over the comparability of repeated cross-sectional data over longer periods of time that they favour an approach which uses a single panel survey, covering a far shorter total time period than would have been available from a meta-analysis of unrelated cross-sectional studies.
6 In the UK, sociological researchers are particularly fortunate in that the transparent access to documentation and micro-data resources provided by the UK Data Archive <http://www.data-archive.ac.uk/> allows for high standards of data evaluation (Dale 2006).
7 We coded respondents' occupations according to the current or last main reported job of the individual. This individualist measure ignores any information on a respondent's household sharers, which can be relevant to understanding social inequalities. However it is widely regarded as the more appropriate strategy when analysing, as we do, patterns of male and female mobility separately (e.g. Sorensen 2005). On the other hand we coded origin occupations on the basis of the reported father's occupation when the respondent was aged approximately fourteen. Data based only on the father's occupation has been empirically demonstrated to lead to robust indicators of parental occupational circumstances (e.g. Erikson and Goldthorpe 1992b), and is widely used in comparable studies.
8 We do however include records from two sweeps of the European Social Survey where the quality of occupational data is questionable. In this survey, parental occupational information is available only in the form of free text verbatim responses to an open question on the occupational title. We coded these responses manually using the CASCOT software <http://www2.warwick.ac.uk/fac/soc/ier/publications/software/cascot/>. Many of the textual descriptions of parental occupational positions on this survey were ambiguous, resulting in high levels of missing data on this study.
9 Unfortunately the lack of access to detailed occupational records ruled out our exploitation of some surveys which may otherwise have contributed to our database. In particular we were unable to incorporate the Glass 1949 survey (Glass 1954) study; the National Child Development Survey <http://www.data-archive.ac.uk/findingData/ncdsTitles.asp>; the FWLS <http://www.data-archive.ac.uk/findingData/snDescription.asp?sn=3704>; the 1992 Employment in Britain Survey <http://www.data-archive.ac.uk/findingData/snDescription.asp?sn=5368>; and the Scottish Household Survey of 2001 <http://www.data-archive.ac.uk/findingdata/snDescription.asp?sn=5031> . Additionally, certain other survey records, used in previous mobility studies, have to the authors' best knowledge been destroyed altogether, including the occupational records used by Townsend (1979) and Richardson (1977).
10 The occupational translations we used are available from <http://www.camsis.stir.ac.uk/occunits/distribution.html>. We also used the derivation tools provided by Ganzeboom (2006).
11 One point to bear in mind is that issues in coding occupational mean that the values generated by our analyses are almost certainly lower bounds on the actual figures. Errors in recording, coding and measuring occupations are far more likely to work in the direction of introducing random errors that weaken relations. Moreover, single observations of occupations at a point in time are in many ways unsatisfactory (Miller 1998) and much more extensive information on the work-life patterns of both fathers and children would allow a more accurate picture to be built up (Prandy and Bottero 2000b).
12 Goldthorpe (2005) argues convincingly that research into trends in social mobility has benefited from higher than average methodological standards. Such a claim might seem difficult to maintain in the light of the variations in results between alternative studies which are reported in Table 1. However it is our view that the limited magnitude of the time trend we report will always be vulnerable to measurement errors. Precisely because many previous studies have documented at length the sampling procedures, and age range limitations, employed in their studies, it is possible to understand and justify many of the conflicting findings indicated in the table.
13 For Erikson, Goldthorpe, Portacarrero; also known as the 'CASMIN' or 'Goldthorpe' scheme.
14 Or a good proxy to 'specific' scales. Ideally, a different CAMSIS scale would be estimated for every time point of observation for respondents' and fathers' occupations. This is overly demanding. Instead only six different scales are available to span the period under study. However we regard the CAMSIS measures as suitably specific because, first, we also standardise around sample averages within most analyses; and, second, because there is a high correlation between different specific CAMSIS scales (e.g. Prandy and Lambert 2003).
15'Structural' mobility can only occur when the overall occupational distributions of parents and children are different. This is possible in a universal scheme (where both distributions are defined against an absolute standard), but should not arise in a fully developed specific scheme, since both parents and children's occupational distributions are effectively standardised within their own populations.
16 Moreover several authors have recently emphasised the normative significance of 'absolute' as well as 'relative' mobility, e.g. Breen (2004); Breen and Jonsson (2005). Such perspectives lead to complex attempts to summarise trends in both types of mobility.
17 Ermisch et al. (2006) note that an occupational measure of parental circumstances correlates closely in its intergenerational patterns with detailed estimations of parental income.
18 Unfortunately several more recent national surveys have not collected data on parental occupations (see Goldthorpe and Mills 2004). Over the last decade, only the BHPS offers recent large scale nationally representative samples with detailed records on parental occupations.
19 All of the contemporary studies may be accessed by other researchers, through the UK Data Archive or the European Social Survey. The extended command files (using SPSS and Stata software) which were used to harmonise these surveys are available for inspection by interested readers upon request to the second author.
20 One problem with the FHS data is that women's employment in the period of study, and even more the recording of it in the records used to construct the study, was less common (see Bottero and Prandy 2001). Many of the women's occupations are those recorded at or before marriage, rather than at a point in their life comparable to that of their father in her late childhood. Many others are occupations recorded following widowhood. Patterns of female, and particularly married women's, employment also changed over the period. We are therefore hesitant about the FHS data on women's occupations. Nevertheless the general pattern that it suggests seems to offer continuity with later samples (see section 4).
21 It is not inexplicable that the contemporary and total sample regressions coincide, because the contemporary sample could simply be dominating the regression. However, the descriptive coincidence between the contemporary regression and the FHS data points is evidence of a remarkable regularity.
22 For example, if we treat each survey as a separate cluster and decompose the variance in an unweighted regression model with the correlation predicted by cohort, we observe an intra-cluster correlation associated with clustering patterns of the surveys of only 0.15 for men, and 0.02 for women. The lack of systematic variations by studies can also be seen if study identifiers are added to the scattergrams of Figure 1, though we do not show them here for ease of presentation.
23 Model estimation used the lEM freeware (Vermunt 1997; <http://www.uvt.nl/faculteiten/fsw/organisatie/departementen/mto/software2.html>). We experimented with a variety of model specifications (including slightly different ranges of data, and alternative design matrices for occupational inheritance and sectors). 10 year averages are used to avoid sparsity problems in the EGP 7-class scheme over the period. For men alternative models yielded comparable Unidiff parameters across cohorts. For women, different model specifications led to more variation in findings, and many models did not estimate satisfactorily. The model results shown, for both men and women, were achieved by using a design matrix which excluded diagonal inheritance and the farmer/farm labourer cells, and was limited to birth cohorts from 1805 onwards. Moreover, for women, we merged the data for the first five birth cohorts (note the horizontal line for these points in Figure 3). This was necessary because the pattern of father-daughter occupational class association in the earlier periods was heavily structured by the extreme class clustering of female occupations in the period. Indeed it might be concluded that the EGP scheme's categorical boundaries act to prevent satisfactory analysis of genuine differences between women in this period.
24 In Figure 3, the lines for the CAMSIS and ISEI schemes are calculated as linked median bands for yearly averages of the magnitude of father-child scale score differences (typically between 500 and 100 adult records per birth year). Both the CAMSIS and ISEI scales are standardised to mean 50, standard deviation 15. The points for the TMR plot represent the average proportion of records not placed in the same EGP class category as their parents (multiplied by 5 for ease of presentation). The points of the Unidiff plots represent the estimated parameters for each 10-year birth cohort from a 'unidiff' model (plus 1 or 0.6 for men and women, and multiplied 5, for ease of presentation).
25 This particular fluctuation in male birth cohort patterns is especially relevant, because it coincides substantially within the population covered by Glass' 1949 study. Therefore, our figures would easily support his conclusion that there was no trended change in mobility for this period. But in our analysis, by using longer term data, we are able to anticipate that this stability reflects a brief fluctuation away from the enduring pattern of long-term trend.
26 Although not shown, the coefficients of the 10-year banded effects of the interaction term are of the expected order, increasingly negative over the period.
27 Of course, the incremental nature of the slow degrees of change in social mobility rates which we observe mean that many of the theoretical explanations for stability in social mobility rates might equally be adjusted only slightly to provide an adequate account of mildly increasing mobility rates.
28 A different explanation for increasing mobility could concern long term trends in family formation patterns. Noting that intergenerational associations are observed to be weaker for children who do not grow up with two natural parents, Sorensen expects that "as fewer children grow up in two-parent families, the intergenerational mobility pattern would move in the direction of more openness" (2005: 122).
29 Interestingly, and perhaps surprisingly, our preliminary findings are that changing educational distributions do not fully account for the observed increase in social mobility rates over the twentieth century.
30 Prandy and Bottero (2000b).
31 University of Oxford, Oxford Social Mobility Group (1978), and Goldthorpe and Llewellyn (1979).
32 <http://www.data-archive.ac.uk/findingdata/snDescription.asp?sn=1097>
33 <http://www.data-archive.ac.uk/findingData/snDescription.asp?sn=1358>
34 Jackson (1975) and Miller and Jackson (1984)
35 <http://www.data-archive.ac.uk/findingdata/snDescription.asp?sn=240>
36 <http://www.data-archive.ac.uk/findingData/snDescription.asp?sn=1201>
38 <http://www.data-archive.ac.uk/findingData/snDescription.asp?sn=1369>
40 <http://www.data-archive.ac.uk/findingData/snDescription.asp?sn=981>
42 <http://www.data-archive.ac.uk/findingData/snDescription.asp?sn=2718>
44 <http://www.data-archive.ac.uk/findingData/snDescription.asp?sn=2798>
46 <http://www.data-archive.ac.uk/findingdata/snDescription.asp?sn=3928>
48 <http://www.data-archive.ac.uk/findingData/snDescription.asp?sn=1090>
49 <http://www.data-archive.ac.uk/findingData/snDescription.asp?sn=1091>
50 <http://www.data-archive.ac.uk/findingData/snDescription.asp?sn=1092>
52 <http://www.data-archive.ac.uk/findingData/snDescription.asp?sn=359>
54 <http://www.data-archive.ac.uk/findingData/snDescription.asp?sn=666>
56 <http://www.data-archive.ac.uk/findingData/snDescription.asp?sn=1533>
58 <http://www.data-archive.ac.uk/findingData/snDescription.asp?sn=1604>
59 Balsom and Madgwick (1981).
60 <http://www.data-archive.ac.uk/findingData/snDescription.asp?sn=1591>
62 <http://www.data-archive.ac.uk/findingData/snDescription.asp?sn=2005>
64 <http://www.data-archive.ac.uk/findingData/snDescription.asp?sn=2568>
66 <http://www.data-archive.ac.uk/findingData/snDescription.asp?sn=2981>
68 <http://www.data-archive.ac.uk/findingData/snDescription.asp?sn=3171>
70 <http://www.data-archive.ac.uk/findingData/snDescription.asp?sn=3887>
72 <http://www.data-archive.ac.uk/findingData/snDescription.asp?sn=3889>
74 <http://www.data-archive.ac.uk/findingData/snDescription.asp?sn=2349>
76 <http://www.data-archive.ac.uk/findingData/snDescription.asp?sn=2569>
78 <http://www.data-archive.ac.uk/findingData/snDescription.asp?sn=2679>
80 <http://www.data-archive.ac.uk/findingData/snDescription.asp?sn=2724>
82 <http://www.data-archive.ac.uk/findingData/snDescription.asp?sn=2832>
84 <http://www.data-archive.ac.uk/findingData/snDescription.asp?sn=2937>
86 <http://www.data-archive.ac.uk/findingData/snDescription.asp?sn=2986>
88 <http://www.data-archive.ac.uk/findingData/snDescription.asp?sn=3166>
89 University of Essex (2006).
90 <http://www.data-archive.ac.uk/findingdata/snDescription.asp?sn=5151>
91 Joint Centre for Longitudinal Research (2003).
92 <http://www.data-archive.ac.uk/findingData/snDescription.asp?sn=4396>
93 <http://www.europeansocialsurvey.org/>
94 <http://www.europeansocialsurvey.org/>
References
ABBOTT, A. (2006) 'Mobility: What? When? How?', in S.L. Morgan, D.B. Grusky and G.S. Fields (editors) Mobility and Inequality. Stanford: Stanford University Press.ALDRIDGE, S. (2001) Social Mobility: A discussion paper. London: Performance and Innovation Unit.
ALDRIDGE, S. (2003) 'The facts about social mobility', New Economy, Vol. 10, No. 4, pp. 189-193.
ALT, J., CREWE, I.M. and SARLVIK, B. (1976) British Election Study, February 1974; Cross-Section Survey [computer file]. Colchester, Essex: UK Data Archive [distributor]. SN: 359.
ARROW, K., BOWLES, S. and DURLAUF, S. (2000) Meritocracy and Economic Inequality. Princeton: Princeton University Press.
BALSOM, D. and MADGWICK, P.J. (1981) Welsh Election Study, 1979 [computer file]. Colchester, Essex: UK Data Archive [distributor]. SN: 1591.
BECHHOFER, F. (1969) 'Occupations', in M. Stacey (editor) Comparability in Social Research, London: Heinemann.
BLAIR, T. (2006) Appointment: Secretary of State for Communities and Local Government. Letter from the Prime Minister to Ruth Kelly, 9 May 2006. <http://www.communities.gov.uk/index.asp?id=1165650>
BLACKBURN, R.M., STEWART, A. and PRANDY, K. (1980) Social Status in Great Britain, 1974 [computer file]. Colchester, Essex: UK Data Archive [distributor]. SN: 1369.
BLANDEN, J. and GREGG, P. (2004) 'Family income and educational attainment: A review of approaches and evidence for Britain', Oxford Review of Economic Policy, Vol. 20, No. 2, pp. 245 263.
BLANDEN, J., GOODMAN, A., GREGG, P. and Machin, S. (2004) 'Changes in generational mobility in Britain', in M. Corak (editor) Generational Income Mobility in North America and Europe. Cambridge: Cambridge University Press.
BLANDEN, J., GREGG, P. and MACHIN, S. (2005) Intergenerational Mobility in Europe and North America: A Report Supported by the Sutton Trust. London: Centre for Economic Performance.
BLAU, P.M. and DUNCAN, O.D. (1967) The American Occupational Structure. New York: Wiley.
BOTTERO, W. and PRANDY, K. (2001) 'Women's occupations, mobility and the social order', Sociological Research Online, Vol. 6, No. 2, <http://www.socresonline.org.uk/6/2/bottero.html>.
BRAND, J.A. and MITCHELL, J.C. (1994) General Election in Scotland, 1992 [computer file]. Colchester, Essex: UK Data Archive [distributor], March 1994. SN: 3171.
BREEN, R. (1998) Northern Ireland Social Mobility Survey, 1996 [computer file]. Colchester, Essex: UK Data Archive [distributor], November 1998. SN: 3928.
BREEN, R. (2003) 'Class inequality and social mobility in Northern Ireland, 1973 to 1996', American Sociological Review, Vol. 65, No. 3, pp. 392-406.
BREEN, R. (editor) (2004) Social Mobility in Europe. Oxford: Oxford University Press.
BREEN, R. and GOLDTHORPE, J.H. (2001). 'Class, mobility and merit: The experience of two British birth cohorts', European Sociological Review, Vol. 17, No. 2, pp. 81 101.
BREEN, R. and JONSSON, J.O. (2005) 'Inequality of Opportunity in Comparative Perspective', Annual Review of Sociology, Vol. 31, pp. 223-243.
BREEN, R. and LUIJKX, R. (2004) 'Social mobility in Europe between 1970 and 2000', in R. Breen (editor) Social Mobility in Europe. Oxford: Oxford University Press.
BUTLER, D.E. and STOKES, D.E. (1969) Political Change in Britain. London: MacMillan.
COHEN, N. (2006) It's time to tackle class in sport. The Observer, 8 October 2006.
CREWE, I.M., ROBERTSON, D.R. and SARLVIK, B. (1977) British Election Study, October 1974; Cross-Section Survey [computer file]. Colchester, Essex: UK Data Archive [distributor]. SN: 666
CREWE, I.M., ROBERTSON, D.R. and SARLVIK, B. (1981) British Election Study, May 1979; Cross-Section Survey [computer file]. Colchester, Essex: UK Data Archive [distributor]. SN: 1533.
DALE, A. (2006) 'Quality Issues with Survey Research', International Journal of Social Research Methodology, Vol. 9, No. 2, pp. 143 - 158.
DEVINE, F. (2004) Class Practices: How parents help their children get good jobs. Cambridge: Cambridge University Press.
EGERTON, M. and SAVAGE, M. (2001) 'Age stratification and class formation: A longitudinal study of the social mobility of young men and women, 1971-1991', Work Employment and Society, Vol. 14, No. 1., pp. 23-49.
ELLEN, B. (2005) Nepotism, talent, good looks The Observer, 7 August 2005.
ERIKSON, R. and GOLDTHORPE, J.H. (1992a) The Constant Flux: A study of class mobility in industrial societies. Oxford: Clarendon Press.
ERIKSON, R. and GOLDTHORPE, J.H. (1992b) 'Individual or family? Results from two approaches to class assignment', Acta Sociologica, Vol. 35, No. 2, pp. 95 - 105.
ERIKSON, R. and GOLDTHORPE, J.H. (1992c) 'The CASMIN project and the American dream', European Sociological Review, Vol. 8, No. 3, pp. 283 - 305.
ERMISCH, J. and FRANCESCONI, M. (2004) 'Intergenerational mobility in Britain: New evidence', in M. Corak (editor) Generational Income Mobility in North American and Europe. Cambridge: Cambridge University Press.
ERMISCH, J., FRANCESCONI, M. and SIEDLER, T. (2006) 'Intergenerational mobility and marital sorting', The Economic Journal, Vol. 116, July, pp. 659-679.
ERMISCH, J. and NICOLETTI, C. (2005) Intergenerational earnings mobility: Changes across cohorts in Britain. ISER Working Paper 2005-19. Colchester: University of Essex. <http://iserwww.essex.ac.uk/pubs/workpaps/>
FIREBAUGH, G. (1997) Analyzing Repeated Surveys. Newbury Park, Ca.: Sage.
GALLIE, D. (1991) Social Change and Economic Life Initiative Surveys, 1986-1987 [computer file]. Colchester, Essex: UK Data Archive [distributor], June 1991. SN: 2798.
GANZEBOOM, H.B.G. (2006) Tools for Deriving Status Measures from ISKO-88 and ISCO-68. Amsterdam: Amsterdam University. <http://home.fsw.vu.nl/~ganzeboom/PISA/>.
GANZEBOOM, H.B.G., LUIJKX, R. and TREIMAN, D.J. (1989) 'Intergenerational class mobility in comparative perspective', Research in Social Stratification and Mobility, Vol. 8, pp. 3-84.
GANZEBOOM, H.B.G. and TREIMAN, D.J. (1996) 'Internationally Comparable Measures of Occupational Status for the 1988 International Standard Classification of Occupations', Social Sciences Research, Vol. 25, No. 3, pp. 201 235.
GERSHUNY, J. (2002a) Beating the Odds (1): Inter-generational Social Mobility from a Human Capital Perspective. ISER Working Paper 2002-17. Colchester: University of Essex. <http://www.iser.ac.uk/pubs/workpaps/>.
GERSHUNY, J. (2002b) Beating the Odds (2): A New Index of Intergenerational SocialMmobility. ISER Working Paper 2002-17. Colchester: University of Essex. <http://www.iser.ac.uk/pubs/workpaps/>.
GLASS, D.V. (1954) Social Mobility in Britain. London: Routledge.
GOLDTHORPE, J.H. (1980) Social Mobility and Class Structure in Modern Britain. Oxford: Oxford University Press.
GODTHORPE, J.H. (2005) 'Progress in sociology: The case of social mobility research', in S. Svallfors (editor) Analyzing Inequality. Stanford: Stanford University Press.
GOLDTHORPE, J.H. and LLEWELLYN, C. (1979) Occupational and Social Mobility, 1974 [computer file]. Colchester, Essex: UK Data Archive [distributor]. SN: 1358.
GOLDTHORPE, J.H. and HOPE, K. (1974) The Social Grading of Occupations. Oxford: Clarendon Press.
GOLDTHORPE, J.H. and MCKNIGHT, A. (2006) 'The economic basis of social class', in Morgan, S.L., Grusky, D.B. and Fields, G.S (editors) Mobility and Inequality. Stanford: Stanford University Press.
GOLDTHORPE, J.H. and MILLS, C. (2004) 'Trends in Intergenerational Class Mobility in Britain in the Later Twentieth Century', in R. Breen (editor) Social Mobility in Europe. Oxford: Oxford University Press.
GOLDTHORPE, J.H. and PAYNE, C. (1986) 'Trends in intergenerational class mobility in England and Wales, 1972-1983', Sociology Vol. 20, No. 1, pp. 1 24.
HALLER, M. (1981) 'Marriage, women, and social stratification: a theoretical critique', American Journal of Sociology, Vol. 86, No. 4, pp. 766 795.
HARKNESS, J., VAN DE VIJVER, F. J. R., and MOHLER, P.Ph. (2003) Cross-Cultural Survey Methods. New York: Wiley.
HAUSER, R.M., WARREN, J.R., HUANG, M-H., and CARTER, W.Y. (2000) 'Occupational status, education, and social mobility in the meritocracy', in K. Arrow, S. Bowles, and S. Durlauf (editors) Meritocracy and Economic Inequality. Princeton: Princeton University Press.
HEATH, A., JOWELL, R. and CURTICE, J.K.(1983) British General Election Study, 1983; Cross-Section Survey [computer file]. Colchester, Essex: UK Data Archive [distributor]. SN: 2005.
HEATH, A., JOWELL, R. and CURTICE, J.K. (1993a) British General Election Study, 1987; Cross-Section Survey [computer file]. 2nd Edition. Colchester, Essex: UK Data Archive [distributor], April 1993. SN: 2568.
HEATH, A., MILLS, C. and ROBERTS, J. (1992) 'Towards meritocracy? Recent evidence on an old problem', in C. Crouch and A.F. Heath (editors) Social Research and Social Reform, Oxford: Clarendon Press.
HEATH, A. and PAYNE, C. (2000) 'Social mobility', in Halsey, A.H. and Webb, J. (editors) Twentieth Century British Social Trends. London: MacMillan Press.
HEATH, A. et al. (1993b) British General Election Study, 1992; Cross-Section Survey [computer file]. Colchester, Essex: UK Data Archive [distributor], April 1993. SN: 2981.
HEATH, A. et al. (1999) British General Election Study, 1997; Cross-Section Survey [computer file]. 2nd Edition. Colchester, Essex: UK Data Archive [distributor], May 1999. SN: 3887.
HOUT, M. and HAUSER, R.M. (1992) 'Symmetry and hierarchy in social mobility: a methodological analysis of the CASMIN model of class mobility', European Sociological Review, Vol. 8, No. 3, pp. 239 - 266.
JACKSON, A.J. (1975) Determinants of Occupational Status and Mobility in Northern Ireland and the Irish Republic, 1973; Phase 1 Data, Census File [computer file]. Colchester, Essex: UK Data Archive [distributor]. SN: 240.
JOINT CENTRE FOR LONGITUDINAL RESEARCH (2003) National Child Development Study and 1970 British Cohort Study (BCS70) Follow-ups, 1999-2000 [computer file]. 2nd Edition. Colchester, Essex: UK Data Archive [distributor], January 2003. SN: 4396.
JONSSON, J.O. and MILLS, C. (1993) 'Social mobility in the 1970s and 1980s: a study of men and women in England and Sweden', European Sociological Review, Vol. 9, pp. 229 - 248.
KAELBLE, H. (2001) 'Social Mobility, History of', in N.J. Smelser and P.B. Baltes (editors) International Encyclopaedia of the Social and Behavioural Sciences. Oxford: Elsevier Science.
KELLY, R. (2005) Equity and Excellence: Education and Social Mobility. A Keynote speech by Ruth Kelly MP, Secretary of State for Education and Skills. London: IPPR (26th July 2005). <http://www.ippr.org.uk/events/index.asp?id=1631>.
LAMBERT, P.S., PRANDY, K. and BERGMAN, M.M. (2005) 'Specificity and Universality in Occupation Based Social Classifications'. Paper presented to First meeting of the European Association for Survey Research, Barcelona, 18-22 July 2005. Direct download <http://www.staff.stir.ac.uk/paul.lambert/downloads/lpb_barcelona_19jul05.pdf>
MACDONALD, K. and RIDGE, J. (1988) 'Social Mobility', in A.H. Halsey (editor) British Social Trends since 1900. London: MacMillan Press.
MACHIN, S. and GREGG, P. (2003) 'A Lesson for Education: University Expansion and Falling Income Mobility', New Economy, Vol. 10, No. 4, pp. 194 - 198.
MACHIN, S. and VIGNOLES, A. (2004) 'Educational inequality: The widening socio-economic gap', Fiscal Studies, Vol. 25, No. 2, pp. 107 128.
MCCRONE, D. et al. (1999) Scottish Election Survey, 1997 [computer file]. 2nd Edition. Colchester, Essex: UK Data Archive [distributor], June 1999. SN: 3889.
MILES, A. (1993) 'How open was nineteenth-century British society? Social mobility and equality of opportunity, 1839-1914' in A. Miles and D. Vincent (editors) Building European Society. Manchester: Manchester University Press.
MILES, A. (1999) Social Mobility in Nineteenth and Early Twentieth-Century England. Basingstoke: Palgrave.
MILES, A. and VINCENT, D. (editors) (1993) Building European Society. Manchester: Manchester University Press.
MILLER, R.L. (1998) 'The limited concerns of social mobility research', Current Sociology, Vol. 46, No. 2, pp. 145 - 163.
MILLER, R.L. and JACKSON, A.J. (1984) Determinants of Occupational Status and Mobility in Northern Ireland and the Irish Republic, 1973-1974; Phase II Data [computer file]. Colchester, Essex: UK Data Archive [distributor]. SN: 1201.
MILLER, W.L. and BRAND, J.A. (1981) Scottish Election Study, 1979 [computer file]. Colchester, Essex: UK Data Archive [distributor]. SN: 1604
MOORE, R. and PAYNE, G. (1977) Scottish Mobility Study, 1974-1975 [computer file]. Colchester, Essex: UK Data Archive [distributor]. SN: 981.
MORGAN, S.L., GRUSKY, D.B. and FIELDS, G.S. (editors) (2006) Mobility and Inequality. Stanford: Stanford University Press.
NOBLE, T. (1995) 'Occupational mobility and social change in Britain', Hitisubashi Journal of Social Studies,Vol. 27, pp. 65-90.
OFFICE OF POPULATION CENSUSES AND SURVEYS [OPCS], Social Survey Division (1988) General Household Survey, 1985 [computer file]. Colchester, Essex: UK Data Archive [distributor], April 1988. SN: 2349.
OFFICE OF POPULATION CENSUSES AND SURVEYS [OPCS], Social Survey Division (1989a) General Household Survey, 1986 [computer file]. Colchester, Essex: UK Data Archive [distributor], February 1989. SN: 2569.
OFFICE OF POPULATION CENSUSES AND SURVEYS [OPCS], Social Survey Division (1989b) General Household Survey, 1987 [computer file]. Colchester, Essex: UK Data Archive [distributor], January 1989. SN: 2679.
OFFICE OF POPULATION CENSUSES AND SURVEYS [OPCS], Social Survey Division (1990) General Household Survey, 1988-1989 [computer file]. Colchester, Essex: UK Data Archive [distributor], November 1990. SN: 2724.
OFFICE OF POPULATION CENSUSES AND SURVEYS [OPCS], Social Survey Division (1991) General Household Survey, 1989-1990 [computer file]. Colchester, Essex: UK Data Archive [distributor], August 1991. SN: 2832.
OFFICE OF POPULATION CENSUSES AND SURVEYS [OPCS], Social Survey Division (1992) General Household Survey, 1990-1991 [computer file]. Colchester, Essex: UK Data Archive [distributor], October 1992. SN: 2937.
OFFICE OF POPULATION CENSUSES AND SURVEYS [OPCS], Social Survey Division (1993) General Household Survey, 1991-1992 [computer file]. Colchester, Essex: UK Data Archive [distributor], April 1993. SN: 2986.
OFFICE OF POPULATION CENSUSES AND SURVEYS [OPCS], Social Survey Division (1994) General Household Survey, 1992-1993 [computer file]. Colchester, Essex: UK Data Archive [distributor], January 1994. SN: 3166.
PAYNE, G. (2003) 'Size doesn't matter: the fallacy of class-differential fertility in social mobility analysis', International Journal of Social Research Methodology, Vol. 6, No. 2, pp. 141 - 158.
PAYNE, G. and ROBERTS, J. (2002) 'Opening and closing the gates: recent developments in male social mobility in Britain'. Sociological Research Online, Vol. 6, No. 4, <http://www.socresonline.org.uk/6/4/payne.html>.
PEARCE, N. and PAXTON, W. (2005) Social Justice: Building a Fairer Britain. London: Politico's.
PRANDY, K. (1998) 'Class and continuity in social reproduction: an empirical investigation'. The Sociological Review, Vol. 46, No. 2, pp. 340 - 364.
PRANDY, K. and BOTTERO, W. (1998) 'The use of marriage data to measure the social order in nineteenth-century Britain', Sociological Research Online, Vol. 3, No. 1, <http://www.socresonline.org.uk/3/1/6.html>.
PRANDY, K. and BOTTERO, W. (2000a) 'Social reproduction and mobility in Britain and Ireland in the nineteenth and early twentieth centuries', Sociology, Vol. 34, No. 2, pp. 265 - 281.
PRANDY, K. and BOTTERO, W. (2000b) 'Reproduction within and between generations: the example of nineteenth-century Britain', Historical Methods, Vol. 33, No. 1, pp. 4 15.
PRANDY, K. and LAMBERT, P.S. (2003) 'Marriage, Social Distance and the Social Space: An alternative derivation and validation of the Cambridge Scale', Sociology, Vol. 37, No. 3, pp. 397 - 411.
REED, J. and ROBINSON, P. (2005) 'From social mobility to equal life chances: Maintaining the momentum', in N. Pearce and W. Paxton (editors) Social Justice. London: Politico's.
RICHARDSON, C.J. (1977) Contemporary Social Mobility. London: Frances Pinter.
ROSE, D., MARSHALL, G. and NEWBY, H. (1990) Social Class in Modern Britain, 1984 [computer file]. Colchester, Essex: UK Data Archive [distributor], October 1990. SN: 2718.
ROSE, D. and PEVALIN, D.J. (2003) A Researcher's Guide to the National Statistics Socio-economic Classification, London: Sage.
RYTINA, S. (2000a) 'Is occupational mobility declining in the United States?', Social Forces, Vol. 78, No. 4, pp. 1227 - 1276.
RYTINA, S. (2000b) 'A keynote of hierarchy, an echo of class: the fine texture of mobility in England and Wales', Paper to the Fifth International Conference on Logic and Methodology, RC33. Cologne.
SORENSEN, A. (2005) 'Family structure, gender roles and measuring progress', in S. Svallfors (editor) Analyzing Inequality. Stanford: Stanford University Press.
STEWART, A., PRANDY, K. and BLACKBURN, R.M. (1980) Social Stratification and Occupations, London: MacMillan.
SWIFT, A. 'Would Perfect Mobility be Perfect?' (2004) European Sociological Review, Vol. 20, No. 1, pp. 1 - 11.
TOWNSEND, P. (1979) Poverty in the United Kingdom: A survey of household resources and standard of living. London: Allen Lane.
TREIMAN, D.J. and GANZEBOOM, H.B.G. (2000) 'The Fourth Generation of Comparative Stratification Research', in S.R. Quah, and A. Sales (editors) The International Handbook of Sociology, London: Sage.
UNIVERSITY OF ESSEX, Institute for Social and Economic Research (2006) British Household Panel Survey; Waves 1-14, 1991-2005 [computer file]. 2nd Edition. Colchester, Essex: UK Data Archive [distributor], June 2006. SN: 5151.
UNIVERSITY OF OXFORD, OXFORD SOCIAL MOBILITY GROUP et al. (1978), Social Mobility Inquiry, 1972 [computer file]. Colchester, Essex: UK Data Archive [distributor]. SN: 1097.
VALLET, L-A. (2001) 'Forty years of social mobility in France: Change in social fluidity in the light of recent models'. Revue Française de Sociologie, Vol. 42 (Supplement), pp. 5 - 64.
VERMUNT, J.K. (1997) lEM : A general program for the analysis of categorical data. Tilburg, Netherlands: Tilburg University.
WONG, R.S-K. (1994) 'Postwar mobility trends in advanced industrial societies', Research in Social Stratification and Mobility, Vol. 13, pp: 121 144.