by Stephen Gorard
Durham University
Sociological Research Online, 21 (1), 2
<http://www.socresonline.org.uk/21/1/2.html>
DOI: 10.5153/sro.3857
Received: 13 Oct 2015 | Accepted: 21 Dec 2015 | Published: 28 Feb 2016
This paper reminds readers of the absurdity of statistical significance testing, despite its continued widespread use as a supposed method for analysing numeric data. There have been complaints about the poor quality of research employing significance tests for a hundred years, and repeated calls for researchers to stop using and reporting them. There have even been attempted bans. Many thousands of papers have now been written, in all areas of research, explaining why significance tests do not work. There are too many for all to be cited here. This paper summarises the logical problems as described in over 100 of these prior pieces. It then presents a series of demonstrations showing that significance tests do not work in practice. In fact, they are more likely to produce the wrong answer than a right one. The confused use of significance testing has practical and damaging consequences for people's lives. Ending the use of significance tests is a pressing ethical issue for research. Anyone knowing the problems, as described over one hundred years, who continues to teach, use or publish significance tests is acting unethically, and knowingly risking the damage that ensues.
It has been brought to the attention of the Editors and the Publishers that some corrections requested by the author while reviewing the proofs had inadvertently been missed ahead of first publication of the above article on 28 February 2016. The author’s corrections were incorporated into subsequent versions of the online article, and there was an unintentional delay in uploading the corrected PDF version of the article online. Please see the published erratum for more information: http://journals.sagepub.com/doi/abs/10.1177/1360780417731066
An Editor’s note has been published in relation to this article and related articles.
1.1 The purpose of this paper is to remind readers that significance tests just do not work, even when used as intended in statistical analyses, and to argue that their widespread use should cease immediately. The paper starts with a generic description of how significance tests are intended to work, and an outline of the long-standing attempts to ban them from all areas of research. The next sections describe the logical problems with significance tests, and then demonstrate via simulations how often the results of their use would be dangerously misleading in practice. This leads to a consideration of why they are still used, 100 years since these problems were originally raised. The paper ends by arguing that this is no longer a technical or scientific issue but chiefly an ethical one.
1.2 As the paper makes clear, the problem goes way beyond the social sciences. But as Platt (1996) and Rozeboom (1997) suggest the problem is at least partly sociological. Looking at papers published 1935 to 2000, Leahy (2005, p.1) shows that the history of sociology is itself an example of sociology at work. There are no good technical or logical reasons why the significance test with its 5% standard alpha and the 'three-star system' of symbolic codes (*p < = .05, **p < = .01, ***p < = .001) came to dominate scientific publishing. It clearly became a self-reinforcing social practice. Now a majority of work in sociology, as with other disciplines, uses statistical significance when reporting 'quantitative' results (Engman 2013, p.257), and this despite long-standing criticism in sociology journals (Morrison and Henkel 1969). And, as elsewhere, its meaning is routinely mis-portrayed (as the probability of the null hypothesis, which is simply wrong). Engman (2013, p.257) concludes that 'reporting statistical significance provides sociology with very little value, and that the consequences of misinterpreting significance values outweigh the benefits of their use'.
2.1 Statistical significance testing - such as the use of t-tests, ANOVA, chi-squared and similar – is a commonly used, taught and published procedure when researchers are analysing numeric data. It is routinely used to assess the importance of a difference between groups, or a correlation between measures, or some other kind of pattern or trend in the data. Traditionally it operates by assuming that there is no difference, correlation or other pattern in the real-world (the population), and that any apparent pattern in the achieved data must be solely the result of the vagaries of randomly selecting cases from that population. This crucial prior assumption is known as the nil-null hypothesis, and it clearly entails another, which is that the cases involved in the research must have been selected or allocated fully at random. There must be no bias in the study design, and no measurement error, non-response or sample dropout. It is on these bases that the steps (or the algorithm in any software) to compute a significance test result are defined.
2.2 Given these unlikely prior assumptions, and perhaps a few more about the distribution of the values in the dataset and the nature of the measurements involved, a significance test can calculate the probability of finding a difference as large as, or a pattern as strong as, that actually observed in one sample. This probability is the p-value. To recapitulate, the p-value is the probability of observing a pattern at least as strong as that observed in one sample, assuming that the pattern is just a fluke introduced by the randomisation of cases from the population to the sample. Not only are the assumptions underlying the calculation of the p-value very unlikely to be true in any real piece of research, it is not at all clear what use this peculiar probability is to analysts. It is clearly not the probability of the null hypothesis being true. What does it mean, and why do so many researchers continue to calculate and cite it?
2.3 For some time now, methods experts in medicine, psychology, sociology, and education have been looking for support from their professional associations and from journal editors in banning the reporting of significance tests and their results (Walster and Cleary 1970, Nix and Barnette 1998, Fidler et al. 2004). Hunter (1997, p.3) called for such a ban in Psychological Science, stating simply that 'The significance test as currently used is a disaster', and Nelder (1999) wanted to 'demolish the P-value culture'. The American Psychological Association (APA) set up a task force to consider such a ban and make new recommendations about significance testing for its journals in 1996. Individual journals have instituted such a ban – the most well-known probably being the American Journal of Public Health, Epidemiology (http://edmgr.ovid.com/epid/accounts/ifauth.htm), and more recently Basic and Applied Psychology (http://www.tandfonline.com/doi/full/10.1080/01973533.2015.1012991). Similar improvements are proposed in ecology (White et al. 2013). In March 2011, the US Supreme Court ruled that statistical significance was not the determinant, in law, of whether a research finding was important or not (http://asq.org/quality-progress/2011/08/statistics-roundtable/not-significant-but-important.html).
2.4 An outright ban may seem excessive to some. But the calls are, I think, coming from a strong desire to improve the very poor quality of research in general, and out of frustration at the dangerous obstinacy of those who perpetuate the errors. The fact that significance tests and similar related approaches do not work as intended (or as used) has been clear for at least one hundred years in the social sciences and beyond (Boring 1919, Jeffreys 1937, Berkson 1938, Rozeboom 1960, Meehl 1967, Morrison and Henkel 1970, Carver 1978, Berger and Sellke 1987, Loftus 1991, Falk and Greenbaum 1995, Daniel 1998, Tryon 1998, Nickerson 2000, Gorard 2003, Lipsey et al. 2012).
2.5 Bakan (1966, p.436) called for significance testing to cease because it is essentially 'mindlessness in the conduct of research'. Guttman (1985, p.4) argued against the 'tyranny of this branch of inference in the academic world', and 'that it be abandoned by all substantive science'. Schmidt (1996, p.116) concluded that 'we must abandon the statistical significance test'. Nester (1996, p.407) said that such testing had no place in statistical analysis, and that 't-tests, analyses of variance…linear contrasts and multiple comparisons, and tests of significance for correlation and regression coefficients should be avoided by statisticians and discarded from the scientific literature'. Rozeboom (1997, p.335) summarised the position as being that 'null-hypothesis significance testing is surely the most bone-headedly misguided procedure ever institutionalized in the rote training of science students'. Significance testing just has no place in statistical analysis (Cumming 2014).[1] ; [2]
3.1 Today, significance tests are very seldom used as intended anyway. Thus, significance tests are routinely presented in research reports involving population data to which no generalisation is possible, or 'random' samples with 50% or more non-response and dropout, or with samples that were never randomised in the first place. Gibbs et al. (2015) show that the misleading and invalid practice of using inferential statistics with population data is widespread in top education journals. Dong and Lipsey (2011) show that any missing values tend to create bias, whether the attrition is balanced between comparator groups or not. It should be easy to see that using inferential statistics with either populations or incomplete data is wrong. There can be no standard error under these circumstances. Complete randomisation of the cases under consideration is an absolutely necessary pre-condition (Shaver 1993, Camilli 1996, Berk and Freedman 2001, Freedman 2004, Glass 2014). Estimating the p-value for any kind of non-random sample is pointless (Filho et al. 2013). The answer does not and can not mean anything.
3.2 However, this paper is not primarily about such widespread abuses of significance tests. The most fundamental point is that even when used with randomised cases, the logic of significance tests clearly does not work. Perhaps the most obvious problem is that an important assumption underlying the calculations in traditional significance tests is that of the nil-null hypothesis (or at least some equally unwarranted hypothesis). In order to calculate the p-value from a test such as chi-square, t, or F test, the two or more groups/categories being compared must have been drawn from the same population. Put more simply, the average scores for the two or more groups over repeated sampling must be identical. In reality, this would never be true (Meehl 1967). This means that a finding that two or more groups differ somewhat is a trivial one. Even asking such a question is foolish, according to Tukey (1991, p.100). To claim that a difference between two means is not precisely zero, for example, is of no interest whatsoever (Hubbard and Meyer 2013). Since no two large randomised groups, strictly speaking, will have identical scores all that a significance test tells the reader is whether the sample size involved was large enough to detect the difference that must be there.
3.3 Traditional use of significance tests routinely ignores any prior knowledge on a topic. In effect, it assumes that the prior probability of any nil-null hypothesis being true is 50%. This is clearly wrong in almost all studies and for almost all hypotheses (Oakes 1986). The use of significance tests also tends to reduce the value of small studies, favouring one large 'significant' study over a large number of less than significant smaller ones. It encourages game-playing and even a lack of integrity (Simmons et al. 2011), where researchers are less likely to publish insignificant results, and journals are less likely to accept them – leading to the file-drawer problem (Rosenthal 1979, Pigott et al. 2013, Kuhberger et al. 2014). And they seem to be used instead of considerations of sample quality, design bias, measurement quality and so on (Gorard 2013, 2015a).
3.4 The intention behind the proposed ban (above) would be to force researchers to consider and report a much wider range of issues – such as the possible importance and methodological soundness of any findings (Greenwald 1975, Kline 2004). What is needed is some idea of the scale of any difference (or pattern or trend), the methodological limitations underlying it, and a judgement about its substantive importance (and perhaps also the cost-effectiveness of accepting the finding's implications or not). What is needed is an 'effect' size evaluation (Yates 1964, Lecoutre and Poitevineau 2011).[3]
3.5 Even used as intended, significance tests are widely mis-interpreted by researchers, students and their teachers, as well as by professional statisticians (Watts 1991, Murtonen and Lehtinen 2003). These mistakes are not isolated errors but a normal part of statistical discourse (Oakes 1986). Even experts and those employed precisely to improve the quality of 'quantitative' research methods get these things wrong (see examples in Gorard 2015b). Misinterpretations include the idea that a p-value is the inverse or near inverse of the probability that the alternative hypothesis is true – whereas the two are completely different (Parkhurst 1985). The situation is not helped by the complicated mathematical procedures taught in courses on practical statistics, which may give research using significance tests an unwarranted appearance of scientific objectivity (Carver 1978). Another misinterpretation, also prevalent in lectures and methods resources, is the belief that significance tests can indicate whether a finding is real or simply occurred by chance.
3.6 Students and new researchers may actually be more confused at the end of a course on statistics. This would make them use significance tests wrongly, and to tend to ignore more logical and simpler approaches (Chatfield 1985). In order to pass such a course, students must accept something which does not make sense, and the most talented may find it the hardest to cope with for that reason (Deming 1975).
3.7 However, the biggest problem with significance tests is that their logic is fundamentally flawed. They just do not work as proposed, because the probabilities they calculate are not the probabilities that any analyst wants. Significance tests calculate the probability of getting a result as or more extreme than the one that has been observed, assuming that the nil-null hypothesis is true. What analysts want is the probability of the nil-null hypothesis being true, given the result obtained. These two are completely different. Yet when rejecting the nil-null hypothesis on the basis of a p-value the analyst is using the first probability as though it were the second. This is the 'inverse probability error', a relatively obvious logical fallacy (Cohen 1994). The probability that a hanged person will be dead will be very high, but the probability that any dead person had been hanged would be very low (Carver 1978). And we cannot estimate one such probability from the other without a lot more information (see below).
3.8 To illustrate the problem, assuming that a bag of 100 marbles contains 50 red and 50 blue (the null hypothesis) it is easy to calculate the precise probability of drawing out 7 red and 3 blue in a random sample of 10 marbles. This is, in effect, what significance tests do. But this does not tell us whether the bag really does contain 50 red and 50 blue marbles. How could it? In practice, we would not know the number of each colour in the bag. In this situation, drawing 7 red and 3 blue in a sample would not tell us the colours of those left. Yet this is what significance test advocates claim we can do. It is a kind of magic-thinking – an erroneous superstitious belief that seems to have overtaken entire research communities.
3.9 What follows in this paper is a series of new practical demonstrations of how significance tests provide incorrect answers to substantive research questions. It is hoped that they will be expanded and replicated by others. Their purpose is to allow those who still cling to the cherished belief that there must be some value in significance testing to see for themselves that the logical problems (above) do mean that their p-values are useless in practice (and even when all necessary assumptions are met).
4.1 Here is a practical demonstration that significance testing simply does not work. It can be replicated easily by all readers. It is based on Excel and SPSS, but I am sure that it can be performed as simply in other ways. I created a spreadsheet of 200 rows, and a column containing 100 '1's and 100 '2's. The rows were envisaged as the cases in a study, and that first column identified each case as being in one of two mutually exclusive groups (it was the 'grouping variable'). I then created 10,000 further columns, each of random numbers between 0 and 1 (see extract of 6 cases from 4 samples in Table 1). These columns were envisaged as 10,000 random samples drawn from the population of all numbers between 0 and 1. I then ran a t-test for each sample. If using SPSS it might be convenient to paste the output table ('Independent Samples Test') back to Excel, and then sort the list into ascending order using the column 'significance'. This creates a list of 10,000 p-values.
| Table 1: Section of spreadsheet used in the demonstration | |||||
| Grouping variable | Sample 1 | Sample 2 | Sample 3 | Sample 4 | Sample 5 |
| … | … | ||||
| 1 | 0.144592 | 0.774259 | 0.709073 | 0.768237 | … |
| 1 | 0.988851 | 0.763815 | 0.235691 | 0.433938 | … |
| 1 | 0.512305 | 0.755811 | 0.371663 | 0.628544 | … |
| 2 | 0.297272 | 0.523157 | 0.037307 | 0.024563 | … |
| 2 | 0.237739 | 0.915310 | 0.640976 | 0.715679 | … |
| 2 | 0.020447 | 0.600709 | 0.331389 | 0.645302 | … |
| … | … | ||||
4.2 All of the numbers in each sample were random, therefore the nil-null hypothesis that the two groups of 100 cases in each sample were both drawn from the same population (or that there is no difference between the groups in the population) is true. Even so, of course, the means for each group of 100 in each sample were not identical. Some were very, very close and a few were relatively far apart. The t-test for each sample calculates correctly, under certain assumptions, the probability of obtaining two groups of 100 with means that differed by as much as was actually observed. So, for example, on the first run 487 samples had two means so far apart that the t-test produced a p-value of <0.05. This is 4.9% of the total samples. So, in the artificial situation where we genuinely know that the two groups in each sample are drawn from the same population, around 5% of the samples will be incorrectly labelled as portraying a 'significant' difference, if we have used 5% as our criterion for selection. But this is merely a tautology. In real-life, it tells us precisely nothing about whether the nil-null hypothesis is true or not. For the probabilities to exist at all the nil-null hypothesis must be true (as here).
4.3 To illustrate the real problem, I repeated the procedure from the start but in each of the 10,000 samples replaced all of the cases with grouping variable '2' by a random number multiplied by 1.1. This creates 10,000 samples of random numbers but where group 2 in each sample is, on average, 10% larger than group 1. In this example, it not true that the two group of cases in each sample have both come from the same population. There is a difference between the groups in the population. And 10% is a substantial difference. Imagine what it would look like if one large group of people were 10% taller than another large group. Or the outcry there would be if males earned 10% more than women for doing the same job. Or the difference in death rates if poorer people had to wait 10% longer for cancer diagnosis than richer ones.
4.4 As before, the mean for each group of 100 in each sample was not identical. Some were close and some further apart. And as before and as a necessary basis for computation, but incorrectly this time, the p-values created by the t-test assume that the two groups for each sample are both from the same population. On the first run, 1217 p-values were below 0.05 (this represents around 12% of the samples). So, in the artificial situation where we genuinely know that the two groups in each sample are not drawn from the same population, but differ consistently by a considerable margin, only around 12% of the samples will be correctly labelled as portraying a 'significant' difference, if we have used 5% as our criterion for selection. This means that the procedure would be mistaken 88% of the time. This means that in a large company where every male was automatically paid 10% more than a female in the same situation (grade, qualifications, years of experience, extra responsibility and so on), a random sample of 200 employees would predominantly lead to a conclusion that there was no evidence to suggest that men were paid more than women - if a t-test (or equivalent test of statistical significance) were used. It would be no use pointing out that the men in the sample earned around 10% more than the women. The t-test advocate would say 'ah but it is not significant'. This is patent nonsense – yet it goes on all of the time across all areas of substantive research.
4.5 It does not matter whether uniform random numbers are used (perhaps easiest for most who want to attempt this) instead of normally-distributed ones. Lack of normality may reduce the so-called 'power' of the test slightly, but with 200 cases (deemed a very large N in most resources), this has been shown not to matter (http://thestatsgeek.com/2013/09/28/the-t-test-and-robustness-to-non-normality/). The same procedure can also be used with the other tests available. One simple approach is to use the non-parametric procedures available on SPSS. All give the same substantive results. If the groups are drawn from the same population, as they must be as a basic assumption for any such test to work, the tests find a false 'significant' difference around 5% of the time using 5% as the cut-off point. Obviously, because there is nothing wrong with the actual computation aspect of significance tests. But as soon as these tests are used with samples where the groups are not drawn from the same population they cease to work in the same way (and unless the number of cases is so large as to make the difference obvious anyway). And this is what the situation would be in real-life. The computation of the p-values is now based on a flawed assumption, and so the computed p-values will be wrong in real-life examples. It is a relatively simple example of garbage in garbage out.[4]
5.1 The first demonstration took no account of the likelihood of the nil-null hypothesis being true at the outset. The second demonstration also shows how inverting the probabilities in a significance test, as must be done to 'reject' the nil-null hypothesis, leads to serious mistakes. Significance tests calculate the probability of obtaining a result (like a difference between groups) as or more extreme as that actually observed, assuming that the result is caused only by the chance process of randomisation when the cases were selected. More succinctly, they provide the conditional probability p(D|H0), where D is the data obtained from the study, and H0 is the nil-null hypothesis. No analyst really wants to know this figure. Instead they want to know the probability that the result was caused only by the chance process of randomisation when the cases were selected. This would be p(H0||D). And the latter is what so many analysts mistake the former for (by using the former result to judge the probability of H0 being true). It is, therefore, interesting to observe how closely related these two conditional probabilities are over a wide range of possible values.
5.2 Bayes' theorem shows us how any two conditional probabilities are related. The simplest form is:
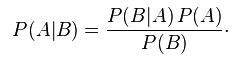
|
5.3 Treating D as A, and H0 as B, this tells us that converting p(D|H0) into p(H0|D) therefore requires us to know both the unconditional probability of H0 being true (irrespective of the data observed), and the unconditional probability of observing that data (irrespective of whether H0 is true or not). Of course, if we actually knew the unconditional probability of H0 being true we would be wasting our time doing a significance test anyway. Leaving that aside, it is important to note that we know neither of these unconditional probabilities in practice. We could therefore adopt a fully subjective Bayesian approach to analysis (Gorard 2004), which would mean rejecting significance tests anyway, or more fruitfully we could look at the relationship between p(D|H0) into p(H0|D) for all possible values of p(D) and p(H0). This is similar to the approach used by Trafimow (2009).
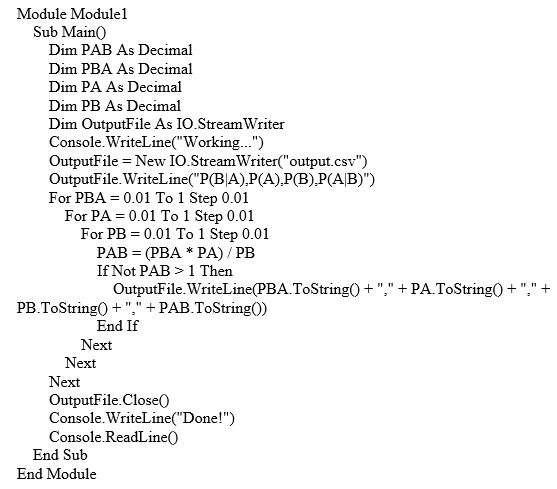
5.4 I implemented the latter in two ways, each based on two brief computer programs. The first program had three nested loop counters moving from 0 to 1 in steps of 0.01. There were, therefore, 1,000,000 iterations. The first loop counter represented p(D|H0), the next p(H0), and the third p(D). Each possible combination of these three probabilities can then be used to assess p(H0|D) for that combination in practice. The result can be used to illustrate how accurate (or not) an estimate of p(H0||D) will be based on p(D|H0). Since p(D|H0) will not be larger than p(D), a total of 249,765 results were ignored (the coding necessary to generate the result is in the Appendix to this paper so that the exercise can be repeated or extended by all readers). The remaining 750,235 combinations of the three probabilities were used to compute p(H0|D) via Bayes' theorem (as above). The Pearson's R correlations between p(D|H0), p(H0), and p(D) were all zero as would be expected. The correlation between p(D|H0) and p(H0|D) was +0.48 (and the correlation was lower if all 1,000,000 combinations were used). This means that if p(D|H0) is used to help accept or reject H0, effectively treating it as the same as or a clue to the size of p(H0|D) or even p(H0), the outcome will be terribly inaccurate. R of +0.48 is the same as the 'effect' size R2 of +0.23. The vast majority of variation in p(D|H0) and p(H0|D) is unique to each. Less than a quarter is shared.
5.5 There is no point in presenting the scatterplot of the results, because at any reasonable level of resolution it is simply a filled in square with every value from 0 to 1 for p(D|H0) linked to every value from 01 to 1 for p(H0|D). At high magnification it is possible to see that lower values of one variable are somewhat more commonly linked to a range of lower values for the other. But there is no chance of predicting one value from the other in practice – because a low value of p(D|H0) can mean a high, medium or low value for p(H0|D), and vice versa. Using p(D|H0) as a proxy for p(H0|D) or even p(H) is therefore very misleading.
5.6 The second simulation also had 1,000,000 trials, but in this version the three probabilities from the right-hand side of Bayes' theorem were all repeatedly selected random numbers between 0 and 1. Again, since p(D|H0) will not be larger than p(D), any such results were ignored – a total of 279,568 results. The remaining 720,432 were again used to calculate the left hand side of Bayes' theorem for each combination of generated probabilities, and the various conditional probabilities correlated. The correlation between p(D|H0) and p(H0|D) was +0.48 again (and again the correlation was lower if all 1,000,000 combinations were used).
5.7 In summary, there is only a very weak link between p(D|H0) and p(H0|D). They are not the same. They are not even close. One can be large and the other small, or large, or anywhere in between. So, neither gives a good indication of the size of the other. Using p(D|H0) as an estimate of p(H0|D) on the basis that they are sufficiently correlated is illogical, and is very, very, misleading in practice .
6.1 Despite the clear and long-standing rational arguments against the use of significance tests, their use remains prevalent and each new generation of researchers is taught about them. The common mistakes involved in significance testing have been known since their inception, and widely reported ever since. According to Shrout (1997) there is no evidence that this kind of polite academic discussion had made much difference. Tryon (1998, p.796) worried that 'seventy-two years of education have resulted in miniscule, if any, progress toward correcting this situation'. Rozeboom (1997) termed this continued neglect a 'sociology-of-science wonderment' (p. 335).
6.2 There has been no blanket ban in their journals by any publisher or a clear recommendation against their use by any major professional associations. The APA (above) fell short of banning significance tests in 1996, 1999, and even 2010 (The American Psychological Association 2010). Instead, they have promoted ever more strongly the use of 'effect' sizes – perhaps hoping to let significance wither on the vine. The journal Epidemiology moved from an outright ban to a slightly weaker position (http://edmgr.ovid.com/epid/accounts/ifauth.htm), suggesting now in their guidance for authors that "we strongly discourage the use of categorized P-values and language referring to statistical significance". Surprisingly, many social and behavioural scientists remain apparently unaware of the long-standing criticisms of significance tests (Schwab et al. 2011). The objections are certainly not a standard part of methods resources or training in so-called 'quantitative methods' in the social sciences (Gorard 2015c).
6.3 Even where outright bans have been in force, Fidler et al. (2004) reported that compliance has been largely superficial. Reporting of p-values did decline greatly, in their analysis of 704 articles in American Journal of Public Health and in Epidemiology from 1982 to 2000. But the stronger considerations of bias and design issues that were intended to result were not always evident. Analysts need better education in conducting actual analyses, and do not seem to know what to do once their push-button procedures are taken away. Eliminating teaching about significance tests creates space in research training to discuss the much more important issues of research design, and how to assess the robustness of a piece of research.
6.4 Several commentators, like Hubbard and Ryan (2000), have written wondering why such an obviously flawed approach as significance testing has survived, and why it is still defended so strongly by so many. It cannot just be ignorance of the counter-arguments (Schmidt and Hunter 1997). Thompson (2004) examines possible psychological and sociological barriers to the changes in practice that would be needed, since the problem of the obstinacy of significance users cannot be logical or mathematical either. Significance testing derives from a psychological flaw. 'It does not tell us what we want to know, and we so much want to know what we want to know that, out of desperation, we nevertheless believe that it does!' (Cohen 1994). Schmidt (1996) considers it an addiction to false belief.
6.5 Significance tests have become a kind of religious ritual that it is socially necessary to perform before many journals will accept a paper with numbers in it, or before others will read and believe the findings. Salsburg (1985, p.220) extends the analogy of a religious belief in significance testing that relies neither on ethics or reason. 'Invocation of the religious dogmas of Statistics will result in publication in prestigious journals. This form of Salvation yields fruit in this world (increases in salary, prestige, invitations to speak at meetings) and beyond this life (continual references in the citation indexes)'. Being a matter of faith, the fact that so many users of significance tests do not understand them, and could not explain correctly what a p-value is the probability of, becomes a source of paradoxical strength to them.
6.6 Orlitzky (2011) agrees that attempts to change the practice of individual researchers using significance tests are not enough – and calls for institutional and epistemological reforms as well as better education and training in inductive and abductive reasoning, statistical modeling and Bayesian epistemology. For Falk and Greenbaum (1995, p.76) it is not only the mindlessness of some supporters of significance testing, and force of uncritical habit for others. 'There are profound psychological reasons leading scholars to believe that they cope with the question of chance and minimize their uncertainty via producing a significant result'. Part of the problem is that while critics are showing that the logic of significance testing does not work, defenders are largely ignoring this issue and pointing to the need for something that does work (Krueger 2011). The latter, a common first response, is of course irrelevant to whether significance tests work or not.
6.7 On the other hand, it is likely that if the funders of research started to demand that analysts find other ways of analysing and presenting data then the change would come quickly. Money does talk. And perhaps the best way to get funders to demand improved approaches is for them to realise the damage that significance tests do. It is also hoped that that those who actually provide research funders with the money that they then give to research – the taxpayers and charity-givers - will demand that their money is no longer used to damage lives and even kill people.
7.1 The latter is no exaggeration. The refusal of so many researchers and commentators to deal with the problem of significance testing has real consequences. Following Gorard (2002) and others, research funders and organisations are considering the quality of any research as a key ethical issue, over and above their concern that participants in research are not harmed. This is necessary as most of the harm that comes from research happens to those not directly involved but who pay for it (see above) and whose lives may be affected by research-informed decisions. Science, medicine, and many other areas have numerous false starts and vanishing breakthroughs where findings cannot be replicated, or where policy and practice are based on a few studies only to find out later that the findings are incorrect. Such problems may never be eradicated, but currently they are mostly caused by the flawed approach of significance testing (Matthews 1998a, 1998b) and what Halsey et al. 2015 term 'the fickle p value'. The volatile results produced by such testing are so prevalent in epidemiology that Le Fanu (1999) suggested, almost seriously, that all departments of epidemiology be closed down as a service to medicine. The situation is probably as bad in econometrics, but the results there are rarely tested or replications attempted.
7.2 Findings based on p-values are routinely used in practice, and often lead to the later realisation that the findings are wrong or at least unclear because the research base is so poor (Dyregrov 1998). There are doubts about the efficacy of culling badgers to reduce the incidence of TB (Donnelly et al. 2003), of training to reduce bicycle accidents (Carlin et al. 1998), and scaring delinquent children away from a life of crime (Petrosino et al. 2000). In each example, both the advocates and critics are using significance tests and confidence intervals, and so endangering the public. All of these and many more policies and practices have looked plausible, but when tested more robustly evidence was found either that they did not work (and so wasted time and resource) or that they actually worsened the outcome they were trying to improve.
7.3 The validity of much published work in this vein is questionable (Hubbard and Lindsay 2008). In fact, the use of significance tests in practice is 'a disaster' (Hunter 1997), because their results are so misleading (Jones and Matloff 1986). They are more often wrong than right, either by permitting easy rejection of a null hypothesis through use of a large sample, or by suggesting falsely that important real-life differences are insignificant (see above).
7.4 Measuring and reporting the actual levels of toxicity (in drugs and food) would be better than a binary decision about whether something was toxic or safe (Salsburg 1986, Savitz 1993). In medicine, advances are stalled and scientific discoveries threatened by the 'ubiquitous misuse and tyranny' of the p-value (Stang et al. 2010, p.1). This prevents patients from obtaining the most appropriate treatment, and therefore harms many of them either by omission or commission at some stage in their lives. In ecology, Suter (1986) argued that significance testing is fundamentally inappropriate for risk assessment, and that its continued use has damaging consequences for environmental protection. The problem of significance testing matters in real-life.
8.1 The new demonstrations in this paper should not be necessary. The assumption, that the nil-null hypothesis (or similar) is true, is required to conduct a significance test. It is this assumption that permits the calculation of the p-values. If that assumption is not true, as it cannot be in all genuine examples (Meehl 1967), then the p-values cannot be calculated correctly or legitimately. In a very real sense they can be said not to exist (Gorard 2006). Where the procedure of calculating p-values is conducted anyway the results will obviously be wildly wrong (as shown clearly in the demonstrations above).
8.2 This should also be clear from a basic understanding of conditional probabilities. The probability of the data observed given a true nil-null hypothesis is not the probability of the nil-null hypothesis being false (or true) given the data observed. Nor are these two probabilities related to each other in any simple way, or a way that can use a single sample. But previous demonstrations, that the average error rate of significance tests in practice is nothing like 5%, but higher than 60% (Hunter 1997), have not been enough. The illustration in this paper that t-tests do not work when there is a difference between the groups being compared is therefore for the obstinate and the disbelieving to try out for themselves.
8.3 Significance tests just do not work - even when used as their advocates intended, with fully randomised cases. They cannot be used to decide whether a finding is worthy of further investigation or whether it should be acted on in practice. They are still providing vast numbers of false results, leading to vanishing breakthroughs in all of the fields in which they are used. Where their research has no real-life implications, those researchers relying on significance tests are simply wasting the time of those who read the work, and the money of those who fund them. These are serious opportunity costs, because the time and money could otherwise have been spent on something that was valid and perhaps even useful. But where the research matters, as it should do, the damage caused by using significance tests is even worse. The use of significance tests means that progress is being hindered, and real lives are being damaged, in areas from law and epidemiology to education and social justice.
8.4 This means that anyone using significance tests, allowing them to pass peer-review for publication in their journals, teaching them to new researchers, or otherwise advocating them in any way, is part of a (hopefully) diminishing group causing untold real-life damage. Where they previously did so through ignorance, they should now cease. But anyone who continues with any of these actions despite reading the material in this paper (and others) is causing that damage deliberately.
|
1 Once significance testing is abolished, there are further logical consequences that there is no space to pursue in detail here. One consequence would be that traditional power calculations and so-called minimum detectable effect sizes (MDES) would be abolished as well. Both use significance testing in their definition and in their calculation.
2The literature cited in this paper and others is replete with advice and examples on what to do 'instead' of significance tests. One way forward is described in (Gorard and Gorard 2015a, Gorard and Gorard 2015b).
3Although confidence intervals (CIs) are advocated instead by many commentators, including a few of those cited here, they are in essence the same as significance tests (Gorard 2015c). Both are based on standard errors for a sampling distribution based on only one sample from that distribution. Both use modus tollendo tollens (inverse) logic, but with likelihoods, in a way that does not actually work as logic when used with likelihoods. Neither approach provides anything like the likelihood that their users envisage.
4The same kind of simulation approach can be used in the same way to demonstrate as convincingly that confidence intervals do not work either.
AMERICAN PSYCHOLOGICAL ASSOCIATION (2010) Publication manual of the APA (6th ed.), Washington, DC.
BAKAN, D. (1966) The Test of Significance in Psychological Research, Psychological Bulletin, 77, p. 423-437. [doi:10.1037/h0020412]
BERGER, J. and Sellke, T. (1987) Testing a Point Null Hypothesis: The Irreconcilability of P Values and Evidence (with comments), Journal of the American Statistical Association, 82, 1, p. 112-39. [doi:10.2307/2289131]
BERK, R. (2004) Regression analysis: A constructive critique, Thousand Oaks, CA: Sage.
BERK, R. and Freedman, D. (2001) Statistical assumptions as empirical commitments, http://www.stat.berkeley.edu/~census/berk2.pdf, accessed 030714.
BERKSON, J. (1938) Some difficulties of interpretation encountered in the application of the chi-square test, Journal of the American Statistical Association, 33, p. 526-536 [doi:10.1080/01621459.1938.10502329]
BORING, E. (1919) Mathematical vs. scientific importance, Psychological Bulletin, 16, p. 335-338 [doi:10.1037/h0074554]
CAMILLI, G. (1996) Standard errors in educational assessment: a policy analysis perspective, Education Policy Analysis Archives, 4, 4, p. 1-17 [doi:10.14507/epaa.v4n4.1996]
Carlin, J., Taylor, P. and Nolan, T. (1998) School based bicycle safety education and bicycle injuries in children: a case control study, Injury Prevention, 4, p. 22-7. [doi:10.1136/ip.4.1.22]
CARVER, R. (1978) The case against statistical significance testing, Harvard Educational Review, 48, p. 378-399. [doi:10.17763/haer.48.3.t490261645281841]
CHATFIELD, C. (1991) Avoiding statistical pitfalls, Statistical Science, 6, 240-268. [doi:10.1214/ss/1177011686]
COHEN, J. (1994) 'The Earth is Round (p<.05)', American Psychologist, 49, 12, p. 997-1003. [doi:10.1037/0003-066X.49.12.997]
CUMMING, G. (2014) The new statistics: why and how, Psychological Science, 25, 1, p. 7-29. [doi:10.1177/0956797613504966]
DANIEL, L. (1998) Statistical significance testing: A historical overview of misuse and misinterpretation with implications for the editorial policies of educational journals, Research in the Schools, 5, 2, p. 23-32
DEMING, W. (1975) On probability as a basis for action, American Statistician, 29, p. 146-152.
DONNELLY C., Woodroffe R., Cox D. et al. Impact of localized badger culling on tuberculosis incidence in British cattle, NATURE, 426, p. 834-837 [doi:10.1038/nature02192]
DONG, N. and Lipsey, M. (2011) Biases in estimating treatment effects due to attrition in randomised controlled trials, SREE Conference, http://eric.ed.gov/?id=ED517992.
DYREGROV, A. (1998) Psychological Debriefing - An Effective Method?, Traumatology, 4, 2, p. 6-15 [doi:10.1177/153476569800400203]
ENGMAN, A. (2013) Is there life after P<0.05? Statistical significance and quantitative sociology, Quality & Quantity, 47, 1, p. 257-270. [doi:10.1007/s11135-011-9516-z]
FALK, R. and Greenbaum. C. (1995) Significance tests die hard: the amazing persistence of a probabilistic misconception, Theory and Psychology, 5, p. 75-98 [doi:10.1177/0959354395051004]
FIDLER, F., Thomson, N., Cumming, G., Finch, S. and Leeman, J. (2004) Editors Can Lead Researchers to Confidence Intervals, but Can't Make Them Think: Statistical Reform Lessons From Medicine, Psychological Science, 15, 2, p. 119-126. [doi:10.1111/j.0963-7214.2004.01502008.x]
FILHO, D., Paranhos, R., da Rocha, E. , Batista, M., da Silva, J., Santos, M. and Marino, J. (2013) When is statistical significance not significant?, http://www.scielo.br/pdf/bpsr/v7n1/02.pdf.
FREEDMAN, D. (2004) Sampling, in M. Lewis-Beck, A. Bryman and T. Liao (Eds) Sage Encyclopaedia of Social Science Research Methods (Thousand Oaks, CA: Sage), p. 987-991 [doi:10.4135/9781412950589.n879]
GIBBS, B., Shafer, K. and Miles, A. (2015) Inferential statistics and the use of administrative data in US educational research, International Journal of Research and Method in Education, 10.1080/1743727X.2015.1113249 [doi:10.1080/1743727X.2015.1113249]
GLASS, G. (2014) Random selection, random assignment and Sir Ronald Fisher, Psychology of Education Review, 38, 1, p. 12-13
GORARD, S. (2002) Ethics and equity: pursuing the perspective of non-participants, Social Research Update, 39, p. 1-4
GORARD, S. (2003) Understanding probabilities and re-considering traditional research methods training, Sociological Research Online, 8,1, 12 pages.
GORARD, S. (2006) Using everyday numbers effectively in research: Not a book about statistics, London: Continuum.
GORARD, S. (2013) Research Design: Robust approaches for the social sciences, London: SAGE.
GORARD, S. (2015b) Context and Implications for: Rethinking "quantitative" methods and the development of new researchers, Review of Education, 3, 1, p. 97-99, doi: 10.1002/rev3.3042. [doi:10.1002/rev3.3042]
GORARD, S. (2015c) Rethinking "quantitative" methods and the development of new researchers, Review of Education, 3, 1, p. 72-96, doi: 10.1002/rev3.3041. [doi:10.1002/rev3.3041]
GORARD, S. and Gorard, J. (2015a) What to do instead of significance testing? Calculating the 'number of counterfactual cases needed to disturb a finding', International Journal of Social Research Methodology, http://dx.doi.org/10.1080/13645579.2015.1091235. [doi:10.1080/13645579.2015.1091235. ]
GORARD, S. and Gorard, J. (2015b) Explaining the number of counterfactual cases needed to disturb a finding: a reply to Kuha and Sturgis, International Journal of Social Research Methodology, http://dx.doi.org/10.1080/13645579.2015.1126494. [doi:10.1080/13645579.2015.1126494. ]
GORARD, S., Roberts, K. and Taylor, C. (2004) What kind of creature is a design experiment?, British Educational Research Journal, 30, 4, p. 575-590. [doi:10.1080/0141192042000237248]
GREENWALD, A. (1975) Consequences of Prejudice Against the Null Hypothesis, Psychological Bulletin, 82, p. 1-20. [doi:10.1037/h0076157]
GUTTMAN, L. (1985) The Illogic of Statistical Inference for Cumulative Science, Applied Stochastic Models and Data Analysis, 1, p. 3-10. [doi:10.1002/asm.3150010103]
HALSEY, L., Curran-Everett, D., Vowler, S. and Drummond, G. (2015) The fickle p value generates irreproducible results, Nature Methods, 12, 3, p. 179-185. [doi:10.1038/nmeth.3288]
HUBBARD, R. and Lindsay, R. (2008) Why P Values Are Not a Useful Measure of Evidence in Statistical Significance Testing, Theory & Psychology, 18, 1, p. 69-88. [doi:10.1177/0959354307086923]
HUBBARD, R. and Meyer, CK. (2013) The rise of statistical significance testing in public administration research and why this is a mistake, Journal of Business and Behavioral Sciences, 25, p. 1.
HUBBARD, R. and Ryan, P. (2000) The Historical Growth of Statistical Significance Testing in Psychology—and Its Future Prospects (with discussion), Educational and Psychological Measurement, 60, p. 661-696.
HUNTER, J. (1997) Needed: A Ban on the Significance Test, Psychological Science, 8, 1, p. 3-7. [doi:10.1111/j.1467-9280.1997.tb00534.x]
JEFFREYS, H. (1937) Theory of probability, Oxford: Oxford University Press.
JONES, D. and Matloff, N. (1986) Statistical hypothesis testing in biology: a contradiction in terms, Journal of Economic Entomology, 79, p. 1156-1160. [doi:10.1093/jee/79.5.1156]
KLINE, R. (2004) Beyond Significance Testing: Reforming Data Analysis Methods in Behavioral Research, Washington, DC: American Psychological Association. [doi:10.1037/10693-000]
KRUEGER, J. (2001) Null hypothesis significance testing: On the survival of a flawed method, American Psychologist, 56, p. 16-26. [doi:10.1037/0003-066X.56.1.16]
KUHBERGER, A., Fritz, A. and Schemdl, T. (2014) Publication bias in psychology, PLOSone, doi: 10.137/journal.pome.0105825.
LEAHY, E. (2005) Alphas and Asterisks: The Development of Statistical Significance Testing Standards in Sociology, http://sociology.arizona.edu/sites/sociology.arizona.edu/files/files-user/Leahey_SF2005.pdf (accessed 7/12/15).
LE FANU J. (1999) The rise and fall of modern medicine, New York: Little, Brown.
LECOUTRE, B. and Poitevineau, J. (2011) The Significance Test Controversy and the Bayesian Alternative, http://statprob.com/encyclopedia/SignificanceTestControversyAndTheBayesianAlternative.html.
LIPSEY, M., Puzio, K., Yun, C., Hebert, M., Steinka-Fry, K., Cole, M., Roberts, M., Anthony, K. and Busick, M. (2012) Translating the statistical representation of the effects of education interventions into more readily interpretable forms, Washington DC: Institute of Education Sciences, p.13.
LOFTUS, G. (1991) On the tyranny of hypothesis testing in the social sciences, Contemporary Psychology, 36, p. 102-105. [doi:10.1037/029395]
MATTHEWS, R. (1998a) Bayesian Critique of Statistics in Health: The great health hoax, http://www2.isye.gatech.edu/~brani/isyebayes/bank/pvalue.pdf.
MATTHEWS, R. (1998b) Flukes and flaws, Prospect, 20 November 1998. Available online at http:// www.prospectmagazine.co.uk/features/flukesandflaws (accessed 14 July 2014).
MEEHL, P. (1967) Theory - testing in psychology and physics: A methodological paradox, Philosophy of Science, 34, p. 103-115 [doi:10.1086/288135]
MORRISON, D. and Henkel, R. (1969) Significance tests reconsidered, American Sociologist, 4, p. 131-140.
MORRISON, D E, Henkel, RE. (1970) Significance tests reconsidered. in: Morrison DE, Henkel RE (Eds.) The significance test controversy. A reader. Butterworth, London; 1970: p. 182-198.
MURTONEN, M. and Lehtinen, E. (2003) Difficulties experienced by education and sociology students in quantitative methods courses, Studies in Higher Education, 28, 2, p. 171-185. [doi:10.1080/0307507032000058064]
NELDER, J. (1999) Statistics for the Millennium: From Statistics to Statistical Science, The Statistician, 48 (Part 2), p. 257-269. [doi:10.1111/1467-9884.00187]
NESTER, M. (1996) An Applied Statistician's Creed, Applied Statistics, 45, 4, p. 401-410. [doi:10.2307/2986064]
NICKERSON, R. (2000) Null hypothesis significance testing: a review of an old and continuing controversy, Psychological Methods, 5, 2, p. 241-301. [doi:10.1037/1082-989X.5.2.241]
NIX, T. and Barnette, J. (1998) The data analysis dilemma: Ban or abandon, A Review of null hypothesis significance testing, Research in the Schools, 5, 2, 3-14
OAKES, M. (1986) Statistical Inference: A Commentary for the Social and Behavioural Sciences, Chichester: Wiley.
ORLITZKY, M. (2011) How Can Significance Tests Be Deinstitutionalized?, Organizational Research Methods, 15, 2, p. 199-228. [doi:10.1177/1094428111428356]
PARKHURST, D. (1985) Interpreting failure to reject a null hypothesis, Bulletin of the Ecological Society of America, 66: p. 301-302.
PETROSINO, A., Turpin-Petrosino, C. and Finckenauer, J. (2000) Programs can have harmful effects!: Lessons from experiments of programs such as scared straight. Crime and Delinquency, 46, 1, p. 354-379. [doi:10.1177/0011128700046003006]
PIGOTT, T., Valentince, J., Polanin, J., Williams, R. and Canada, D. (2013) Outcome-reporting bias in education research, Educational Researcher, 42, 8, p. 424-432. [doi:10.3102/0013189X13507104]
PLATT, J. (1996) A History of Sociological Research Methods in the United States, Cambridge University Press.
ROSENTHAL, R. (1979) 'The "file drawer problem" and tolerance for null results', Psychological Bulletin, 86, p. 638-641. [doi:10.1037/0033-2909.86.3.638]
ROZEBOOM, W. (1960) The fallacy of the null hypothesis significance test, Psychological Bulletin, 57, p. 416-428. [doi:10.1037/h0042040]
ROZEBOOM, W. (1997) Good science is abductive not hypothetico-deductive, in Harlow, L., Mulaik, S. and Steiger. J (Eds.) What if there were no significance tests?, New Jersey: Erlbaum.
SALSBURG, D. (1985) The Religion of Statistics as Practiced in Medical Journals, The American Statistician, 39, p. 220-223.
SALSBURG,D.S. 1986. Statistics for Toxicologists. New York, Marcel Dekker, Inc.
SHAVER, J. (1993). What statistical significance testing is, and what it is not. Journal of Experimental Education, 61, p. 293-316. [doi:10.1080/00220973.1993.10806592]
SAVITZ, D. (1993) 'Is statistical significance testing useful in interpreting data?', Reproductive Toxicology, 7, 2, p. 95-100. [doi:10.1016/0890-6238(93)90242-Y]
SCHMIDT, F. (1996) Statistical significance testing and cumulative knowledge in psychology: Implications for training of researchers, Psychological Methods, 1, p. 115-129. [doi:10.1037/1082-989X.1.2.115]
SCHMIDT, F. and Hunter, J. (1997) Eight common but false objections to the discontinuation of significance testing in the analysis of research data, in Lisa A. Harlow, Stanley A. Mulaik, and James H. Steiger (Eds.) What if there were no significance tests? Mahwah, NJ: Lawrence Erlbaum Associates. p. 37-64.
SCHWAB, A. Abrahamson, E., Starbuck, W. and Fidler, F. (2011) Researchers Should Make Thoughtful Assessments Instead of Null-Hypothesis Significance Tests, Organization Science, 22, 4, p. 1105-1120. [doi:10.1287/orsc.1100.0557]
SHROUT, P. (1997) Should Significance Tests be Banned? Introduction to a Special Section Exploring the Pros and Cons, Psychological Science, 8, 1, p. 1-2. [doi:10.1111/j.1467-9280.1997.tb00533.x]
SIMMONS J, Nelson L. and Simonsohn U. (2011) False-positive psychology: undisclosed flexibility in data collection and analysis allows presenting anything as significant, Psychological Science, 11: p. 1359-66. doi: 10.1177/0956797611417632. [doi:10.1177/0956797611417632]
STANG, A., Poole, C. and Kuss, O. (2010) The ongoing tyranny of statistical significance testing in biomedical research, European Journal of Epidemiology, 25, 4, p. 225-230 [doi:10.1007/s10654-010-9440-x]
SUTER, G. (1996) Abuse of hypothesis testing statistics in ecological risk assessment, Human and Ecological Risk Assessment, 2, p. 331-347. [doi:10.1080/10807039609383611]
THOMPSON, B. (2004) The "significance" crisis in psychology and education, The Journal of Socio-Economics, 33, p. 607-613. [doi:10.1016/j.socec.2004.09.034]
TRAFIMOW, D. and Rice, S. (2009) A test of the null hypothesis significance testing procedure correlation argument, The Journal of General Psychology, 136, 3, p. 261-269. [doi:10.3200/GENP.136.3.261-270]
TRYON, W. (1998) The Inscrutable Null Hypothesis, American Psychologist, 53, p. 796. [doi:10.1037/0003-066X.53.7.796.b]
TUKEY, J. (1991) The Philosophy of Multiple Comparisons, Statistical Science, 6, 1, p. 100-16. [doi:10.1214/ss/1177011945]
WALSTER, G. and Cleary T. (1970) A Proposal for a New Editorial Policy in the Social Sciences, The American Statistician, 241, p. 16-19.
WATTS, D. (1991) Why is introductory statistics difficult to learn?, The American Statistician, 45, 4, p. 290-291.
WHITE, JW, Rassweiler, A., Samhouri, J., Stier, A. and White, C. (2013) Ecologists should not use statistical significance tests to interpret simulation model results, Oikos, 123, 4, p. 385-388. [doi:10.1111/j.1600-0706.2013.01073.x]
YATES, F. (1964) Sir Ronald Fisher and the design of experiments, Biometrics 20, p. 307-321. [doi:10.2307/2528399]