by Renato Miguel Carmo, Margarida Carvalho and Frederico Cantante
ISCTE-IUL; EUROSTAT; ISCTE-IUL
Sociological Research Online, 20 (4), 16
<http://www.socresonline.org.uk/20/4/16.html>
DOI: 10.5153/sro.3810
Received: 18 Nov 2014 | Accepted: 22 Sep 2015 | Published: 30 Nov 2015
The aim of this article is to analyse the structural changes and continuities in Portuguese society over the two decades from 1988-2008. Although modernisation processes have intensified, the country still has a highly polarised social structure. This study included a multiple correspondence analysis and a cluster analysis, using sociological variables collected in a national database that covers all Portuguese companies. Developing this approach made it possible to not only produce different sociological profiles of social and class inequality, but also compare the structural changes in the labour force in these two decades (private sector). The study shows that although the space of social positions was mainly formed by three large socio-professional groups in both 1988 and 2008, their size and social composition changed, reflecting the social and economic trends experienced by Portuguese society in this period.
1.1 According to the indicators most commonly used to measure and compare income inequalities between countries, such as the S80/S20 and the Gini coefficient, Portugal is one of the most unequal countries in Europe. Since the late 1990s (when Eurostat began publishing regular data), Portugal has continually recorded the highest rates of economic inequality. Although these indicators are very useful for international comparisons, it is clear they only partially reveal the nature of these complex social phenomena. According to several authors (Costa 2012; Therbörn 2006), taking national income averages as the sole measure of inequality cannot produce a comprehensive picture of the social foundations underlying these structural discrepancies. The objective of this article is to demonstrate that despite the modernisation process and social reconfiguration that have recently taken place in the Portuguese economy and society, the structure of the labour force still reflects the persistence of polarised forms of inequality.
1.2 We analyse the development of the levels of inequality and social recomposition in Portuguese society over a 20-year period (from 1988 to 2008). These two decades represent the time between Portugal's accession to the European Community (in 1986) and the beginning of the financial and economic crisis (at the end of 2008), which had a tremendous impact on the national economy. Despite the modernisation trends brought about by the European Union's funding frameworks (whose economic impact started in the late 1980s), Portugal maintained a polarised social structure throughout this period. The hypotheses explored in this article are that the persistence of these structural factors coexisted with dynamics of pronounced social change, and that the labour force was the object of these two contradictory trends. We used a vast database that annually records information on establishments, companies and workers in the Portuguese economy (Quadros de Pessoal). It basically consists of demographic and socioeconomic variables, with social class (constructed later) proving particularly important. Our work shows that class is still a fundamental concept and indicator for an analysis of the structural changes that have been occurring in contemporary societies.
1.3 From a methodological point view, a multiple correspondence analysis (MCA) was carried out for each year (1988 and 2008) in order to project the different social positions on the factorial plots. Based on the configuration of these plans, we interpreted not only the main changes in Portuguese society, but also the factors related to social persistence. One of the topics of this article relates to this contrast between change and modernisation processes on the one hand, as expressed in the tertiarisation of the economy, increase in educational attainment and feminisation of the workforce, and the persistent configuration of a space of social positions based on a marked social polarisation between the dominant and subordinate classes on the other.
1.4 The article is divided into six sections. After the introduction, the second and third sections address various contemporary theories on the issue of social class, social space and the main drivers of inequality in the labour force. The fourth examines some of the sociological interpretations of Portuguese society that have underscored its dual nature. This is followed by an analysis of the indicators from the Quadros de Pessoal database, aimed at characterising their development during the period under analysis. Section six examines the space of social positions on the basis of the variables described and offers two factorial plans resulting from a multivariate analysis and cluster analysis for each year (1988 and 2008). The last section contains the author's final remarks.
2.1 The concept of social class was proposed by K. Marx and F. Engels (1997 [1872]) for an analysis of the level of social inequalities resulting from the capitalist mode of production. Although the authors considered that most types of society in history had been organised on the basis of a social class division, it was through the study of the social inequalities in capitalist society that this concept gained decisive importance. E. O. Wright (1997) carried out a complex interpretation of Marx's approach in order to uncover some of its contradictions and limitations. This author believes that social inequalities must be addressed from a relativistic perspective – i.e. the same class position can acquire different meanings depending on organisational contexts and power relationships. Though Wright is considered a neo-Marxist, his approach incorporates some of the aspects developed in Weber's perspective (1978 [1922]), in that he considers the resources that generate class inequality to be diverse and not necessarily connected solely with economic factors.
2.2 Influenced by Weber's perspective, other authors such as P. Bourdieu (1979), F. Parkin (1971) and M. Savage (2000) argue that inequalities and class differentiation may vary in different contexts and social spaces. In their view societies consist of relatively restricted social "arenas", characterised by the dominance of a given resource or capital (cultural, economic, social), in which different social classes compete with each other, depending on the level of capital acquired, in order to derive the greatest benefit for their interests. This process is characterised by an effective "social closure" that excludes a vulnerable set of groups and classes who are disadvantaged when it comes to taking certain opportunities in life.
2.3 The space of social positions is based on a dynamic perspective of an array of social relationships and structures whose configuration is the result of conflicting but relatively institutionalised processes in terms of access to and the mobilisation of certain resources of varying value or prestige. These forms of capital are unequally distributed and owned, which means that not everyone has the same opportunities to access and control valuable resources – e.g. degrees from privileged universities (Scherger & Savage 2010).
2.4 According to Bourdieu, the social space is defined by two vertical axes that correspond largely to the structure of social classes – one referring to economic capital and the other to cultural capital (which may be objective, institutional and incorporated). An individual's position in this space is defined on the basis of the structure and volume of his or her capital. In other words, a person's class in social space depends on both the composition and quantity of his or her capital. The structure and volume of capital, and therefore the relative position of individuals in social space, are simultaneously determined by their economic or educational resources and practices, representations or tastes (Bourdieu 1979).
2.5 The relationship with the different resources tends to define categories of individuals with specific life conditions and possibilities that are relationally different from each other (Stuber 2009). The accumulation and classist reproduction of the available resources therefore means that the differences in owning them are in fact inequalities between individuals, structurally situated in different positions in the social space (Savage 2000; Bihr & Pfefferkorn 2008; Bennett et al 2009).
2.6 Empirical evidence continues to show that the distribution of economic, cultural and symbolic resources tends to create unequal relationships between social classes (Erikson & Goldthorpe 1993; Wright 1997; Lareau & Dalton 2008; Savage 2006; Atkinson 2010; Atkinson, Roberts & Savage 2012).
2.7 The distribution of economic, cultural and symbolic resources and their relationship with a person's position in the labour market is an issue that has been prominent in sociological studies on social inequality (Crompton 2010). Through its various formulations and updates, the resulting plural perspective has built up a theoretical and conceptual heritage that can be used to examine various analytical dimensions. In this line of analysis, Bourdieu's viewpoint stood out most among those of contemporary authors (Lovell 2004; Sayer 2003).
2.8 Our statistical model, produced by multiple correspondence analysis (MCA), does not encompass variables related to practices and cultural capital, so it cannot strictly be considered an adaptation of Bourdieu's social space. In this article the space of social positions is analysed by using demographic, economic and educational variables regarding the Portuguese labour force in the private sector (Antunes 2011; Carmo & Nunes 2013).
3.1 Despite the growing relevance of capital, the major driver of income inequality in most countries is wages and salaries, which account for 75% of household income in OECD countries (Piketty 2013; OECD 2011a; Atkinson 2008). Although earning inequalities tend to be influenced by several interactive drivers, such as gender, type of contract, nationality, age, or labour market institutions, it has also been noted that education plays a decisive role (OECD 2011a). As a formal and dispositional resource, education lays out a range of opportunities for labour trajectories, in particular the professional activity and level of earnings a person can expect to achieve (Cuesta & Salverda 2007). Data from 2009 show that in OECD countries workers with tertiary education earned on average 53% more than those who did not go beyond the upper secondary level, and those who did not complete upper secondary education could earn on average 23% less than their counterparts who did (OECD 2011b: 138). Education delivers this kind of economic premium by structuring professional positions and trajectories. In a globalised world whose economy is closely linked to knowledge and innovation (Castells 2000), labour markets reward skilled and highly skilled workers. Labour markets made up of a skilled workforce therefore tend to have lower levels of earning inequality, withstanding the increase in 'wage dispersion associated with technological progress, regulatory reforms and institutional changes' (OECD 2011a: 31). In contrast, labour markets in which only a small portion of the workforce has higher levels of education and skills tend to have higher levels of wage and salary inequality.
3.2 A number of theoretical approaches have stressed the role played by education and skills in structuring professional pathways and earning levels – i.e. in stratifying the workforce. These perspectives suggest that in a globalised world, where economies are increasingly interconnected, one can identify certain relatively homogeneous professional classes at the international level. According to Reich's classic perspective (1992), the labour force in the US in the nineties was divided into three broad categories: 'symbolic analysts', 'routine production workers', and 'in-person service workers'. The first are highly educated and skilled workers, who process, interpret and manipulate information. The other two categories engage in low-skilled repetitive tasks based on interaction with objects and people respectively. S. Sassen (2005) introduces a three-category model of global classes – 'professionals and executives', 'government officials', and 'disadvantaged workers and activists', while A. Giddens presents a social class structure of post-industrial societies in which the most numerous social classes are the 'Apple Mac groups' (high-tech specialists) and the 'Big Mac workers' (Giddens 2007: 62).
3.3 One of the most important analytical perspectives constructed to explain this phenomenon was the hypothesis on the race between technology and education, or skill-biased technical change (SBTC). According to the "canonical" version of this approach, if technology increases the productivity of highly qualified workers more than the productivity of those without that profile, and if the number of highly qualified workers does not keep up with the demand for such labour, then both earning inequality and these workers' earning premium will necessarily increase. Atkinson (2008) concludes that this process is one of the key drivers of the increase in income inequality in OECD countries in recent decades. In its "nuanced view" (Kierzenkowski & Koske 2012), this approach states that productivity gains driven by technology and offshoring have led to a decrease in demand for routine workers with intermediate qualifications, whose tasks are easily substituted by technology or workers in other countries. On the contrary, technological change pays off for both highly qualified staff, who can adapt to these changes and perform non-routine abstract tasks (managers, professionals, technicians and those with scientific and creative occupations) –and, likewise, for low-skilled workers performing non-routine tasks that require interpersonal and contextual competences and cannot be performed by machines or through offshoring (Acemoglu & Autor 2010; Autor, Levy & Murnane 2003).
3.4 On the basis of this analytical framework, Acemoglu and Autor (2010) say that both the US and European labour markets have faced employment and wage polarisation, driven by decreasing demand for middle-wage, middle-skill occupations such as book-keeping, clerical work, repetitive production and monitoring jobs. Interestingly, they conclude that Portugal is the European country where this kind of middle-wage and middle-skill labour decreased the least between 1993 and 2006 (Acemoglu & Autor, 2010: 17). Another decisive feature of the development in the Portuguese labour market, and one that is highlighted in the literature, is top-wage "fanning out". Atkinson (2008) shows that Portugal is one the OECD countries where top wages have increased the most. For instance, the upper quartile "has risen by 16 per cent since 1982, and the top decile by nearly 40 percent" relative to the median (Atkinson 2008: 47).
3.5 Hartog et al. (2001) suggest that SBTC is the main explanation for the shift in demand towards educated labour between 1986 and 1992, in Portugal. They conclude that the growing demand for more highly educated labour was due to changes that had taken place "within industries rather than to a reallocation of employment between industries towards sectors requiring high-educated labour" –which is consistent with technological change (Hartog et al. 2001: 23). These changes may have been due to the country's entry into the EU in 1986, which boosted the modernisation of Portuguese industry by various means: "First, structural funds from the EU in combination with specific financial aids to industrial investment for modernisation of the productive structure have contributed to the introduction of new technologies. Second, the liberalisation of trade with more developed countries producing capital goods likely encouraged the importation of technology requiring skilled labour" (Hartog et al. 2001: 24).
3.6 The global economic environment determines the demand for labour, which in turn has a direct impact on social stratification processes. But to understand social stratification and inequality at the national level, we also have to look at the socio-educational composition of the workforce and the way it is connected with the country's economic profile. This relationship between income inequality and educational resources is one of the main drivers that produce a differentiation in the composition and configuration of the Portuguese labour force, as we will see from the statistical analysis.
4.1 Within the framework of the European Union, Portugal has a relatively low level of income. In 2008, the Portuguese GDP per capita was only 78% of the average for the EU countries; the average annual disposable income of Portuguese households was 10,393 euros, much lower than the EU27 figure of 16,814 euros. Besides being far below the EU27 average in wealth or income, Portugal is one of the EU27 countries with the highest internal income inequality. In 2008, the income of the richest 20% was six times higher than the income of the poorest 20%. Latvia (7.4), Romania (6.7), and Lithuania (6.4) were the only countries where this figure was higher, whereas Spain (5.9) and Greece (5.8) were just behind Portugal's level of inequality. Portugal was actually the EU country where income was most concentrated in the upper quantiles: the richest 20% and 10% earned 43.2% and 28.0% of total net income - the EU-27 average for these two figures was 38.7% and 24.1% respectively. One of the main features of Portuguese society relates to educational inequalities: in 2008, 71.8% of the population aged 25-64 had a lower-secondary education or less, 13.9% an upper-secondary education, and 14.3% a tertiary education. In the early 1990s the figures were even worse (about 80% of that age group had a lower secondary education) but, although there have been some important improvements, Portuguese figures are still far below the average for the EU and lower than those presented by other southern/peripheral European countries. For instance, 67.6%, 60.3%, 52.1% and 50.2 of the Irish, Greek, Spanish and Italian populations respectively completed at least upper-secondary education.
4.2 Tertiarisation is one of the main features of the Portuguese economy. In 2008, about 59% of the employed population was working in services (12% and 29% in the primary and secondary sectors, respectively), mainly in retail trade, administrative activities, real estate, the catering sector, health and consultancy (Statistics Portugal 2008). 81% of companies were classified as service companies and accounted for about 61% of total business. Another important feature of the Portuguese economy is the reliance on high rates of female activity, compared to other EU economies. According to data from Eurostat, in 2008 Portugal ranked seventh in this respect (56.2%), after northern countries. Female activity rates are particularly high in the younger age-cohorts, reaching more than 85% among the 25-34 and 35-44 age groups. However, although in comparative terms women tend to present a high level of participation in the labour market, they are paid much less than men. For instance, among workers with a tertiary education, men's wages are 32% higher than women's (Carvalho 2011). Class inequality in the Portuguese labour market seems to intersect with and be deepened by gender inequality (Crompton 2003). Determining how this relationship arose in the Portuguese space of social positions and how it evolved over our two decades is one of the analytic goals of this article.
4.3 These data show that Portuguese society is marked by profound inequality. This is not a recent phenomenon. On the contrary, as has been demonstrated by various Portuguese sociological studies, this polarised social configuration has persisted for over three decades (Carmo 2013).
4.4 In the mid-1960s, A. Sedas Nunes (1964) identified a structural opposition in Portuguese society that tended towards a complex development process. Analysing a diversified number of indicators, he differentiated between various geographical areas in the country on the basis of the degree of their socio-economic development, thereby distinguishing areas with larger populations, more developed means of communication and greater economic and social vitality (industrialisation, greater social heterogeneity, higher levels of educational attainment, diversification of the forms of communication) on the one hand, from less populated and less modern regions on the other. These contradictory trends underlay some of the views of Portuguese society that began to emerge in the second half of the 1980s. B. Sousa Santos (1990) claimed that Portugal could be defined as a semi-peripheral society that still maintained traditional traits of social organisation typical of more peripheral, rural societies, although its economy had undergone modernisation processes.
4.5 It is along these lines that F. L. Machado and A. F. da Costa (1998) and J. Ferrão (1996) consider that Portuguese society consists of contradictory processes characteristic of uncompleted modernity. They believe that, while many social and demographic indicators suggest Portugal is on the road to modernisation, it still has an array of pronounced deficiencies – e.g. the low educational levels of the population – that separate it from countries at a more advanced or later stage of modernity. However, when looking at the changes that occurred between the 1960s and 1990s, these authors point to some considerable modifications, such as the tertiarisation of economic activities, the feminisation of the student and employed populations, and certain forms of stratification and social recomposition. Their studies highlighted the gradual loss of importance of the agriculture-related classes, in favour of the categories associated mainly with the tertiary sector (professionals and managers and routine employees).
4.6 The present paper seeks to shed some light on the evolution of the Portuguese space of social positions over two decades. To what extent did the socio-economic and socio-demographic profile of the Portuguese labour force change significantly during that period? Did the space of social positions go through important shifts in terms of its social class composition and social class weight? These are the main questions we propose to address.
5.1 This article presents data which shows that despite the modernisation of economy between 1988 and 2008, Portugal is still a polarised society in terms of income (earnings) and the kinds of employment status people possess. The analysis and comparison of this period is based on the Quadros de Pessoal database – an instrument which the Strategy and Planning Office at the Ministry of Labour and Social Solidarity (GEP/MTSS) uses to collect annual information from all Portuguese companies. It covers a number of characteristics of their establishments (location, classification of economic activity, size, sales volume etc.) and the employees working there (sex, age, educational level and basic pay, among other variables). No such databases are available for the public sector, which is why our analysis only considers the private sector.
5.2 This database consists of demographic and socioeconomic variables, from which we have constructed a typology of social class. This typology is called ACM (Almeida, Costa and Machado) and is based on the Individual Socioprofessional Class Indicator, which is a variable that is itself based on occupation and occupational status (Machado and Costa 1998). As in the case of the widely known typology designed by Erikson and Goldthorpe (1993), "these variables are complemented by information on various aspects of people's working situation such as occupational skills, hierarchical position in organisations and the sector of activity" (Antunes 2011: 396). It consists of the following classes: entrepreneurs and executives (EE) are employers or directors in private companies or the public administration and may be recruited from any of the groups in the occupational structure; professionals and managers (PM) are employees in upper or mid-level intellectual, scientific and technical jobs; the self-employed (SE) work on their own account, without employees, in administrative or similar occupations in services and commerce; routine employees (RE) are administrative and similar personnel, service employees and salespeople; and industrial workers (IW) and agricultural workers (AW) are manual workers employed in less skilled occupations (cf. Carmo & Nunes 2013). Although this database covers employers as well as employees, we only consider the latter, as they are the focus of our analysis.
5.3 In order to understand both workers' positions in the space of social positions and the changes that occurred over this 20-year timeframe, a multiple correspondence analysis (MCA) was performed for the initial and final years of the series. "One of the advantages of this method is the possibility of a graphic representation of the multiple connections between the categories making up the variables and the projection of the position of each object (individual) on a factorial plot. The configuration of the plot is the result of cross-referencing two factors (or dimensions) formed by the polarisation established by the levels of discrimination of the different categories[1]. Thus, people with similar response patterns tend to be positioned at coordinates close to the factorial plot, unlike others whose response patterns have a different statistical and sociological significance. Graphic proximity therefore indicates a certain statistical homogeneity" (Carmo & Nunes 2013: 10-11). This method makes it possible to draw a graph of multiple associations between the categories making up the variables and the position of each object (individual) on the factorial plot (Carvalho 2008).
5.4 The variables considered were sex, age group (we excluded the small number of workers aged below 15), pay scale (pay at constant prices (2006) and only for full-time and fully paid workers), education level, social class, and the employer/establishment's economic activity. We only considered full-time and fully paid workers, who made up 82% of all workers employed in 1988 (N=1,545,392) and 75% in 2008 (N=2,278,538).
6.1 The following section will address the social composition of the Portuguese population employed in the private sector and the changes in the different branches of activity. The indicators confirm many of the trends identified in the previous points.
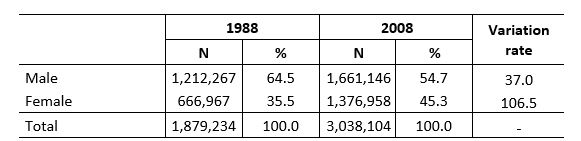
6.2 As indicated in Table 1, during the period in question the number of workers in the private sector in Portugal increased by over a million – a substantial increase in the employed working-age population in this sector. The increase was particularly significant among women, whose number more than doubled.
| Table 1. Workers by sex in 1988 and 2008 (number and percentage) and variation rate |
|
| Source: Quadros de Pessoal 1988 and 2008 (GEP/MSSS). Missing values 1988: 0. Missing values 2008: 0. |
6.3 These 20 years witnessed more than a numerical increase in and the feminisation of the employed population. The profile of its members also changed, as they tended to become better qualified, older and better paid. There was also a restructuring of the sectors and branches of activity and new occupations appeared. The roots of this trend lie in both the improvement in the school attainment levels of the Portuguese population in the two decades in question and the readjustment of the Portuguese economy, in particular the growth in the relative weight of jobs and economic activities that rely on skilled employees and demand abstract, non-routine skills and expertise. These changes represent the share of the Portuguese economy and labour market that has been able to keep up with the challenges posed by the knowledge society, globalisation and the growing demand for human capital.
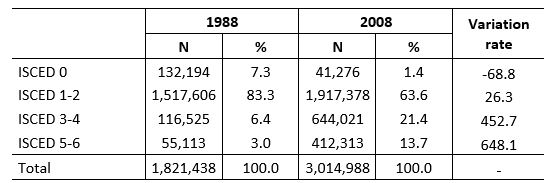
6.4 Table 2 shows the levels of workers' educational attainment in the two years considered. Over 20 years, the percentage of workers who completed their primary education but did not go beyond the lower secondary education level (ISCED 1-2) decreased considerably (although in absolute terms there was an increase of around 400,000 in the workers who attained that level of schooling). Workers with tertiary education (ISCED 5-6), who represented only 3% of the total in 1988, accounted for 14% in 2008. The employment rates among highly educated Portuguese were relatively high until 2008 (above 84%). There was also a substantial increase in secondary and upper-secondary (ISCED 3-4) educational attainment – to 21%.
| Table 2. Workers' education level in 1988 and 2008 (number and percentage) and variation rate (ISCED 1997) |
|
| Source: Quadros de Pessoal 1988 and 2008 (GEP/MSSS). Missing values 1988: 57.796. Missing values 2008: 23.116. |
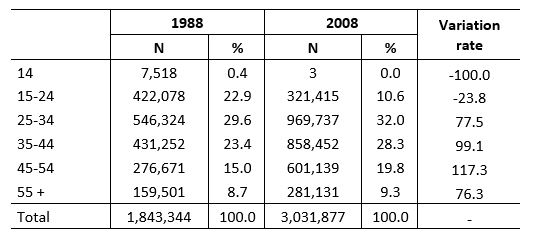
6.5 Regarding age groups, it is clear that Portuguese workers have grown older, especially following the reduction in workers aged below 25. While in 1988 around 23% of workers were in the 15-24 age group, in 2008 this figure had fallen to 11%, a reduction of almost 24% in terms of the variation rate (Table 3). On the other hand, workers aged over 45, who accounted for 24% of the total in 1988, represented 29% in 2008. This figure can be partially explained by an increase and extension of the Portuguese population's educational trajectories (especially the younger strata) during the period, one of the main effects of which was to delay the entry of a substantial portion of workers into the labour market.
| Table 3. Workers' age in 1988 and 2008 (number and percentage) and variation rate |
|
| Source: Quadros de Pessoal 1988 and 2008 (GEP/MSSS). Missing values 1988: 35.890. Missing values 2008: 6.227. |
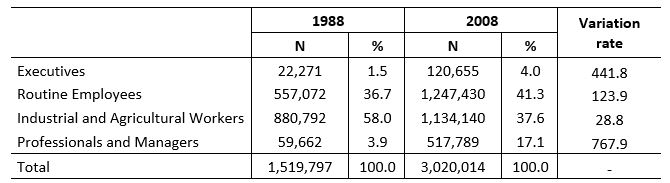
6.6 There was also profound social recomposition, especially in the different social classes to which Portuguese workers belong (Table 4)[2]. Three classes grew considerably, the exception being industrial and agricultural workers, who represented 58% of workers in 1988 and 38% in 2008 (even though their numbers increased by around 29%). The most significant increase was in professionals and managers, who went from 4% to 17%. The routine employee class had the largest number of workers in 2008, at 41% of the total.
| Table 4. Workers' social class in 1988 and 2008 (number and percentage) and variation rate |
|
| Source: Quadros de Pessoal 1988 and 2008 (GEP/MSSS). Missing values 1988: 359.437. Missing values 2008: 18.090. |
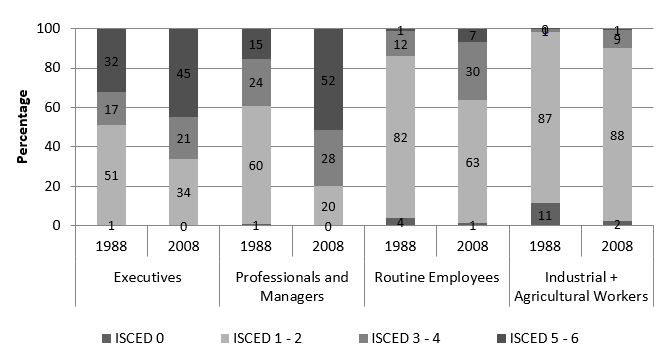
6.7 The professionals and managers' class not only increased exponentially, but also became better educated. While in 1988 60% of the educational qualifications of professionals and managers lay within the primary and lower secondary education levels (ISCED 1-2), in 2008 those with tertiary qualifications (ISCED 5-6) accounted for 52% (Figure 1). Industrial and agricultural workers were the class whose qualifications progressed the least in these two decades; although the percentage of workers who had not completed pre-primary school (ISCED 0) went down, the vast majority failed to go beyond lower secondary education (ISCED 2).
|
| Figure 1. Education level (ISCED 1997) by social class and year (percentage) |
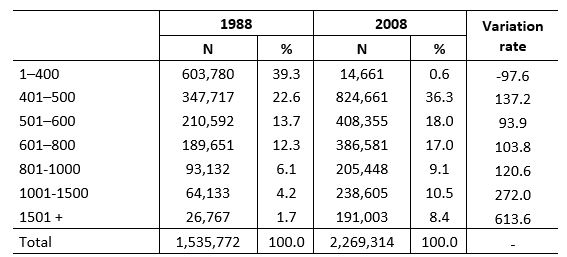
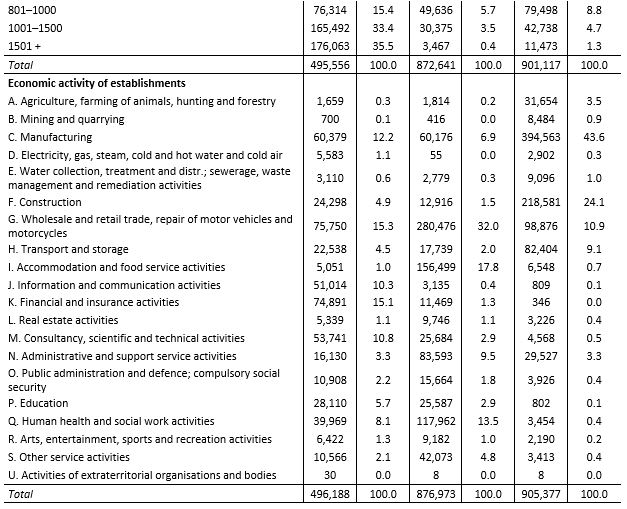
6.8 In terms of pay, there was an overall increase in salaries (Table 5), an increase that was particularly significant in the case of workers earning more than 1,501 euros. As the Portuguese economy went through the tertiarisation process, along with an improvement in the skills and qualifications of the labour force, highly skilled employees who were capable of carrying out complex and abstract tasks saw their wage premium increase far more than average output. This is why the share of workers earning 1,501 euros or more increased by 614% in two decades. Nevertheless, Table 5 shows that the greater part of the Portuguese workforce continued to earn low wages: for instance, in 2008, 36% earned between 401 and 500 euros per month.
| Table 5. Workers' pay scales (euros) in 1988 and 2008 (number and percentage) and variation rate |
|
| Source: Quadros de Pessoal 1988 and 2008 (GEP/MSSS). Note: pay at constant prices (2006) and only for full-time and fully paid workers. Missing values 1988: 343.462. Missing values 2008: 768.790. |
7.1 This section will examine the concept of space of social positions, using the Quadros de Pessoal database variables, and will look at the labour force as a space of differentiated positions. The configuration of the space of social positions reveals oppositions and correlations between demographic characteristics and the ownership of different capitals. The statistical model was produced using multiple correspondence analysis (MCA).
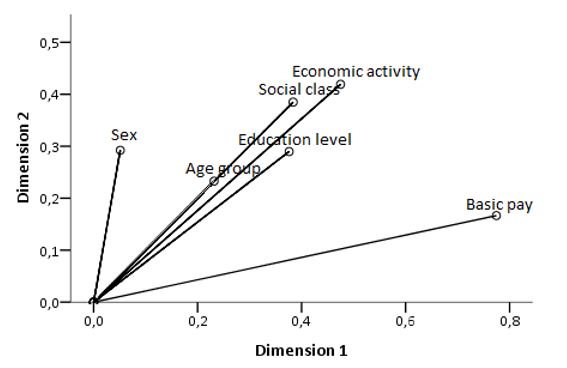
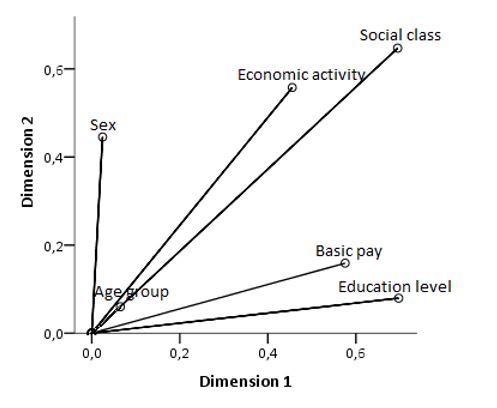
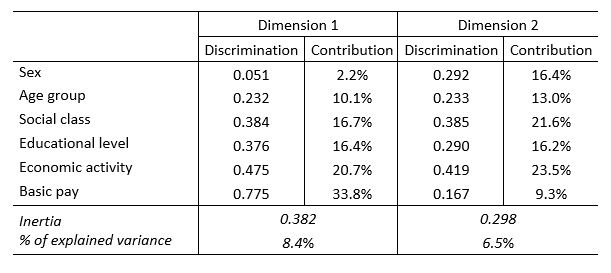
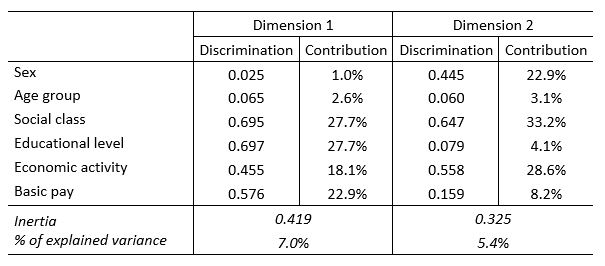
7.2 Figures 2 and 3 show the association between variables and their importance in defining the dimensions under analysis for each year. Tables 8 and 9 (see appendix) give the values for these discrimination measures and their contribution to the definition of each dimension.
7.3 An initial observation is that age became less important as a discriminating variable between 1988 and 2008. Next, it is possible to see that in both years basic pay was structuring in Dimension 1, as was gender in Dimension 2. Social class and the economic activity of the establishment were important in defining both dimensions (in 1988 and 2008), with the former gaining importance in this period. In 2008, social class was the most important variable in the definition of both dimensions.
7.4 It is possible to say that the space of workers' social positions in Portuguese companies in 1988 and 2008 was structured by two dimensions (see appendix Tables 8 and 9). Dimension 1 was more associated with economic and educational capital (educational level and basic pay), and Dimension 2 with the socio-demographic differentiation of workers (gender and age).
|
| Figure 2. Discrimination dimensions and measures in the MCA (1988) |
|
| Figure 3. Discrimination dimensions and measures in the MCA (2008) |
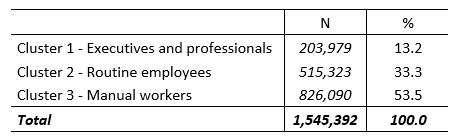
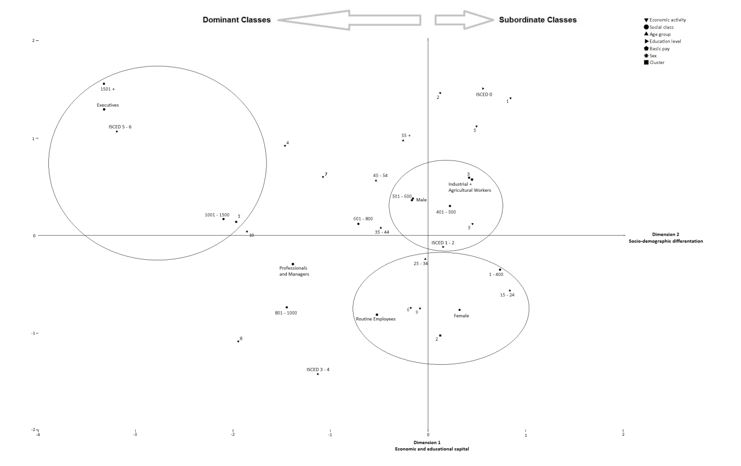
7.5 Projection of the MCA onto a plan and a subsequent cluster analysis identified three social profiles with very different social positions in 1988 (Figure 4). The profiles are clearly substantially marked by social class. Although the composition of each cluster is not limited to this variable, we consider that it permits the identification of the foremost traits of the social cleavage, as is clearly shown by the proportion in each set. Cluster 3, labelled 'Manual Workers', includes more than half the workers (54%); Cluster 2, 'Routine Employees', around 33%; and Cluster 1, 'Executives and Professionals', 13% of the population employed in the private sector.
7.6 We therefore have a highly stratified social space polarised between dominant social positions, as a minority, and a vast majority of more subordinate social strata (see Figure 4).
| Table 6. Workers by cluster in 1988 (number and percentage) |
|
7.7 Cluster 1, 'Executives and Professionals', is highly masculinised (87% are men)[3]. These workers are aged between 35 and 54 (64%) and display an ambiguous profile in terms of educational qualifications: although the majority only have a basic education (64%), it is also the cluster where workers with a tertiary education are most represented (20%). These workers have the highest pay levels (an average of 1,041 euros[4]). This cluster's profile is also mixed in terms of social class, as more than half the individuals (63%) are routine employees, 16% are professionals and managers and 12% are executives. It is the cluster with the least weight, although it holds a dominant position in the social space, as it contains the professional activities with the greatest degree of organisational authority and also the highest incomes. The firms where the employees forming this cluster work belong to the following sectors: banking and other financial institutions, insurance, real estate and business activities (31%), transport, storage and communications (30%), manufacturing (16%) and wholesale and retail and the restaurant and hotel industry (11%).
7.8 Cluster 2, 'Routine Employees', concentrates 33%. Tertiary sector activities are very important in this cluster: a large proportion of Portuguese workers working in the wholesale and retail trade, restaurant and hotel sector, and community, personal and social service activities, are in this cluster (73% and 68%, respectively). The type of work is reflected in the social class to which the workers belong, as 80% are routine employees. Where the demographic profile is concerned, this is the most feminised cluster (65%), a finding related to the fact that it is the cluster most associated with services. This cluster is younger than the others, as 71% of its workers are aged up to 34. Their educational levels are low: 87% have only a primary or lower secondary education, though 13% also have an upper secondary or non-tertiary post-secondary education. Their pay is relatively low (444 euros on average).
7.9 Cluster 3, 'Manual Workers', is mainly made up of men (81%) aged up to 44 (73%), with very low educational attainments (11% have not completed primary school, and 88% did not go beyond a lower secondary education). This cluster almost entirely comprises industrial workers (92%), who mainly work in manufacturing (63%). It also includes workers employed in more traditional sectors: 98% of workers in the agriculture, forestry, hunting and fishing sectors and 94% of those in the mining and quarrying sector. Their pay is low, at an average of 458 Euros.
|
| Figure 4. Structural space of social positions (1988) |
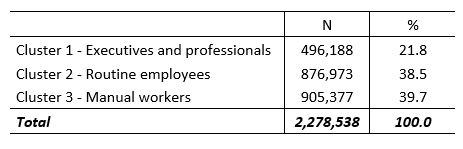
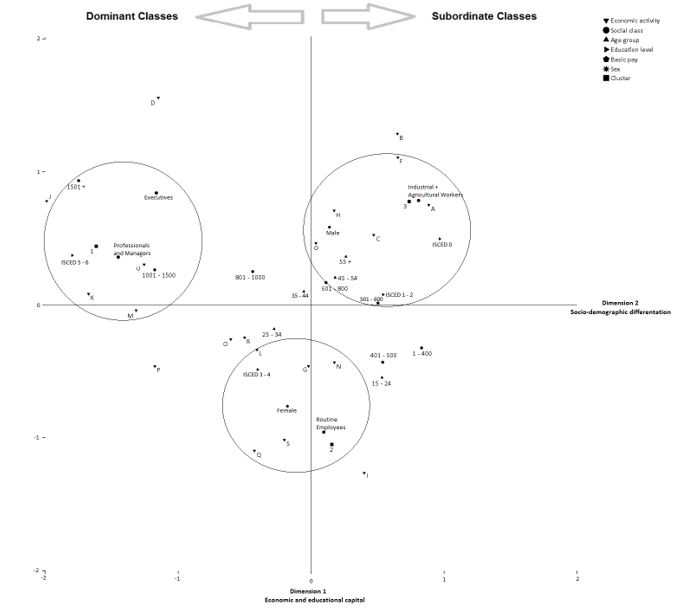
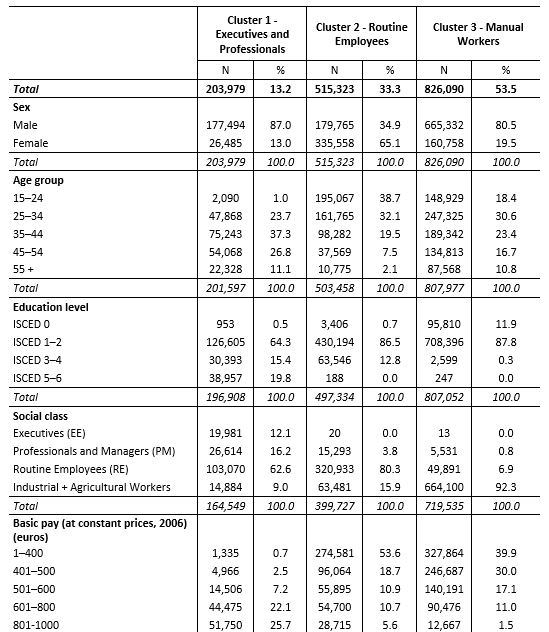
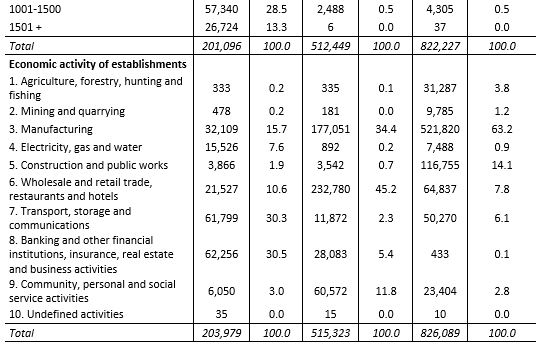
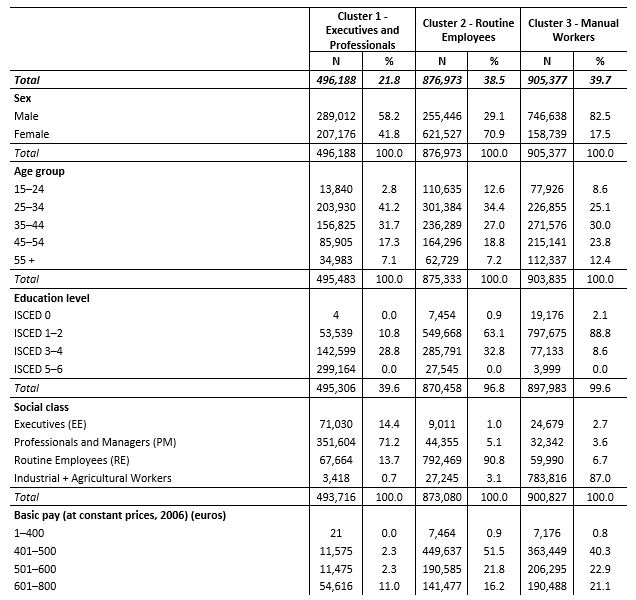
7.10 In 2008, the structural space of the social positions of the employees of Portuguese companies was still characterised by three clearly differentiated profiles (Figure 5). Table 7 shows the weight of each cluster: Clusters 2 and 3 have balanced percentages at around 40%, while Cluster 1 contains 22% of the workers.
| Table 7. Workers by cluster in 2008 (number and percentage) |
|
7.11 Cluster 3, 'Manual Workers', is the largest (40%) and has the highest percentage of men, at 83%. It is also the one in which the workers' educational levels are the lowest, as 89% have at most a lower secondary education. These are mainly industrial and agricultural workers (87%) who work in manufacturing (44%) and construction (24%) firms. Their average pay is low, at 607 euros per month.
7.12 Cluster 2, 'Routine Employees', contains 39% of the workers and is mainly occupied by women (71%). Its workers are younger than in Cluster 3, as 74% are less than 44 years old. In terms of school qualifications, 63% have attained at most a lower secondary education and 33% an upper secondary or post-secondary non-tertiary education. They are mainly routine employees (91%) working in the wholesale and retail trade (32%), accommodation and food service activities (18%) and human health and social work activities (14%). On average their pay is relatively low, at 558 euros.
7.13 Cluster 1, 'Executives and Professionals', has 22% of the workers and is in a clearly dominant position in terms of economic and educational capital. Even so, its profile is not homogeneous, as it comprises a majority of professionals and managers (71%), while executives (14%) and routine employees (14%) are also significant. Men represent 58%. Many workers in this cluster work in the wholesale and retail trade (15%) and financial and insurance activities (15%), but there are also significant percentages who work in manufacturing (12%), consultancy, scientific and technical activities (11%) and information and communications (10%). On average their pay levels are the highest, at 1,566 euros.
|
| Figure 5. Structural space of social positions (2008) |
7.14 A general comparison of the main changes in the period reveals that on the one hand there were alterations in the composition of the clusters, and on the other a social space that continued to be highly polarised and displayed a hierarchy between dominant positions and subordinate classes. Starting with the latter issue, it became evident that the social space of private sector workers in Portugal remained highly stratified. The weight of the cluster corresponding to dominant positions increased substantially (from 13% to 22%), although even so it represented a minority compared to the rest of the working population, which totalled almost 80%. In this sense, there was still a clear hierarchy between positions in the social space – mainly a contrast between employees who have medium or high salaries and a low-paid majority.
7.15 Despite this general picture pointing to a certain social reproduction, there were also some changes that basically resulted from the effects of educational attainment and the feminisation and tertiarisation of the labour force. Although very low levels of attainment still predominate, there is no doubt that the qualifications of the human resources in the private sector have improved. This can mainly be seen in the increase in professionals and executives. This class not only proportionally increased its weight in the period in question, but was also the one that played the greatest role in the space of social positions and became predominant in Cluster 1. As mentioned above, this was the class that progressed most in terms of educational qualifications and showed the highest growth rate, a fact that reflects an increase in the importance of the scientific, consultancy and banking sectors.
7.16 This significant change is connected with the change in the composition of the dominant group. In 1988 it was the smallest group of workers and consisted mainly of men. They were mainly routine employees (63%), although if the variable distribution among clusters is taken into account, almost all executives (99.8%) were concentrated in this cluster.
7.17 In 2008, the dominant cluster in the space of social positions was not so limited and had grown in size. Its structure had changed and professionals and managers were now in the majority, education levels were higher than 20 years before, and there were more women. In 1988 these workers' activities were divided among a number of sectors, while in 2008 there was a higher concentration in intellectual and scientific activities.
7.18 While in 1988 this cluster stood out from the rest, due basically to its greater economic capital and higher organisational control, in 2008 it was educational capital that made the difference. In a context in which the principles of labour stratification have been increasingly defined on the basis of academic certification (although the importance of educational certificates in labour market outcomes varies across countries (Bol & Werfhorst 2011)), the possession of educational capital in the definition of belonging and gaining access to dominant positions in the Portuguese social space is crucial.
7.19 There was also a change in the composition of the subordinate classes. The feminisation of Cluster 2, 'Routine Employees', became more pronounced. This trend was due primarily to the increase in the number and proportion of routine employees in the labour market. It is a profile highly marked by a female population that mainly works in the tertiary sector and has mid-level school attainments.
7.20 With the loss of importance of the more traditional sectors (such as agriculture, mining and quarrying and others), the cluster comprising mostly industrial workers mainly represented manufacturing and construction activities. It therefore had a highly masculinised profile, associated with manual labour and low educational qualifications. In very general terms, it may therefore be said that there were two majority profiles in the subordinate classes in 2008, though they were not exclusive: on the one hand, men performing manual work mainly in manufacturing and construction, and on the other, women with routine jobs in the tertiary sector, e.g. in commerce, services and administrative activities.
8.1 Two contradictory but also complementary views emerge from a comparison between the factorial plots at two junctures in Portuguese society 20 years apart. On the one hand, we can note that the configuration of the space of social positions did not change substantially, and there continued to be considerable social stratification and a significant hierarchy between the dominant and subordinate classes. On the other, it was also possible to see profound alterations in the social composition of this same social space. The persistence of structural factors thus coexisted with dynamics of marked social change. In other words, Portuguese society maintained its dual nature, despite undergoing intense social recomposition.
8.2 This recomposition was basically due to an increase in the population's educational attainments, the tertiarisation of the economy, and the feminisation of the labour force. As a consequence, the private sector witnessed a considerable degree of modernisation and improvement in skills and qualifications among its workforce, which in turn resulted in an expansion of the professional and managerial class and a more important place for them among the more advantaged classes. However, these changes did not alter the general framework that still marked the subordinate classes – i.e. for a substantial proportion of Portuguese workers, inadequate educational qualifications and low pay. In fact, the dynamics of social reproduction were still highly present, especially in the classes performing manual and routine work. We can thus conclude that social class still counts as an analytical concept generated by diverse resources (mainly economic and educational ones) which help us interpret the recent social trends that have been emerging in contemporary societies (Atkinson 2010).
8.3 This analysis of the composition of the space of social positions in the private sector reveals the dissonant profile of Portuguese society, determined by the articulation of contradictory processes, as has been pointed out by different sociologists (Machado and Costa 1998; Santos 1990). Since the 1980s these processes have demonstrated the unfinished nature of modernisation, where social reproduction factors coexist with those of change.
1 'Discrimination measures quantify the variance of each variable and so the closer their value is to the upper limit (i.e. 1) the more the variable discriminates the objects analysed' (Carvalho 2008: 75).
2 As it is numerically insignificant (around 2% of the total) and has a socioeconomic profile similar to the Industrial Workers class, the Agricultural Workers class has been included with those for/in the two years in question.
4 Values at constant prices (2006).
| Table 8. Contribution of variables in the MCA (1988) |
|
| Table 9. Contribution of variables in the MCA (2008) |
|
| Table 10. Cluster Profile in 1988 |
|
| Table 11. Cluster Profile in 2008 |
|
ACEMOGLU D and Autor D (2010) 'Skills, tasks and technologies: Implications for employment and earnings', NBER Working Paper No. 16082.
ANTUNES R (2011) 'The social space of health inequalities in Portugal', Social Theory & Health, Vol. 9, No. 4, p. 393-409. [doi:10.1057/sth.2011.17]
ATKINSON A B (2008) The Changing Distribution of Earnings in OECD Countries. Oxford: Oxford University Press. [doi:10.1093/acprof:oso/9780199532438.001.0001]
ATKINSON W, Roberts S and Savage M (2012) (eds.) Class Inequality in Austerity Britain: Power, Difference and Suffering. Hampshire: Palgrave Macmillan.
ATKINSON W (2010) Class, Individualization and Late Modernity: in Search of the Reflexive Worker. Hampshire: Palgrave Macmillan. [doi:10.1057/9780230290655]
AUTOR D H and Levy F, Murnane R J (2003) 'The skill content of recent technological change: An empirical exploration', Quarterly Journal of Economics, Vol. 116, No. 4, p. 1279-1333. [doi:10.1162/003355303322552801]
BENNETT T, Savage M, Silva E, Warde A, Gayo-Cal M and Wright D (2009) Culture, Class, Distinction. London: Routledge.
BIHR A and Pfefferkorn R (2008) Le Système des Inégalités. Paris: La Découverte.
BOL T and Werfhorst H G (2011) 'Signals and closure by degrees: The education effect across 15 European countries', Research in Social Stratification and Mobility, Vol. 29, No. 1, p. 119-132. [doi:10.1016/j.rssm.2010.12.002]
BOURDIEU P (1979) La Distinction. Paris: Éditions de Minuit.
CARMO R M (2013) 'Polycentrism as a multi-scalar relationship between urban and rural areas: the case of Portugal', European Planning Studies, Vol. 21, No. 2, p. 149-166. [doi:10.1080/09654313.2012.722912]
CARMO R M, Nunes N (2013) 'Class and social capital in Europe: a transnational analysis of the European Social Survey', European Societies, Vol. 15, No. 3, p. 373-387. [doi:10.1080/14616696.2012.691171]
CARVALHO M (2011) 'A persistência das desigualdades remuneratórias de género nas empresas portuguesas: 1988-2008', http://observatorio-das-desigualdades.cies.iscte.pt/index.jsp?page=projects&id=116.
CARVALHO H (2008) Análise Multivariada de Dados Qualitativos. Lisbon: Ediçõ es Sílabo.
CASTELLS M (2000) The Rise of the Network Society. Oxford: Blackwell.
COSTA A F (2012) Desigualdades Sociais Contemporâneas. Lisboa: Editora Mundos Sociais.
CROMPTON R (2003) 'Class and gender beyond the cultural turn', Sociologia, Problemas e Práticas, No. 42, p. 9-24.
CROMPTON R (2010) 'Class and unemployment', Work, Employment and Society, Vol. 24, No. 1, p. 9-26. [doi:10.1177/0950017009353667]
CUESTA M B, Salverda W (2007) 'Low pay incidence and mobility in the Netherlands – exploring the role of personal, job and employer characteristics', Amsterdam Institute for Advanced Labour Studies, Working Paper Number 06/46.
ERIKSON R and Goldthorpe J H (1993) The Constant Flux: A Study of Class Mobility in Industrial Societies. Oxford: Clarendon Press.
FERRÃO J (1996) Três décadas de consolidação do Portugal demográfico moderno, in Barreto A (Ed.) A Situaçã o Social em Portugal, 1960-1995, Lisbon: ICS, p.165-190.
GIDDENS A (2007) Europe in the Global Age. Cambridge: Polity Press.
HARTOG J, Pereira P T, Vieira J A C (2001), 'Changing returns to education in Portugal during the 1980s and early 1990s: OLS and quantile regression estimators', Applied Economics, No. 33, p. 1021-37. [doi:10.1080/00036840122679]
KIERZENKOWSKI R and Koske I (2012), 'Less income inequality and more growth – are they compatible? Part 8. The drivers of labour income inequality – a literature review', OECD Economics Department Working Papers, No. 931, OECD Publishing.
LAREAU A, Dalton C (2008) (eds.) Social Class: How does it Work. New York: Russell Sage Foundation.
LOVELL T (2004), 'Bourdieu, class and gender: 'The return of the living dead?'', The Sociological Review, No. 52, p. 35-56. [doi:10.1111/j.1467-954x.2005.00523.x]
MACHADO F L, Costa A F (1998) Processos de uma modernidade inacabada, mudanças estruturais e mobilidade social, in Viegas J M, Costa A F (eds.), Portugal, que modernidade?, Oeiras: Celta Editora, p.17-44.
MARX K and Engels F (1997 [1872]) O Manifesto do Partido Comunista. Lisbon: Ediçõ es Avante.
NUNES A S (1964) 'Portugal, sociedade dualista em evoluçã o', Análise Social, No. 7/8, p. 407-462.
OECD (2011a) Divided We Stand: Why Inequality Keeps Rising. Paris: OECD Publications.
OECD (2011b) Education at a Glance 2011. Paris: OECD Publications.
PARKIN F (1971) Class Inequality and Political Order. London: Granada.
PIKETTY T (2013) Le Capital au XXI Siècle. Paris: Seuil.
REICH R B (1992) The Work of Nations: Preparing Ourselves for 21st Century Capitalism. New York: Vintage Books.
SANTOS B S (1990) Estado e Sociedade em Portugal (1974-1988). Porto: Edições Afrontamento.
SASSEN S (2005) New global classes: implications for politics, in Giddens A, Diamond P (eds.) The New Egalitarianism, Cambridge: Polity Press, p. 143-153.
SAVAGE M (2006) 'Changing Social Class Identities in Post-War Britain: Perspectives from Mass-Observation' Sociological Research Online, Vol. 12, Issue 3: http://www.socresonline.org.uk/12/3/6.html.
SAVAGE M (2000) Class analysis and social transformation. Buckingham: Open University Press.
SCHERGER S and Savage M (2010), Cultural transmission, educational attainment and social mobility. The Sociological Review, Vol. 58, No. 3, p. 406-428. [doi:10.1111/j.1467-954x.2010.01927.x]
SAYER A (2002) 'What Are You Worth?: Why Class is an Embarrassing Subject' Sociological Research Online, Vol. 7, Issue 3, http://www.socresonline.org.uk/7/3/sayer.html. [doi:10.5153/sro.738]
STATISTICS PORTUGAL (2008), Empresas em Portugal 2008 (Companies in Portugal 2008), Statistics Portugal Publications.
STUBER J (2009) 'Class, culture and participation in the collegiate extra-curriculum', Sociological Forum, Vol. 24, No. 4, p. 877-900. [doi:10.1111/j.1573-7861.2009.01140.x]
THERBORN G (ed.) (2006) Inequalities of the World. New Theoretical Frameworks, Multiple Empirical Approaches. London: Verso.
WEBER M (1978 [1922]) Economy and Society: an Outline of Interpretive Sociology. Berkeley: University of California Press.
WRIGHT E O (1997) Class Counts: Comparative Studies in Class Analysis, Cambridge: Cambridge University Press.