Talking Ties: Reflecting on Network Visualisation and Qualitative Interviewing
by Louise Ryan, Jon Mulholland and Agnes Agoston
Middlesex University London; Middlesex University; Middlesex University
Sociological Research Online, 19 (2) 16
<http://www.socresonline.org.uk/19/2/16.html>
10.5153/sro.3404
Received: 22 Sep 2013 Accepted: 15 May 2014 Published: 31 May 2014
Abstract
This paper uses a reflexive approach to consider the opportunities and challenges of using a visualisation tool in qualitative research on social networks. Although widely used to map social networks over many decades, particularly in health studies and psychology, network visualisation tools are less common in qualitative sociological research. While recent trends in Social Network Analysis (SNA) have tended to concentrate within the quantitative domain, our paper is influenced by the 'cultural turn' in network research, and aims to respond to calls for more exploration of how social ties are constructed and represented in qualitative research. Having used a target sociogram to visualise the networks of highly skilled migrants, we reflect critically on how this tool, far from being a neutral data collective device, influences how networks were described, explained, and perceived by participants. Focusing on the dynamics within the interview encounter, especially in the context of 'researching up', we explore participant reactions, what we learned and might do differently, next time. We conclude that, despite certain limitations, the sociogram helped mitigate the abstract nature of some topics by connecting them to specific groups of people drawn on the diagram. The tool not only enhanced participants' reflection process but allowed certain topics to emerge which might have not otherwise surfaced, hence greatly contributing to the collection of rich data. Nonetheless, as we discuss, there are also ethical issues associated with its use.
Keywords: Qualitative Research, Social Networks, Visualisation Tools, Highly Skilled Migrants, Interview Dynamics, Social Ties
Introduction
1.1 This paper offers a reflexive account of our experiences of using a sociogram to visualise the social networks of highly skilled migrants. This small study grew out of our earlier project on highly skilled French migrants in London's financial and business sectors (Mulholland and Ryan 2011). In this second wave of in-depth qualitative interviews we revisited a sample of original participants to collect richer data on particular topics, especially social networks. In order to explore participants' networks in more depth we introduced a mapping tool which had not been part of our original study. This enabled a visualisation of social ties, to explore not just network structure (density and range of ties) but also the ways in which participants constructed their social relationships through talk and images. We were especially keen to understand the composition and meanings of social relationships, as well as the interplay between emotional and geographical closeness.1.2 Using a reflexive approach, we discuss our experiences of using the tool, participants' reactions, what we learned, and might do differently next time. In particular, we consider how this relatively simple, paper-based sociogram was perceived by highly skilled migrants, many of whom held positions of authority in large corporations. In the context of 'researching up' (Puwar 1997), we discuss how this visualisation tool impacted on shifting power relations within the interview encounter. In addition, we explore how the tool may have shaped the ways in which networks were described. How do sociograms actively contribute not just to visualising but also perceiving social relationships?
1.3 Although this tool has been widely used to map social networks over many decades (Freeman 2000), particularly in health studies and psychology, it is less common in sociological research (McCarthy et al 2007, but see Weller and Edwards 2011). As sociologists, we are not aware of any reflexive account of its use within our discipline, especially when interviewing highly skilled professionals, and so this paper aims to contribute to a more critical understanding of how it might be used in qualitative sociological research.
Analysing Social Networks
2.1 While there has been considerable research on migrant networks, these studies usually focus on economically disadvantaged migrants. By contrast less attention is paid to how highly skilled migrants access and use networks to generate particular resources (Ryan and Mulholland 2014). Our project is innovative in examining the networking strategies of highly skilled migrants in London's financial sector.2.2 A social networks paradigm examines the relationships between individuals and, by mapping these connections, 'describes the unique structures, patterns and compositions of networks' (Cheong et al 2013: 3) and considers how these influence behaviour (Carrasco et al 2006) and social identities (Ibarra and Deshpande 2006). A study of networks allows us to locate actors within their wider social relationships. As Trotter has argued, the value of a network-approach lies in its ability: 'to move beyond the level of the individual and the analysis of individual behaviour into the social context where most people spend the vast majority of their lives, living and interacting with the small groups that make up the world around them' (cited in Heath et al 2009: 649).
2.3 Networks of support have a profound influence on the well-being of the individual (Marmot et al 2010). Our needs for different kinds of resources form part of 'the driving force in the construction of the network' which may also reflect our changing needs through the life course (Samuelsson et al 1996: 328). Over time, different resources, accessed and shared through varied social relationships including kin, friends, neighbours and work colleagues, can provide a buffer against risks including poor physical and psychological health (Marmot et al 2010). As Marmot et al conclude: 'people with stronger networks are happier and healthier' (p.136-7). Our research, in the context of intra-EU highly skilled migration, demonstrated the importance of social networks to: the realisation of social, cultural and mobility capital (Ryan and Mulholland 2014a); the reproduction of social identities; and the ways in which migrants use, and are impacted by, the urban spaces they inhabit (Mulholland and Ryan 2014b).
2.4 While much of the research in Social Network Analysis (SNA) has developed within the quantitative domain (Crossley 2010), there have been arguments in favour of using qualitative methods (Heath et al 2009). In-depth approaches, such as interviewing, enable a thorough exploration of the 'social' dimension of networks such as the complex myriad of meanings, feelings, attractions, and dependencies which underpin social relationships (Crossley 2010). In recent years there has been a so-called 'cultural turn' (Knox et al 2006) in network research. Citing the work of scholars such as Riles, Mische and White, Knox et al (2006) demonstrate the shift in how networks have been understood from pre-existing structural forms to the notion of social constructions brought into being through stories and images. 'The idea that networks are rooted in stories means that networks are cultural formations in themselves, and can be studied as such by looking at the kinds of narratives that actors use to describe' these ties (Edwards 2010: 23). In this paper, we consider the complex, interactional and discursive dimensions of social networks and how these are played out in the interview context.
2.5 Thus, as argued elsewhere, we cannot focus on network structure to the exclusion of network content (Ryan and Mulholland 2014a). Analysing the 'social' aspects of networks requires a consideration of the meanings attached to inter-personal relationships (Ryan 2011). In exploring the meanings that participants attach to social ties, it is useful not only to record how networks are spoken about in interviews but also represented through visual images. Visualisation tools enable researchers to collect additional, detailed data on what networks might look like (Freeman 2000). However, as we illustrate in later sections, this is not a neutral process and thus raises ethical considerations. There is growing literature dealing with ethical concerns particularly in qualitative research (e.g. Bulmer 1982; Guillemin & Gillam 2004; Homan 1991; Kimmel 1988; Orb, Eisenhauer, &Wynaden 2001; Robley 1995). Our article specifically reflects on ethical issues arising in the course of these network related interviews, which can be called 'ethics in practice' (Guillemin & Gillam 2004).
2.6 In the following section we discuss visualisation tools and consider how these impact on the pictorial representation of social relationships.
Network Visualisation
3.1 From its earliest inception, visualisation has been a key component of social network analysis, providing researchers with 'new insights about network structures' (Freeman 2000: 1). Cheong et al argue that these tools allow for deeper probing by presenting 'questioning cues to the interviewer that would not have been made available without visual assistance, and also acts as a reliability check with participants visually assessing their connections' (2013: 5). However, visualisation does not simply capture network size and structure, it serves as a tool for prompting memories and stories about particular relationships (Carrasco et al 2006). Researching migrant networks in Barcelona, McCarthy et al found:if the research topic is fundamentally interpersonal (such as influences on migration choices or political opinion) then the personal network visualisation provides a perspective on these topics that cannot be gained otherwise (2007: 159).
3.2 During the 1930s, Jacob Moreno, the 'father of network analysis' (Burt et al 2013), realised the value of drawing networks using a basic sociogram to illustrate patterns of social linkages in circular shapes (Huang et al. 2006). This design was further developed by Mary Northway's 'target' sociogram in the 1940s; adding concentric circles to illustrate degrees of closeness or distance within networks (Freeman 2000). These early pen and paper drawings mainly used qualitative data based on the ties between a group of individuals within a bounded research area, such as a school or neighbourhood. However, in recent decades, the use of computers has enabled more complex analysis using multidimensional scaling and algorithms to identify different patterns, such as node positions, within the networks of large populations across wide geographical areas (Freeman 2000).
3.3 Therefore, it may be tempting to suggest that traditional pencil drawings of individual target sociograms are obsolete. Nonetheless, one advantage of paper diagrams, in contrast to post-hoc software-based representations, is that they are completed by the participants during the interview; adding to the richness of the data collected (Hogan et al 2007). Paper diagrams may also be less threatening, more user-friendly (allowing for easy visualisation), and not vulnerable to technical failures (Cheong et al 2013). Reflecting its origins as a tool to be used with children, Northway's design has endured over time because it can be understood by a wide range of people (Samuelsson et al 1996). Carrasco et al suggest that the simplicity of the design make it ideal for collecting data 'in an intuitive and easy way' – especially in the case of older and 'less educated people' (p.9). However, as we discuss below, using this 'simple' tool when interviewing highly skilled, senior professionals, may have some unexpected consequences.
3.4 Within the literature there are many different examples of how sociograms can be adapted. Egocentric sociograms start with the individual as the key focal point and use a series of concentric circles indicating degrees of closeness to various 'alters' (Heath et al 2009). The number of alters may be left open so participants decide how many to add (Widmer 2006) or a specific number of alters may be requested (Cheong et al 2013). The number of concentric circles also varies, from as few as 3 (Cheong et al) or 4 (Carrasco in McCarthy et al) to as many as 6 (Samuelsson et al) or 7 (Hersberger). The number of sectors into which the circle is divided may also vary. Samuelsson et al used 5 sectors, while others have used 4 (Hersberger).
3.5 We used a design adapted from Hersberger (2003): a simple paper-based method in which participants write their contacts on a target diagram consisting of 7 concentric circles divided into 4 quadrants (friends, family, work, neighbours/hobbies/others). The layout and design are important as these may influence how the data are represented and interpreted (Huang et al 2006: 3). Sociograms work best when completed as part of an interactive dialogue between interviewer and research participant. Thus it is important to consider how 'the interviewer influences the way the map is drawn' (Samuelsson et al 1996: 343). This issue has been highlighted as needing further study (Samuelsson et al 1996).
3.6 We take up that issue, using illustrations from our interviews to reflect how this visualisation tool may have impacted on the interviews and the data collected. Drawing on the 'cultural turn' in SNA (Knox et al 2006; Edwards 2010), we are interested in how networks are constructed in the dynamic exchange between interviewer and interviewee. In other words, particular questions and prompts may impact on how specific relationships are signified. In addition, the sociogram itself may encourage interviewees to construct ties in a particular format. Hence, rather than simply a neutral tool for collecting data about a pre-existing network, we consider how the interview questions and visualisation tool may influence how social relationships come to be depicted as 'a network'. We begin by briefly summarising the research study.
The study
4.1 This short study grew out of our earlier research on highly skilled French migrants working in London's business and financial sector (ESRC-funded 2010-12). In the first wave of interviews participants discussed the process of networking both in terms of making business connections (Ryan and Mulholland 2014a) and through social activities, especially around family life (Ryan and Mulholland 2014b). In an attempt to collect richer data on particular themes, we decided to re-interview a sample of our original 37 participants (resulting in 14 new interviews), using network mapping. Specifically, we wanted to know more about: network content; intensity and frequency of relationships with various individuals; association between geographical and emotional distance; overlap or separation of social ties in different arenas of their lives; specific resources (practical, informational, social) derived from particular ties in particular locations.4.2 Of the 14 interviews, four were undertaken by two interviewers (one by L and J, two by L and A, and one by J and A), and 10 by a single interviewer. Interviews lasted approximately one hour, of which between half and one third of the time was spent completing the sociogram. Although the participants knew we were interested in networking, a significant aspect of the original interviews, when arranging the second interview we did not mention the introduction of the visualisation tool. We wanted their responses to be spontaneous rather than rehearsed. In addition, we were curious to see how they would react to being asked to visually depict their social ties.
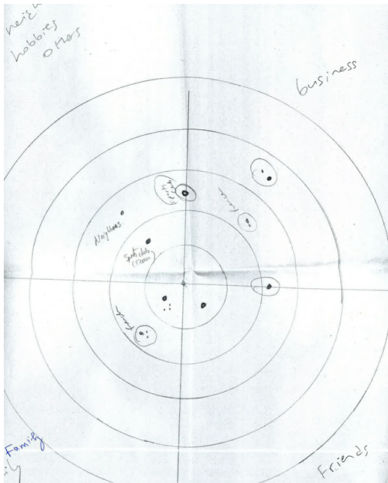
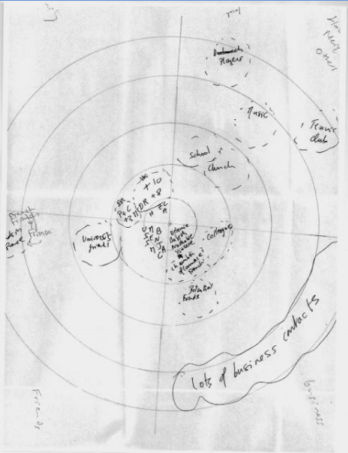
4.3 During the interview we gave the participants detailed instructions on how to complete the sociogram. They were asked to indicate people who were important to them within each quadrant (family, friends, business and hobbies/neighbourhood), and where these overlapped, to place people on the borders between the quadrants. We explained that the concentric circles represented degrees of closeness, with the closest or most important people nearer the centre and the less important/less close in outer circles. We asked for initials of alters, though most people mentioned full names (see Figures 1 and 2).
4.4 In this paper we adopt a reflexive approach to consider how the sociogram worked in the context of qualitative interviews. Reflexivity helps to reveal the complexities of the research relationship; requiring honesty and openness about how, where and by whom data were collected and locates the researcher as a participant in the dynamic interaction of the research encounter (Ryan and Golden 2006). When interviewing participants who occupy positions of privilege or seniority, the usual research 'power relationship' may be reversed (Mikecz 2012). Researchers may find that they have to carefully negotiate the 'status imbalance' between themselves and the interviewees by, for example, establishing our knowledge and expertise (Mikecz 2012). Using a reflexive approach we consider how using the sociogram may have further complicated this 'status imbalance'.
'Blue Peter' or 'really complicated'?
5.1 Even for highly skilled migrants armed with significant social and cultural capital, the sociograms proved challenging. Our first interviewee was Adèle[1], a banker in her early 40s. As this was our first time using the sociogram both L and J took part in the interview. The interview started well; she seemed enthusiastic to meet us again and to elaborate on some themes from the earlier study. After 10 minutes we introduced the sociogram. 'J', almost apologetically, described it as a bit 'Blue Peter'[2], although he realised later that this expression might not mean much for Adèle who grew up in France. Both J and L were keen to emphasise that, despite its simple appearance, this was a well-established tool in network research: 'we didn't make it ourselves, this is a well-known sort of tool' (L). Adèle began to complete the diagram without any apparent difficulty; starting with close family members and then moving on to her friends. But after a few minutes she realised that she had too many contacts, particularly in the business quadrant, to write down all their names, or even initials: 'you have got a network of people that you work with and. . . they are not that important, but you just have them in the back of your mind, there's tons'. Faced with this challenge, she decided to simply put a cluster of 'xxxx' to represent business associates in the outer circle. The use of clusters to represent groups of unnamed people is common in network mapping and although quick, it provides less detail than depicting ties individually (Huang et al 2006). In Adèle's case we noted a pattern, repeated by other participants, of naming contacts in the inner circles while putting anonymous clusters of contacts in outer circles, often defined by a particular firm, hobby or geographical location. This is apparent in the sociogram from Irène.5.2 Most participants had numerous contacts, which could be challenging to visualise. The size of Irène's extended family made any attempt at visually representing them within the physical and temporal constraints of the sociogram almost impossible (see Figure 2): 'And then, hold on, how many, four brothers, then eight plus eight, then children, phew, twenty, let's not put them… there is lots of family. . . ' Her reaction is quite similar to Adèle's. Completing the sociogram proved to be a more challenging process than anticipated. For example, after working on, and talking through, the diagram for about 20 minutes Adèle concluded: it was 'really complicated' and 'quite difficult'.
5.3 When visualising networks it is important to balance the risk of 'burden' for both interviewers and respondents against the need to collect detailed data (Merluzzi and Burt 2013). In a context of almost limitless contacts but finite opportunity for inclusion, sociograms impose a judgement on participants in terms of which members of their social networks to include. Though we could have imposed limits on network size, and its representation across the tool's quadrants, in the interests of ease and speed, this would have jeopardized the richness of the data (Huang et al 2006). Instead we followed what Heath et al (2009) term 'a realist strategy', whereby participants impose their own boundaries. In line with Widmer's (2006) decision to allow participants to define and report as many ties as they wished, we felt that granting participants the capacity to do this was key to a participant-centred qualitative approach.
5.4 Although we became more confident about introducing the tool, as the interviews progressed, it was apparent that many participants found the process demanding and challenging. Reactions can be divided, loosely, into those, like Adèle, who understood the concept, and appeared to enjoy visualising their networks but found the process long and arduous, to those who could not understand the point of mapping and were quite unsure how to use the tool. Despite our detailed explanations of what to do with the tool, several participants had difficulty grasping its basic principles: 'I'm not sure I got it' (Gilles). Another requested further instruction: 'so actually what do you want me to do with this?' (Signolene). A few people were so unconvinced about the usefulness of the tool, and so uneasy about completing it, that we feared rapport would be broken, jeopardising the interview. In such cases, we tended to curtail our demands for the details required on the sociogram, working hard to reassure and guide participants.
5.5 This tool, developed for use with children, has been successfully used with a range of diverse groups (Barnes-Mauthe et al 2013). Other researchers who used network visualisation tools with migrants found: 'Most respondents were excited about the opportunity to describe the visualisation and talk about their network' (McCarthy et al 2007: 151). We wondered why our highly educated, highly skilled professional participants found it so challenging. Because we had interviewed them on a previous occasion we knew they had been happy to talk at length about networking (Ryan and Mulholland 2014), suggesting that it was the tool specifically that caused confusion. It may be that the sociogram tool required the participants to engage in a process that was overly intuitive, or emotive, for those whose occupational and educational experiences have prepared them for quantifiable and precise expressions of numerical data. This point was illustrated by Irène when she half-jokingly remarked: 'Look at my Christmas card list, this is what I should give you'. This is a very illuminating statement and offers a different construction of her network – as a list. Perhaps this statement suggests she is more comfortable with a linear notion of her social contacts. This observation indicates that the concentric circles format not only appeared unfamiliar but also challenging as a mechanism to visualise family and friends. Of course, a list of contacts would not give us any sense of the degrees of closeness and intensity of relationships within different sectors of her life. By using the sociogram we were asking Irène to imagine and represent her network in a way she had never previously done (See Figure 2).
5.6 Exploring these questions requires a consideration of the strengths and possible limitations of this tool and how it may be adapted for use with different groups of people. Using a reflexive approach requires an examination of the interplay between our own individual attitudes to the tool and participants' reactions. In the first few interviews, L+J were wary about how participants would react to requests to draw their networks. 'L', who has long been interested in social networks, had advocated introducing the tool, and was enthusiastic about its use. 'J' was concerned that the tool was a departure from our usual approach to interviewing and may come as a surprise to the participants. 'J' was also slightly sceptical about the tool's capacity to generate 'valid' data, given the potentially indeterminate and inconsistent meaning of 'closeness' across the four domains comprising the sociogram, and across the participant cohort. He was concerned that participants may challenge the tool on these grounds, and that the research team's rationalisation of the sociograms may fail to offer the reassurance required. Certainly, we were both aware that our pen and paper mapping tool may appear basic, even childish – 'Blue Peter-ish'. This concern points to the 'intellectualism' normally associated with academic research, and the importance of apparent sophistication for the legitimation of the research process, especially when interviewing professionals and those in positions of seniority (Mikecz 2012). 'A', who was new to the research team, and had not been involved in the earlier round of interviews, had fewer pre-conceived ideas about the participants, and fewer concerns about using the sociogram. Nevertheless, our awareness of sociograms as a widely used tool in network research may still have led us to under-estimate the methodological challenges associated with their use. In the next sections we explore more of these challenges.
The Meaning of Ties
6.1 Using a visualisation tool raises questions about 'the processes by which participants make decisions about the representation of their networks' (Heath at al 2009: 645). Including a sociogram in the interview process enabled us to observe how participants talked about the meaning of particular ties. It was apparent that relationships between different alters were being compared for their relative closeness - some people were regarded as 'extremely close' others as simply 'close'. It is also apparent that participants move alters around in relation to others, hence the importance of using a pencil – so they may 'promote or demote' one contact in relation to another (Hogan et al 2007: 129). This deliberation was probably made more complicated because we had decided to use a 7 concentric circle model. On reflection, we probably gave them too many choices about where to locate alters. Looking at the completed sociograms, see Colyn's for example, most participants had not used all 7 circles.6.2 We found that the material act of visual representation confronted our participants with fundamental questions about the nature of their relationships with significant alters in a manner not experienced through the medium of talking alone. Simone tried to differentiate categories of friendship:
So in terms of friendship… I have my acquaintances, they are people that it's nice to meet every now and then. Or with the MBA, we celebrated 10 years of graduation last year, we got all together…It was really nice, and I consider them as my friends, although we don't really have so much track of what's going on. Maybe I would put acquaintances here.
6.3 Positioning friends, family and acquaintenances in such a visual and material manner may imply a ranking or ordering of the importance of relationships. Some participants resisted this way of representing their social connections.This is particularly well illustrated by Gilles:
You know I'm not sure I am very comfortable with this...Have you read Milan Kundera? … he said this very interesting thing in one of his books that you cannot say that you love someone more than someone else… And I don't think I want to put like a note, a grade that is what I'm doing here on people.
6.4 Participant deliberations about the nature of their relationships, and the positions allocated to particular alters within the sociograms, were often transparent, as they tended to talk through their ties, sharing anecdotes about particular relatives or friends. As Crossley (2010) notes, qualitative interviews frequently uncover the 'story' of a network of relationships.
6.5 By contrast, a few people did precisely the opposite, filling in the diagram silently. This proved problematic as we needed them to describe the ties and explain the relationships behind the initials on the sociogram. For example, Signolène seemed to grasp the concept of the tool very quickly and got to work on it silently. 'J' had to ask her to explain and talk through the various connections so that we could get a sense of the nature of the relationships.
6.6 In telling stories of their network, some participants were shifting from an ego-centric to a household-centric perspective. Samson for example talked about how his wife had accessed new networks in their local neighbourhood through the children's school and sports club. In this way, contacts are included in the sociogram although they are clearly connected more to the spouse than the participant.
6.7 The material act of visualising social relationships on paper may enhance participants' sense of ethical responsibility to their friends and relatives in a way that previous interviews based on 'pure talk' did not. Some expressed disconcertion about the discrepancy between the position they assigned to someone on the sociogram, and the placing that person might expect to receive. For example, Irène wondered in which circle to place her 'in-laws' and after some deliberation declared: 'Pfff, I'll put them, let's be diplomatic…' She was keen to place them somewhere that felt comfortable without appearing to diminish the importance of their relationship. Similarly, Céline appeared to be concerned that her friends and relatives may be offended by where they were placed on her sociogram. In such situations, we felt a need to reassure participants and allay their concerns, as in the case of L to Céline: 'It's completely confidential, they will never know where you put them'.
Remembering and forgetting
7.1 Asking people to visualise their social connections in a 20 or 30 minute session is a demanding mental exercise and relies a good deal on memory. Participant recall and forgetfulness 'plague network data' (Merluzzi and Burt 2013). Nonetheless, the tool also acted as a trigger for memories of contacts and friends. L observed that leaving the map on the table throughout the interview served as a reminder and it was not uncommon for participants to remember and add people towards the end of the interview, after the discussion had moved on to other topics. Chantal: 'oh, I've forgotten another group of friends' and similarly, Céline added: 'oh, I forgot one here'.7.2 Participant concern about offending people, or embarrassment about forgetting someone, has been noted elsewhere in the literature: 'Respondents appear to be emotionally invested' in including all the important people in their lives and when they forget someone 'they often are embarrassed and apologetic' (Hogan et al 2007: 125). In addition, we suggest that such 'forgetfulness' also carries a sense of ethical jeopardy for the participants. To forget someone may be experienced as an act of devaluing the tie with the significant other.
7.3 While some contacts may have been 'forgotten', we are aware that participants may have made some silent decisions not only about where to place people, but also who to omit. As Heath et al note, there may be all sorts of 'gaps and silences' in the network which 'may or may not be significant, but which we suspect probably are' (2009: 649). The visualisation exercise tends to be shaped by context – i.e. the time period in which it is being completed. People may be more likely to focus on their current relationships even though past contacts may have been extremely influential in their lives. A clear example of this was Christophe who, during the earlier part of the interview, described in detail how a business contact had facilitated his move between companies, enabling significant career escalation. Interestingly, Christophe failed to mention this person a little later when completing the sociogram. Observing this omission, J asked:
J: clearly you have a large business network here, are there people who are of particular importance to you in the world of work? … You mentioned in fact that there was somebody who brought you to [name of bank]…Christophe did not elaborate further but it is apparent that the connection to this once influential work-based tie was now broken. This person is no longer 'of particular importance' and not included in the sociogram.
Christophe: His life changed a little bit, I think.
J: Okay.
Christophe: Not any more, I would say today, not really.
7.4 Based on our experience, we suggest that combining the visualisation exercise with qualitative interviews may make these inconsistencies easier to see and discuss. Other studies also found that memory errors are not random but strongly associated with infrequent and fleeting contacts (Hogan et al 2007: 120). Some participants audibly worked through the relationship between frequency and intensity.
Gilles: No, no, it's completely related to emotion. And then it's completely correlated, I mean the people that I am very much attached to from an emotional point of view, I tend to see them more frequently.
J: It is not always the case? It can be…
Gilles: Yeah, I agree, especially my brothers, one lives in Berlin and the other one lives in the south of France, I don't see them very often, but the link with my brothers is very strong.
7.5 Simone neatly captured the complexity of frequency and intensity when she spoke about her two closest friends who lived in South America where Simone had also lived in the past; 'so I have these two best friends, the Argentinian ones, very close to my heart.' The sense of having people 'in my heart' even though they are far away relates to the mobility of these migrants who had lived in several places across different countries (not just France and Britain). The concentric circles were intended to represent emotional distance from the ego but clearly the association between that and geographical distance was complex and raises the related question of dynamism over time.
Depicting Dynamism
8.1 Most participants struggled to depict dynamism on the visual tool. Social relationships inevitably alter over time, with changing geographical space, work environment, emotional distance and sometimes gender specific factors. Most participants had travelled extensively during their careers, collecting a range of ties which ebbed and flowed over time. Depicting this dynamism on a static visual diagram was challenging (Heath et al 2009).8.2 The effect of spatial change was particularly apparent in the case of Colyn, who had recently relocated to London after several years in the Far East. When completing the diagram, L. continually asked whether the friends or business colleagues he named were located in London, Paris or Hong Kong. His sparse London-based ties, see Figure 1, were a reflection of his recent arrival rather than his approach to networking.
8.3 The dynamism of ties was usually a topic of conversation as participants struggled to depict that process visually. We suggest that conversations around the sociogram are an essential part of the data as the network is represented through the interactive process of talking and visualising. The interviewees' explanation of the visual images was often extremely insightful. This point is illustrated by Elisabeth who also highlighted a gender specific dynamism; changing career after having children with the effect of losing contact with many former business contacts. Looking at her completed sociogram she stated:
I have just realised … It's telling me quite a lot about me, it's quite scary. It shows that my commitment to the job is actually much more distant, than my family or my friends, or even my hobby (Elisabeth).
8.4 Elisabeth expressed concern about how skewed her network appeared. As on other occasions, we found ourselves wanting to offer reassurance to the participants:
L. This is probably the most full network map that I've seen.
Elisabeth: Really?
L: Yes, you have got so many friends, so many neighbours, hobbies, it's very busy.
Elisabeth: Really? Oh, good, that makes me feel a little bit better.
8.5 It is inevitable that emotional closeness to acquaintances or even family members change over time in line with changes in the participants' circumstances. Crow challenges the notion that a network can ever be perceived as a static entity: 'social networks are configurations of people rather than collectivities with definite boundaries' (in Heath et al 2009: 657). As Simone remarked: 'some [friends] become closer at some points and maybe others go away'.
Making up the Network
9.1 We found sociograms to be a powerful tool for illuminating the makeup of networks. As McCarthy et al (2007) note, visualisation acts as 'a cue' to explore network composition 'especially in relation to ethnic identity, the personal network visualisations show how some respondents compartmentalise alters of different ethnicities' (p.159). However, it was not uncommon for participants to find a mismatch between the network as materialised in the sociogram, and their own mental image of their social connections. Thus, it is apparent that sociograms do not merely collect data but also shape how data are depicted. For example, although our participants were in the habit of describing their networks as 'cosmopolitan', the sociograms often betrayed high levels of co-national sociality. This is clearly illustrated in the following exchange:J: Would you say that quite a lot of people have that relationship. . . to the cosmopolitanism of London. . .
Adele: Definitely, it's got to be that, because. . . Now that you say these, there are lots of stuff that I love about different cultures, but do I know people? I might know people of different nationalities and yes. But do I interact with those people? Not really.
9.2 Although this statement may not seem particularly powerful, in the context of the interview it created a moment of tension. Both interviewers were uncomfortable; feeling we had embarrassed this helpful and enthusiastic participant. We had asked her to visualise her network, in the process she named people, usually indicating their nationalities. Most were British or other European. We then appeared to challenge her claims to enjoy the diversity and cosmopolitanism of London by pointing out that the composition of her networks did not reflect the wider ethnic diversity of the city. L later inadvertently re-created almost exactly the same situation when interviewing Colette. These experiences indicate the potential of visualisation to introduce tensions within the context of qualitative interviewing, and alert the team to the need for an ethical awareness of the tool's potential to create participant discomfort.
9.3 Completing a sociogram in an interview context has 'an emotional impact' (Carrasco et al 2006: 13). Other researchers note that participants routinely comment on how 'interesting their personal networks look' (Hogan et al 2007: 137). However, we suggest that the visualised networks may come as a surprise to participants, depicting their social connections in a new way, revealing things they have not expected, making them feel exposed.
9.4 The need for reassurance in the act of filling out the sociograms was a common theme running through many interviews. Several participants appeared quite self-conscious about how their networks looked on paper. This was very interesting to us because when we interviewed them previously, without a visual tool, they came across as successful, confident networkers (Ryan and Mulholland 2014a). When presented with the blank sociogram, Chantal immediately expressed concern: 'you are going to put me down as a-social'. Although we value the rich insights into network construction afforded by the sociograms, we also felt responsible for causing any sense of unease among the participants. Re-reading the transcripts we were forcibly struck by how often we had offered reassurance and affirmation to the participants. Clearly there are ethical issues to be considered in using visualisation tools. It is apparent that the material act of visually depicting social relationships, and ranking ties in degrees of closeness, makes some participants feel uncomfortable and exposed in ways that did not occur when we previously interviewed them without this tool. In the concluding section we consider the overall gains and challenges associated with using the visualisation tool in qualitative research.
Discussion
10.1 Based on our experience, combining network visualisation with in-depth interviewing facilitated insights into patterns of network composition which had remained somewhat obscure during our first round of data collection. For example, we could 'see' degrees of closeness and unpick the complexity of geographical and emotional closeness through the concentric circles. Using the different quadrants enabled a clearer understanding of how participants built and maintained relationships with different people and the extent of overlap or separation between these arenas. We could ask the 'right' questions, as the tool acted as a gentle trigger for participants to talk, and certain topics emerged which might not have otherwise surfaced, hence greatly contributing to the collection of rich data. As Shortt notes:Using visual methods places our engagement with the social world in a context that looks beyond what the visual illustrates and encourages us to construct knowledge from embodied, material and sensual aspects of everyday life (2012: para 3.2)
10.2 Undertaking this visualisation during the interview, rather than post-hoc in a computer laboratory (see Hogan et al 2007) meant that we could hear participants talk through where to place people and how they compared the relative importance/ closeness of different people in their circles. Through involving the participants in the active and material process of 'storying' and visualising networks we collected rich data on how they reacted to constructing and seeing their networks – giving a deeper insight into people who had initially appeared as confident networkers. Thus, following Crossley's observation, cited earlier, we argue that these data collection tools allow a thorough exploration of the 'social' dimension of networks.
10.3 Our research is clearly an example of 'interviewing up' (Puwar 1997) resulting in a perceived 'status imbalance' (Mikecz 2012) between these highly paid, senior professionals and us. However, when faced with the visualisation tool, they were clearly struck by its unconventional nature, and the 'status imbalance' was somewhat disturbed, particularly where the method challenged the participant's sense of competence. This has clear ethical implications and researchers must be aware of how best to manage the disempowering potential of sociograms where participants feel their competencies tested.
10.4 All three of us were sensitive to how the sociogram impacted on interview dynamics. There was a sense in which the act of visualisation associated with completing the sociogram enhanced participants' ownership of, and indeed accountability for, the data. Completing a sociogram in an interview context enables participants to 'see their network' and they may feel a sense of 'empowerment' as they have created this on paper (Carrasco et al 2006: 13). However, as we note above, the process of producing a sociogram, and the responsibilities it places on participants, may produce feelings of awkwardness. It may raise uncomfortable feelings about the nature of particular relationships. Such ethical considerations, associated with the use of visualisation tools in interview contexts, should be considered carefully by the research team at the outset. It is important to balance the need for interesting and insightful data, with the imperative to minimise any embarrassment or discomfort to the participants. Through our reflexivity we have been struck by the ways we interjected to reassure the interviewees and assuage any discomfort which the sociograms may provoke.
10.5 The challenges associated with employing visualisation techniques are not limited to those faced by participants; the team entered into this phase of the research process with a range of both acknowledged and unacknowledged orientations that framed how we presented and used the sociograms. On reflection, it is clear that we tended to adopt an almost apologetic tone on introducing the sociograms, as if to excuse the nature and implications of this tool. Anticipating participant scepticism, we inadvertently sought to authorise the tool through reference to its broader currency. This sense of needing to 'sell' sociograms is also evidenced in our repeated encouragements and reassurances to the participants in a way we had not done during interviews in our original study. Perhaps a less apologetic tone would have inspired their confidence from the outset, dispelling any doubts or sense of unease. Within the wider literature, the 'low tech' nature of this tool is often regarded as a strength (Hogan et al 2007: 137). We have since come across a new way of drawing the sociogram in the interview context using a software package (Tubaro et al 2013) which may have made precisely the same tool appear more 'sophisticated'. Thus, although the pen and paper sociogram has many advantages, its basic appearance may reduce its legitimacy in the eyes of some participants, such as professionals used to working with advanced technology
10.6 The target sociogram was designed for use with bounded groups, with smaller networks, but our participants had very large, geographically dispersed and expansive social connections which were more challenging and time consuming to visualise. Of course, it is impossible to depict the entirety of one's social ties. Nonetheless, in future work we would probably put some limits on the numbers of alters required. Although we may have lost some richness of data, the overall process would have been less time consuming and taxing for participants.
10.7 The dynamism of relationships was also a challenge. Social ties are inherently dynamic and cannot be captured as a static image. Thus, networks are moving, living, amorphous creations. It is not our intention to attempt to 'pin down' a network on a sociogram. Despite this limitation, we suggest that the combination of interview narratives and visual image enabled dynamism through the stories that participants told around their networks.
10.8 Although we used the same basic design in each interview, the participants completed them in varied ways (see the very different sociograms of Colyn and Irène). Therefore, we intend to analyse each sociogram separately as a visualisation of each migrant's individual network story. This could be seen as a limitation of our research design or simply one indication of how sociograms can be incorporated into qualitative studies.
Conclusion
11.1 This paper adopted a reflexive approach to consider the opportunities and challenges when using a visualisation tool in qualitative research on social networks. Having previously interviewed participants without the tool, we are well placed to consider not only how the introduction of this device impacted on interview dynamics but also generated new data not previously accessed through talking alone.11.2 Based on this experience, we contend that a visualisation tool is not simply a neutral device for 'capturing' network data. Instead, we argue that tools like the sociogram shape social relationships into a particular format. Its layout and design do not merely illustrate the network but influence how it is visualised by participants. The sociogram thus becomes an integral element of the network narrative. The network is constructed through the exchange between interviewer and interviewee; the questions asked, stories and images shared, as well as omissions that are not shared. Embedded within in-depth interviews, the process of drawing and talking about ties forms an interactive and creative dialogue, with each part shaping how social relationships were remembered, represented and rationalised. Hence, we suggest that researchers using tools in this way need to critically reflect upon how such visualisation techniques shape the ways in which data are constructed and shared.
Sociograms
|
| Figure 1. Colyn |
|
| Figure 2. Irène |
Acknowledgements
Our study on highly skilled migrants - French Capital by Mulholland and Ryan - was funded by the Economic and Social Research Council (RES-000-22-4240). We would like to thank all our participants who gave so generously of their time. In addition, we would like to express our gratitude to Elisavet Tapini who provided some initial support with the sociograms.
Notes
1The names of all participants have been changed to protect anonymity.2This is a reference to the popular, long running, BBC children's programme which often features home-made arts and designs and so has become a by-word for childish crafts.
References
BARNES-MAUTHE, M, Arita, S., Allen, S., Gray, S. & Leung, P. S. (2013) The influence of ethnic diversity of social network structure. Ecology and Society, 18(1): p.23. [doi://dx.doi.org/10.5751/ES-05295-180123]BULMER, M. (Ed.). (1982)Social research ethics. London: Macmillan.
BURT, R., Kilduff, M & Tasselli, S. (2013) Social Network Analysis: foundations and frontiers on advantage. Annual Review of Psychology, 64: p.527-547. [doi://dx.doi.org/10.1146/annurev-psych-113011-143828]
CARRASCO, J.A, Hogan, B., Wellman, B. & Miller, E. J. (2006) Collecting social network data to study social activity-travel behaviour. Paper presented to the Transportation Research Board, January, 2006.
CHEONG, L., Armour, C. & Bosnic-Anticevich, S. (2013) Primary health care teams and the patient perspective: a social network analysis. Research in social and administrative pharmacy, early view <http://www.sciencedirect.com/science/article/pii/S1551741113000028>.
CROSSLEY, N. (2010) The social world of the network. Sociologica 1. DOI: 10.2383/32049.
EDWARDS, G (2010)Mixed Methods Approaches to Social Network Analysis, National Centre for Research Methods, working paper 015.
FREEMAN, L.C. (2000) Visualising Social Networks. Journal of Social Structure, 1 (1). <http://www.cmu.edu/joss/content/articles/volume1/Freeman.html>.
GUILLEMIN, M. & GILLAM, L. (2004) Ethics, reflexivity, and "ethically important moments" in research. Qualitative inquiry, 10 (2), p.261-280. [doi://dx.doi.org/10.1177/1077800403262360]
HEATH, S., Fuller, A. & Johnston, B. (2009) Chasing Shadows: defining network boundaries in qualitative social network analysis. Qualitative Research 9(5): p.645-661. [doi://dx.doi.org/10.1177/1468794109343631]
HERSBERGER, J. (2003) A qualitative approach to examining information transfer via social networks among homeless populations. The New Review of Information Behaviour Research, 4: p.95-108. [doi://dx.doi.org/10.1080/14716310310001631462]
HOGAN, B, Carrasco, J. A. & Wellman, B. (2007) Visualising personal networks: working with participant-aided sociograms. Field Methods 19(2): p.116-144. [doi://dx.doi.org/10.1177/1525822X06298589]
HOMAN, R. (1991)The ethics of social research. London: Longman.
HUANG, W., Hong, S. H. & Eades, P. (2006) Effects of sociogram drawing conventions and edge crossings in social network visualisation. Journal of Graph Algorithms and Applications, 1(1): p.1-42.
IBARRA, H. & Deshpande, P. (2004) Networks and Identities: reciprocal influences on career processes and outcomes. Working paper, INSEAD
KIMMEL, A. (1988) Ethics and values in applied social research. Newbury Park, CA: Sage.
KNOX, H., Savage, M. & Harvey, P. (2006) Social networks and the study of relations: networks as method, metaphor and form. Economy and Society, 35(1): p.113-140. [doi://dx.doi.org/10.1080/03085140500465899]
MARMOT, M. G., Allen, J., Goldblatt, P., Boyce, T., McNeish, D., Grady, M., & Geddes, I. (2010). Fair society, healthy lives: Strategic review of health inequalities in England post-2010.
MCCARTHY, C., Molina, J. L., Aguilar, C. & Rota, L. (2007) A comparison of social network mapping and personal network visualisation. Field Methods, 19(2): p.145-162. [doi://dx.doi.org/10.1177/1525822X06298592]
MERLUZZI, J. & Burt, R. (2013) How many names are enough? Identifying network effects with the least set of listed contacts. Social Networks, 35(3): p.331-337. [doi://dx.doi.org/10.1016/j.socnet.2013.03.004]
MIKECZ, R (2012) 'Interviewing elites: addressing methodological issues' Qualitative Inquiry, 18(6): p.482-493. [doi://dx.doi.org/10.1177/1077800412442818]
ORB, A., Eisenhauer, L., &Wynaden, D. (2001) Ethics in qualitative research.Journal of Nursing Scholarship, 33(1), p.93-96. [doi://dx.doi.org/10.1111/j.1547-5069.2001.00093.x]
MULHOLLAND, J. and Ryan L. (2011) French Capital: A Study of French Highly Skilled Migrants in London's Financial and Business Sectors. Research Report. Available at: http://www.frenchlondon.co.uk
MULHOLLAND, J. and Ryan, L. (2014) 'Londres Acceuil': Mediations of Identity and Place amongst the French Highly Skilled in London, In Meier, L. (Ed) Migration of Professionals and the City - Local lives and social identities of skilled migrants. Routledge, London.
PUWAR, N (1997) 'Reflections on interviewing women MPs' Sociological Research online, 2(1), <http://www.socresonline.org.uk/2/1/puwar.html>. [doi://dx.doi.org/10.5153/sro.19]
ROBLEY, L. R. (1995) The ethics of qualitative nursing research. Journal of Professional Nursing, 11 (1), p.45-48. [doi://dx.doi.org/10.1016/S8755-7223(95)80072-7]
RYAN, L. and J. Mulholland (2014a) 'French Connections: The networking strategies of French highly skilled migrants in London' Global Networks, 14 (2): p.148-166 DOI: 10.1111/glob.12038 [doi://dx.doi.org/10.1111/glob.12038]
RYAN, L. and J. Mulholland (2014b) 'Wives Are the Route to Social Life': An Analysis of Family Life and Networking amongst Highly Skilled Migrants in London' Sociology doi:10.1177/0038038512475109 [doi://dx.doi.org/10.1177/0038038512475109]
RYAN, L. (2011) 'Migrants' social networks and weak ties: accessing resources and constructing relationships post-migration' Sociological Review 59 (4): p.707-724 DOI: 10.1111/j.1467-954X.2011.02030.x [doi://dx.doi.org/10.1111/j.1467-954X.2011.02030.x]
RYAN, L. and Anne Golden (2006) 'Tick the Box Please': A reflexive approach to doing quantitative social research' Sociology, 40 (6): p.1191-1200. [doi://dx.doi.org/10.1177/0038038506072287]
SAMUELSSON, M., Thernlund, G. & Ringstrom, J. (1996) Using the five field map to describe the social network of children: a methodological study. International Journal of Behavioural Development, 19(2): p. 327-345.
SHORTT, H. (2012) Identity scapes of a hair salon: work identities and the value of visual methods. Sociological Research Online, 17(2): <http://www.socresonline.org.uk/17/2/22.html>. [doi://dx.doi.org/10.5153/sro.2690]
TUBARO, P, A. Casilli and L. Mounier (2013) 'Eliciting personal network data in web surveys through participant generated sociograms' Field Methods, early view, <http://fmx.sageput.com/>.
WIDMER, E. (2006) Who are my family? Bridging and binding social capital family configurations. Journal of Social and Personal relationships, 23(6): p.979-998. [doi://dx.doi.org/10.1177/0265407506070482]
WELLER, S., Edwards, R. &Stephenson, R. (2011) Researching Children's Lateral Relationships over Time: Methodological & Ethical Lessons from a Qualitative Longitudinal Study, Families & Social Capital Research Group Working Paper No. 30, London South Bank University.