Coming of (Old) Age in the Digital Age: ICT Usage and Non-Usage Among Older Adults
by Barbara Barbosa Neves, Fausto Amaro and Jaime R. S. Fonseca
Technical University of Lisbon
Sociological Research Online, 18 (2) 6
<http://www.socresonline.org.uk/18/2/6.html>
10.5153/sro.2998
Received: 13 Jul 2012 Accepted: 14 Mar 2013 Published: 31 May 2013
Abstract
Most developed countries are in the midst of two significant societal trends: the first is an aging population; the second is the uptake of Information and Communication Technologies (ICT) by large segments of society. But research shows a strong association between age and the so-called digital divide: older adults are less likely to use ICT when compared to other age groups. If we consider the social affordances of the Internet and the online migration of several public and private services, the lack of access or of digital literacy might be increasing age-related inequality. Consequently, we studied adoption, usage, and non-usage of ICT (mobile phones, computers, and the Internet) by Portuguese older adults. For that, we surveyed a random stratified sample of 500 individuals over 64 years of age living in Lisbon. Of this sample, 77% owned a mobile phone, 13% used computers, and 10% used the Internet. The main reasons for non-usage were functional and attitudinal, rather than physical or associated with age. But usage of mobile phones and computers was predicted by age and education, whereas the usage of the Internet was only predicted by education. We followed up the survey with 10 qualitative interviews, using a mixed methods strategy. The qualitative data showed a general positive perception of ICT as well as the importance of family and intergenerational relationships for technology adoption and use.
Keywords: Older Adults, ICT, mobile phones, computers, Internet, technology adoption, Lisbon, Portugal
Introduction
1.1 Older adults (those over 64 years of age) are the fastest growing demographic group in developed countries, and an increasing trend in developing countries (Shrestha 2000). In contrast, the uptake of Information and Communication Technologies (ICT) by older adults lags behind resulting in an age-based digital divide (Czaja & Lee 2007). For example, in 2011, in the 27 countries of the European Union, 20% of individuals between 64 and 74 years of age used the Internet frequently (i.e. every day or almost every day), when compared to 81% of individuals between 16 and 24 years of age and 63% of individuals between 25 and 54 years of age (Eurostat 2012). Moreover, 65% of older adults in the European Union never used the Internet (Eurostat 2012).1.2 However, many socio-economic benefits can come from greater access to ICT: the communication and information provided by the Internet can help to reduce social isolation among older adults (Swindell 2000; Lansdale 2002; Rice & Katz 2003; Xie 2008), whereas services such as search, online banking, and shopping can improve the daily life of older adults by fostering an active aging (Rice & Katz 2003; McMellon & Schiffman 2002; Torp et al. 2008). Although we are not claiming that ICT bring only positive outcomes to older adults, since it might also have downsides (Richardson et al. 2005), research evinces that the Internet has predominantly positive effects on sociability, social capital, and well-being (Katz & Rice 2002; Kouvo & Räsänen 2005; Boase et al. 2006; Robinson & Martin 2010; Neves 2013). In addition, if we consider that: first, older adults are already susceptible to socioeconomic inequalities (Hudson 2005), and second, that governments are migrating some public-sector services to online-only[1], not having access to or lacking the digital literacy to use electronic services may contribute to more age-related inequality.
1.3 Considering these opportunities and constraints as well as the intersection of two societal trends an aging population and the slow uptake of ICT by that aging population we studied usage and non-usage of mobile phones, computers, and the Internet among older adults in Portugal. Even though the literature shows that age is the main predictor of ICT usage by older adults (Norris 2001; Rice & Katz 2003; Czaja & Lee 2007; Morris et al. 2007), we investigated what other factors might play a role in ICT usage and non-usage. In particular, we explored factors that differentiated non-users from users.
1.4 We believe our research sheds recent light on why and how older adults adopt and use ICT and why they do not, which in turn may lead to better strategies for digital inclusion and to the creation of services that can cater to the needs of an aging population.
Older adults & ICT
Factors for ICT usage and non-usage
2.1 The use of ICT by older adults increased in the last decade, but computer and Internet usage are still negatively correlated with age (Czaja & Lee 2007; Morris et al. 2007; Neves & Amaro 2012). This also means that ICT usage differs within the cohort of older adults: a 65-year-old is more likely to use ICT than an 80-year-old, i.e. an 'oldest old' (Eastman & Iyer 2005; Czaja & Lee 2007).2.2 Mobile phone usage, however, does not seem to be influenced to the same extent by age; rather it is associated with characteristics of work (full-time, part-time), income, education, and marital status (Rice & Katz 2003). When compared to mobile phone users, mobile phone non-users were more likely to work part-time, to have a lower income, to have less education, to be single or not have offspring (Rice & Katz 2003).
2.3 Besides these socio-demographic indicators, scholarship reports a set of factors that explain usage and non-usage of ICT by older adults. Simultaneously, recent research shows that older adults are not technophobic, are willing to use ICT, and often do so with proficiency (Czaja & Lee 2007; Malta 2008; Mitzner et al. 2010). So, given their willingness, why are the majority of older adults not using ICT?
2.4 We organized the reported reasons for non-usage into three groups of factors:
- Attitudinal: they are willing to try but are not particularly interested; or they do not feel very self-confident using ICT; or they do not fully grasp the benefits of the technology.
- Functional: they lack a home computer with Internet access and/or lack the necessary skills (digital literacy).
- Physical: they are physically or mentally limited, which means that using a computer is not practical or not even worth considering. These limitations are normally associated with age.
2.5 In terms of attitudinal reasons, computer anxiety (Marquié et al. 2002; Czaja et al. 2006; Czaja & Lee 2007) and interest in ICT (Millward 2003; Carpenter & Buday 2007; Morris et al. 2007) are closely related to ICT use. On the one hand, the low confidence of older adults' ability to master ICT might explain the non-adoption or low usage (Marquié et al. 2002). On the other hand, older adults report lack of interest and need. But 'for many respondents, lack of interest is caused by misconceptions about computers that they are not suitable for older people, too difficult or not useful' (Morris et al. 2007:49).
2.6 In terms of functional reasons, not having a computer and/or the Internet and/or lack of digital literacy are also among the most reported reasons for not using ICT (Morris et al. 2007; Neves & Amaro 2012). The lack of access to a computer and/or to the Internet might also be related to financial conditions, as economic variables play a role in the appropriation of technology by older adults (Lobet-Maris & Galant 2004).
2.7 In terms of physical reasons, physical problems can affect positively or negatively computer and Internet usage. If the problem is visual or it is related to arthritis it is expected that ICT usage will be negatively affected (Charness & Holly 2004). But if the problem is mobility-related, users may spend more time online than those less house-bound (Eastman & Iyer 2005; McMellon & Schiffman 2000). In the case of mobile phones, older adults report that their use of mobile phones is limited by some functions, such as small buttons, SMS, and other advanced features (Kurniawan et al. 2006). These functions are generally perceived as non user-friendly because of age-related physical limitations (Kurniawan et al. 2006).
2.8 Some age-related frailties affect ICT adoption, especially in the oldest old (Eastman & Iyer 2005; Czaja & Lee 2007). For example, cognitive changes might impact technology adoption and usage: age increase is associated with some losses in cognition, specifically in the general fluid intelligence (Gf) a critical factor in learning (Czaja & Lee 2007). Some studies indicate, nonetheless, that Gf performance can be improved by training (Jaeggi et al. 2008); and that the crystallized intelligence related to experience and acquired knowledge increases or stabilizes with age (Czaja & Lee 2007).
2.9 The main reasons for adoption and usage of ICT are mostly attitudinal, namely interest and perceived usefulness (Czaja et al. 2006; Morris et al. 2007). These factors are related to the use of computers for wordprocessing, to access the Web, and for email and social communication (Morris et al. 2007).
2.10 In short, these three major factors attitudinal, functional, and physical give us a more comprehensive picture of rejection and adoption of ICT. Models of technology adoption include a range of variables from attitudinal and socio-demographic to component abilities (Czaja et al. 2006); or specific indicators such as the ones proposed by the Technology Acceptance Model (TAM), namely, Perceived Usefulness, Perceived Ease-of-Use, and Attitute Toward Using (Davis 1985). Despite becoming a leading model for predicting system use, TAM has encountered several criticisms from a weak theoretical framework to easy determinist relationships (Bagozzi 2007; Chuttur 2009).
2.11 Although we did not use or directly test any specific model of technology adoption, we explored a range of socio-demographic indicators and the set of factors found in the literature. This association helped us understand why and how older adults use ICT and why they do not, which ultimately taps into their adoption of technology.
Research questions and goals
2.12 Building on the aforementioned literature, we combined attitudinal, functional, and physical factors with socio-demographic indicators to assess general ICT usage and non-usage. We summarize this review of the literature with three research questions:
RQ 1: What factors (attitudinal, functional, and physical) are related to ICT usage and non-usage by older adults?
RQ 2: What are the differences between older ICT users and non-users?
RQ 3: What socio-demographic indicators can predict ICT usage by older adults?
To address these questions, our goals were fourfold: first, to analyse ICT usage (and non-usage) among 500 individuals over 64 years of age living in Lisbon. Second, to investigate reasons why older adults use and do not use ICT. Third, to develop a profile for users and non-users in order to explore differences between and among them; and fourth, to test which socio-demographic indicators could predict ICT usage.
Background
The Locale
3.1 Lisbon is both the capital of Portugal and its most populous city: in 2011, Lisbon had 547,733 inhabitants (Pordata 2012). Of those, 24% are over 64 years of age of which 36.2% were male and 63.8% were female (INE 2011; Pordata 2012). Lisbon's aging indexes are above the Portuguese average: in 2011 the aging ratio[2] in Lisbon was 187.3, while the Portuguese aging ratio was 118.3 (Pordata 2012).3.2 Table 1 shows that the general Portuguese demographic indexes are similar to the European Union's averages. This table also provides the demographic indicators for Lisbon. Following the European trend, the population of Portugal and of Lisbon is aging as a result of an increase of longevity and a decline of fertility.
| Table 1: Selected demographic indicators: Lisbon, Portugal, & E.U. (2009)* | |||
| Lisbon | Portugal | European Union (27) | |
| Old-age dependency ratio | 27 | 26.7 | 25.6 (projected) |
| Life expectancy rate at birth | 79.1 | 79.6 | 79.4 |
| Life expectancy rate at 65 | 18.8 | 18.5 | 19.1 |
| Crude birth rate (per 1000 population) | 12.8 | 9.4 | 10.7 |
| Crude death rate (per 1000 population) | 14.5 | 9.8 | 9.7 |
| Total fertility rate (per woman during childbearing age, 15-49 years) | 1.6 | 1.3 | 1.6 |
| * To perform the comparisons, we had to rely on E.U. data that was out of date. This was unfortunate because we had more recent data for Portugal. | |||
| Source: INE 2010; Eurostat 2010a | |||
3.3 With regard to ICT usage, Lisbon has also the highest ICT access in the country: in 2012, 75% of Lisbon's households had at least one computer, while the national average was 66%; and 72% of Lisbon's households had Internet access when compared to the national average of 61% (INE 2012).
3.4 In 2011, 13.9% of the Portuguese between 65 and 74 years of age used a computer, while 12.5% of the same group used the Internet (INE 2011). Unfortunately, we do not have age detailed data for Lisbon. In terms of mobile phone usage, older adults present the lowest usage rate and are the only age group where the possession of landline phone is higher than mobile phone (Obercom 2009).
3.5 The European Union average is slightly lower than the Portuguese average concerning households with Internet access (73% vs. 75%), and individuals who use a computer (58% vs. 62%) or the Internet (56% vs. 60%) on a daily basis (INE 2012; Eurostat 2012). The percentage of individuals who used a mobile phone in the European Union is 87%, whereas in Portugal equals to 84% (Eurostat, 2008).
3.6 To conclude, the demographic situation in Portugal and in Lisbon is fairly similar to the European Union in terms of aging and ICT usage. As such, our study might resonate with other European countries in terms of findings and issues of European relevance.
Sampling & data collection
3.7 We surveyed a representative stratified random sample of 500 older adults (over 64 years of age) living in Lisbon, Portugal. The sample was drawn out of the 53 local councils that administratively comprise the city of Lisbon. We defined four strata according to the number of inhabitants, considering a proportional gender selection. Inside each stratum, local councils were randomly selected to compose the sampling points. In the final phase of the sample design, we used quota sampling by gender and age to follow the demographic structure of the city of Lisbon.
3.8 We conducted the survey between May and December of 2008. The questionnaires were administered face-to-face in the households of the interviewees, and only one person per household was interviewed. To select the households, we used the random route technique (i.e. a route map and a table of random numbers to select the house and the floor). Nine trained interviewers from the Technical University of Lisbon administered the questionnaires. The survey yielded information about how older adults were using mobile telephones, computers, and the Internet; their perception about ICT; their social networks; and leisure.
3.9 Although the original research was only quantitative, we decided to conduct follow-up qualitative interviews to contextualize the survey results. However, due to time and financial constraints, we only interviewed 10 older adults. We selected the interviewees at random in the city of Lisbon, using a convenience sample method that is, of course, not representative of the older adults population of Lisbon. The interviews were conducted between March and June of 2009, and yielded information about personal networks, ICT use, and attitudes towards ICT. The qualitative data were extremely useful to complement the quantitative data, namely on the appropriation and perceptions of ICT.
Data analysis
3.10 To analyse the survey data we used three types of statistical analyses. First, we carried out descriptive statistical analysis using IBM SPSS Statistics 18. Second, we used Latent Class Models (LCM) to estimate a profile for the mobile phone, computer, and the Internet user. LCM is a cluster analysis technique used to find latent classes (or subtypes) from multivariate data: it identifies the latent classes or clusters necessary to explain the associations between a set of observed variables, and distributes the observations among those classes (Fonseca 2009). If the baseline model (S = 1, with only one class) provides a good fit to the data, then the variables are not related. If, on the contrary, more than one class can explain the data, LCM will add classes until the best model is found (Fonseca 2009). The LCM estimation was done with LatentGold 4.5. Third, we ran a series of binomial logistic regressions to measure the impact of socio-demographic variables in the probability of using mobile phone, computer, and the Internet. A set of socio-demographics constituted our independent variables, namely age, gender, occupation, previous occupation, education, religion, household composition, and marital status. Use of mobile phones, computers, and the Internet constituted our three dependent variables, which are dichotomous (user or nonuser). The binomial logistic regressions were carried out on IBM SPSS Statistics 18.
3.11 The qualitative data were analysed with individual profiling and thematic analysis (Seidman 2006; King & Horrocks 2010). Even though we do not report an extensive analysis of our qualitative data in this article, we include some results and quotations from these interviews to help explain the survey findings and general perceptions of ICT.
Results
Demographics
4.1 Almost two thirds (60%) of the survey sample were women. The mean age was 74.34 (SD = 6.453), and respondents ranged from 65 to 95 years of age. Roughly half of the survey respondents were married (51.8%). The majority were parents (80.8%) and had grandchildren (61%). Almost half lived with a partner (43.4%), while more than one third lived alone (36.8%). Most of the respondents (79.4%) had less than secondary education and were retired (94.6%). Detailed demographics of our survey sample are presented in Table 2. This table also compares the demographics of our sample and of the Lisbon population, showing the representativeness of our survey sample.| Table 2: Demographics of the survey sample vs. Lisbon population of 65+ (%) | ||||
| Lisbon (2001) | Survey Sample (2008) | |||
| % | % | Diff. | ||
| Gender | Female Male | 64 35.9 | 60 40 | -4 4.1 |
| Marital status | Single Married/De facto Divorced/Separated Widowed | 8.8 69.8 5.8 15.6 | 7 51.8 5.2 36 | -1.8 -18 -0.6 20.4 |
| Household Composition | One-Person Couple without children Other | - - - | 36.8 43.4 19.8 | - - - |
| Education | No education Less than secondary education Secondary education Higher education | 22.5 66 5.5 6 | 6 79.4 2.6 10.4 | -16.5 13.4 -2.9 4.4 |
| Occupation | Working Retired | 4 96 | 2.4 94.6 | -1.6 -1.4 |
| Source: INE 2001 | ||||
4.2 The demographics of our sample compare favourably to the older adult population of Lisbon with a few exceptions: married people and people with no education are under-represented in our sample, while widowed people are over-represented. Nevertheless we are comparing data from a 2001 census with a survey conducted in 2008, which means that we cannot be certain of any demographic variation between 2001 and 2008.
ICT usage, non-usage, and perceptions
Mobile phones
4.3 More than two-thirds (77%) of the survey respondents had a mobile phone: the main reasons to use a mobile phone were to talk to family (40.2%), to talk to friends (24.9%), and for emergencies (21.6%) (see Table 3). These results were complemented by the qualitative data: the interviewees associated owning a mobile phone with family proximity, safety, and convenience. And even the non-users had a positive perception of mobile phones, emphasizing its convenience: 'It is very useful and I thought of getting one once But it is expensive and I already have a home phone', said one of the interviewees.
| Table 3: Reasons to use mobile phones, computers, and the Internet (n=500). | |||||
| Reasons to use mobile phones (n=385) | % | Reasons to use computers (n=66) | % | Reasons to use the Internet (n=49) | % |
| To talk to family | 40.2 | To go online | 44.8 | To search | 25.4 |
| To talk to friends | 24.9 | To write text documents | 24.1 | Emailing | 21.2 |
| Emergencies | 21.6 | To play | 8.4 | Leisure | 13.2 |
| SMS | 7.2 | To scan pictures | 5.9 | To talk to family & friends | 8.5 |
| To take pictures | 2.4 | To listen to music | 5.9 | To send documents | 7.4 |
| To work | 2.6 | To work | 4.9 | To read/write blogs | 5.8 |
| Other | 1.1 | To watch movies | 2.5 | Chat rooms/IM | 5.3 |
| Other | 3.5 | Online payments | 4.2 | ||
| Online banking | 4.2 | ||||
| Online shopping | 2.6 | ||||
| Social networking sites | 1.6 | ||||
| Other | 0.6 | ||||
| Note: The survey questions on ICT usage (and non-usage) were closed-ended, in the form of multiple choices with one open option (Other. Which one?). The interviewers, administering the questionnaires, would wait for spontaneous responses. | |||||
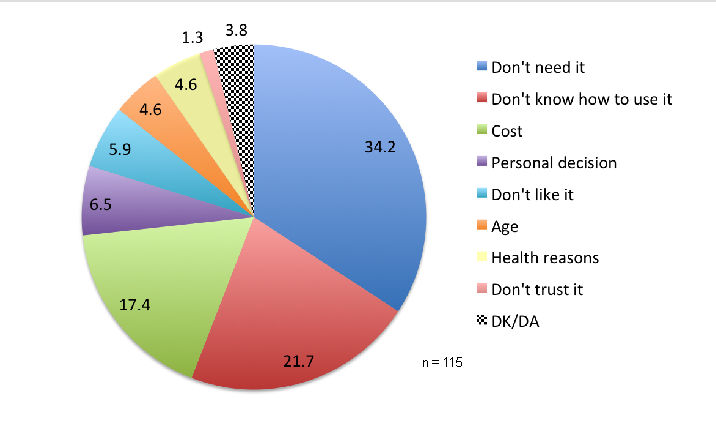
4.4 The main reasons not to use mobile phones reported in the survey were: 'Don't need it' (34.2%), 'Don't know how to use it' (21.7%), and 'it's expensive' (17.4%). Other reasons can be found in Figure 1. In the qualitative interviews, the participants reported difficulties with functions such as sending text messages or more advanced functions. Visual acuity and physical characteristics of mobile phones, such as small screens and small buttons, were the main reasons for a limited usage. Only one of the interviewees made a full use of the mobile phone: 'I do almost everything with it, I even pay my bills online'. The negative aspects indicated in the interviews were cost, both for mobile phone users and non-users.
|
|
Figure 1. Reasons for not using mobile phones (%). Note: DK/DA means 'don't know'/'don't answer' |
Computers
4.5 Thirteen percent (13.2%) of our survey sample used a computer, mostly to go online and send/read emails (44.8%) and to write text documents (24.1%). Other reasons for computer usage can be found in Table 3. Likewise, the qualitative interviewees reported that they used computers mainly to go online. The few (four) interviewees who used a computer learned to use it later in life, through a program for senior digital literacy at the municipalities where they lived. Only one interviewee learned to use a computer at work before retiring, and already had a computer as a working tool. For this reason, he was very comfortable with this technology: 'It was always part of my life, and I can't live without it'.
4.6 The principal reasons not to use computers reported in the survey were: not knowing how to use it (38.8%), no need (23.5%), cost (11.1%) and age (11.1%). In terms of the response category 'age', we should emphasize that in the survey pre-tests people would spontaneously respond that they were too old to use ICT with the expression 'I don't have the age' in a sense of age-appropriate social norms. So, this category was added to the survey. We also had the category 'health problems' for the respondents who reported having physical difficulties mostly associated with age. The interviewers would, therefore, differentiate these two meanings.
4.7 In the interviews, the non-computer users explained that they do not need one and/or lack the knowledge to use it. These non-users stated, nonetheless, that computers are important tools for education. As one interviewee says 'It is good for my grandchildren, to learn and to do their homework'.
Internet
4.8 Roughly one in ten respondents (9.8%) of our survey sample used the Internet. The Internet is predominantly used to search (25.4%), to send emails (21.2%), and for leisure (13.2%) (see Table 3). Only one interviewee used the Internet more avidly. This interviewee was in the process of creating a website to host his pictures of Angola, where he served during the Portuguese colonial war. The other three Internet users felt as if they were 'still learning how to use it'. They went online to check news, recipes, and general websites. Interestingly, all indicated that their grandchildren were the main supporters and teachers of their use of the Internet (but also of computers and mobile phones).
4.9 The foremost reported reasons in the survey not to use the Internet were: not knowing how to use it (44.7%), no need (43.5%), and lack of access to a computer (11.8%). The non-users explained, in the qualitative interviews, that they do not use the Internet because they do not have a computer and/or do not know how to use it. But they all talked about the usefulness of the Internet, basing their perception on their grandchildren's opinion. They also mentioned 'dangers', mostly the ones they see on TV, such as fraud and pedophilia.
4.10 Additionally, the qualitative data brought to light a peculiar case: two of the non-users turned out to use the Internet indirectly. They had relatives living abroad and communicated with them via Skype, a peer-to-peer video conferencing program. But they depended on others, in this case their grandchildren, to set the computer up and the video running for them. This was not only the case in the initial installation. They could not replicate the experience on their own, needing assistance each time they wanted to use Skype. These two interviewees can be considered 'faux users', i.e. 'a person that considers himself or herself a non-user but intermittently uses a technology with assistance of others' (Neves & Amaro 2012, paragraph 63).
Profile of the mobile phone, the computer, and the Internet user
4.11 To define a multivariate profile based on probabilistic associations, we used Latent Class Models (Fonseca 2012). We carried out a LCM estimation for each dichotomous dependent variable (mobile phone, computer, and Internet usage) and the independent variables, i.e. the socio-demographic variables (age, gender, marital status, occupation, previous occupation, education, religion, and household composition). Since most clustering variables were categorical, we used LCM with AIC3 information criterion to select the best model (Fonseca 2010).
4.12 The LCM estimation defined two classes for mobile phone and computer usage (see Table 4). We could not estimate the model with the variable Internet usage, due to the occurrence of boundary solutions. This happens when estimated probabilities equal zero or one (or the log-linear parameters equal minus or plus infinity), which means that we are not sure about the validity of the LCM estimation.
| Table 4: Model parameters' estimates for mobile phone & computer usage | ||
| Overall probability | Class 1 (53%) | Class 2 (47%) |
| MOBILE | ||
| No | 0,0814 | 0,9186 |
| Yes | 0,6994 | 0,3006 |
| COMPUTER | ||
| No | 0,469 | 0,531 |
| Yes | 0,9289 | 0,0711 |
| Covariates | ||
| GENDER | ||
| Female | 0,4852 | 0,5148 |
| Male | 0,5976 | 0,4024 |
| OCCUPATION | ||
| Retired & Working | 0,7852 | 0,2148 |
| Retired | 0,4865 | 0,5135 |
| Working | 0,7296 | 0,2704 |
| Other | 0,6356 | 0,3644 |
| PREVIOUS OCCUPATION | ||
| Public servants (seniors) | 0,9545 | 0,0455 |
| Technicians | 0,7744 | 0,2256 |
| Small businessmen, owners, sellers | 0,5611 | 0,4389 |
| Administrative staff | 0,7949 | 0,2051 |
| Services (shopkeepers) | 0,2569 | 0,7431 |
| Farmers & similar | 0,2572 | 0,7428 |
| Skilled workers & similar | 0,3407 | 0,6593 |
| Others | 0,5739 | 0,4261 |
| Security services (police, security guards, etc.) | 0,0001 | 0,9999 |
| Specialized workers | 0,7182 | 0,2818 |
| Inactive | 0,0782 | 0,9218 |
| MARITAL STATUS | ||
| Single | 0,3969 | 0,6031 |
| Married/De facto | 0,5965 | 0,4035 |
| Divorced/separated | 0,8736 | 0,1264 |
| Widowed | 0,4088 | 0,5912 |
| HOUSEHOLD COMPOSITION | ||
| Lives alone | 0,4543 | 0,5457 |
| Lives with spouse | 0,5511 | 0,4489 |
| Lives with spouse and offspring | 0,8332 | 0,1668 |
| Lives with siblings | 0,5711 | 0,4289 |
| Lives with offspring | 0,5124 | 0,4876 |
| Lives with offspring and grandchildren | 0,5759 | 0,4241 |
| Lives with grandchildren | 0,4993 | 0,5007 |
| Other | 0,5486 | 0,4514 |
| RELIGION | ||
| Catholic | 0,4694 | 0,5306 |
| Catholic (non-practicing) | 0,6103 | 0,3897 |
| Muslim | 0,9978 | 0,0022 |
| No religion | 0,542 | 0,458 |
| Other | 0,2038 | 0,7962 |
| EDUCATION | ||
| Less than secondary education | 0,4646 | 0,5354 |
| Secondary education | 0,8168 | 0,1832 |
| Higher education | 0,9409 | 0,0591 |
| AGE | ||
| Until 69 | 0,7938 | 0,2062 |
| 69,1- 74 | 0,7512 | 0,2488 |
| 74,1 - 79 | 0,3398 | 0,6602 |
| + 79 | 0,1126 | 0,8874 |
4.13 In Table 4, we can see two kinds of probabilities: first, the ordinary probabilities or proportions of mixture, i.e. the probabilities of belonging to class 1 and class 2, which is 0,53 and 0,47. Second, the conditional probabilities: for instance, 0,0814 is the probability of not using a mobile phone if the individual belongs to class 1 or 0,9186 if the individual belongs to class 2. So, the mobile phone non-user has a higher probability of belonging to class 2.
4.14 This clustering describes two aggregated profiles: the mobile phone and the computer user, and the mobile phone and the computer non-user (see Table 5).
| Table 5: Profile of the mobile phone & computer user and non-user | ||
| Variables | Class 1 (53%) | Class 2 (47%) |
| Mobile | Yes | No |
| Computer | Yes | No |
| Gender | Male | Female |
| Occupation | Retired & Working; Working; Other | Retired |
| Former occupation | Public servants (seniors); Technicians; Small businessmen, owners, and sellers; Administrative staff, technical sellers; Specialized workers. | Services (shopkeeper); Farmers & similar; Skilled workers; Security services (Police; security guards, etc.); Inactive |
| Marital Status | Married/De facto; Divorced/Separated | Single; Widowed |
| Household composition | Lives with spouse; Lives with spouse & offspring; Lives with siblings; Lives with offspring; Lives with offspring & grandchildren; Other | Lives alone; Lives with grandchildren |
| Religion | Catholic (non-practicing); Muslim; No religion | Catholic; Other |
| Education | Secondary; Higher education | Less than secondary education |
| Age | Until 74 | 75&+ |
4.15 The mobile phone and the computer user is more likely to be:
- Male;
- younger (until 74);
- with secondary or higher education;
- in the work force or retired but still working;
- with a previous or current occupation in specialized or technical fields;
- married/de facto or divorced/separated.
- Female;
- older (75&+);
- with less than secondary education;
- retired;
- with a previous occupation in services, agriculture and similar or inactive;
- single or widowed;
- living alone or living with grandchildren;
- Roman Catholic.
Predicting ICT usage
4.16 To measure the impact of the independent variables, i.e. socio-demographic factors (age, gender, occupation, previous occupation, education, religion, household composition, and marital status) in the probability of using mobile phones, computers, and the Internet all dichotomous dependent variables we carried out binomial logistic regressions (using the Forward:LR method).
Mobile phones usage
4.17 Only age (p < 0.001), education (p < 0.01), and marital status (p < 0.05) had a statistically significant effect on the Logit of the probability of using mobile phones (see Table 6).
| Table 6: Logit coefficients of the logistic regression model of mobile phone | |||||
| Predictor | B | SE | Wald | df | Sig. |
| Age | -.143 | .020 | 53.028 | 1 | .000 |
| Education | 13.768 | 2 | .001 | ||
| Education (Less than second.) | -2.284 | .644 | 12.563 | 1 | .000 |
| Education (Secondary) | -1.341 | .984 | 1.856 | 1 | .173 |
| Marital Status | 13.030 | 3 | .005 | ||
| Marital Status (Single) | -1.214 | .445 | 7.426 | 1 | .006 |
| Marital Status (Married/United) | .207 | .248 | .700 | 1 | .403 |
| Marital Status (Divorced/Separated) | 1.010 | .686 | 2.166 | 1 | .141 |
| Constant | 13.856 | 1.724 | 64.585 | 1 | .000 |
| Notes: 1. Baseline Education: Higher education/ Marital Status: Widowed. 2. Validity & fit of the model: The model is statistically significant (G2 (6)= 105.084; p = 0.001) and fits well the data (x2HL (8) = 5.345, p = 0.720). The pseudo R-squares are: R2N = 28%; R2CS = 19%.[3] This model classifies correctly 77.9% of the cases, presenting an excellent discriminant capacity (ROC c= 0.783; p < 0.001). | |||||
4.18 When age increases, the likelihood of using mobile phones decreases. Per year, the odds of using a mobile phone decrease by 13% (i.e. multiplicatively by a factor equal to e-(-0.143)= 0.867). Only 'less than secondary' education is statistically significant, comparing to the baseline 'higher education'. So, when compared to people with higher education, people with less than secondary education were less likely to use mobile phones. In addition, comparing to widows, singles were more likely to use mobile phones.
Computer usage
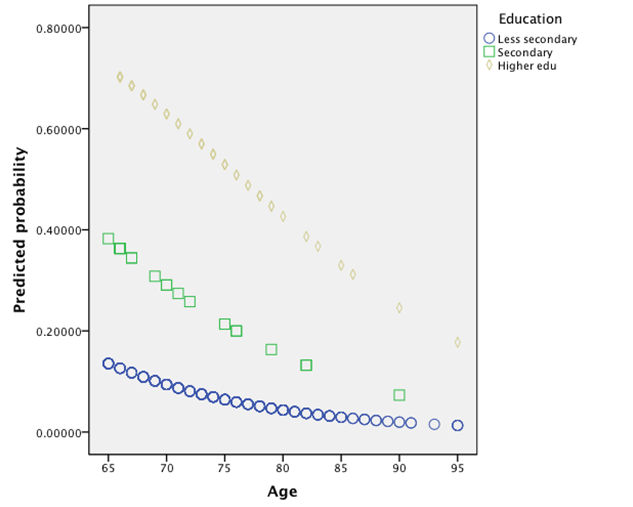
4.19 Computer usage was predicted by age (X2Wald (3) = 13.030, p = 0.005) and education (X2Wald (3) = 13.030, p = 0.005). The probability of using computers by age and education are illustrated in Figure 2:
|
|
Figure 2. Predicted probability of using computer (y = 1), by age and education. Notes: The model is statistically significant (G2 (3)= 80.820; p = 0.001) and fits the data well, according to the Hosmer and Lemeshow test (x2HL (8) = 4.399, p = 0.819). The pseudo R-squares are: R2N = 28%; R2CS = 15%. This model correctly classifies 89.1% of the cases, presenting an excellent discriminant capacity (ROC c= 0.783; p < 0.001) |
When age increases (bage= -0.083), the probability of using computers decreases. Per year, the odds of using a computer decrease by 8%. When compared to people with higher education, people with less than secondary education (e-(-2.795)= 0.061) and people with secondary level education (e-(-1.420)= 0.242) were less likely to use a computer by 94% and 76% respectively.
Internet usage
4.20 Only education could significantly predict Internet usage (see Table 7). Less than secondary education is the only statistically significant variable in the model (p < 0.05). When compared to people with higher education, people with less than secondary education were less likely to use the Internet by 84%.
| Table 7: Logit coefficients of the logistic regression model of Internet usage | |||||
| Predictor | B | SE | Wald | df | Sig. |
| Education | 7.166 | 2 | .028 | ||
| Education (Less than secondary) | -1.834 | .710 | 6.671 | 1 | .010 |
| Education (Secondary) | -.550 | 1.254 | .192 | 1 | .661 |
| Constant | 2.159 | .610 | 12.543 | 1 | .000 |
| Notes: 1. Baseline Education: Higher education 2. Validity & fit of the model: (G2 (2)= 8.444; p = 0.015; x2HL (1) = 0.000, p = 1.000. This model is not as robust as the previous ones, and the pseudo R-squares are small (R2N = 18%; R2CS = 12%). But this model correctly classifies 74.2% of the cases, presenting an acceptable discriminant capacity (ROC c= 0.705; p < 0.012). | |||||
Discussion
ICT usage and non-usage: attitudinal and functional factors
5.1 We found that although our results point to a digital (computer and Internet) divide, the majority (77%) of our survey sample used a mobile phone. This is not the same as saying that older adults make full use of mobile phones as we noticed in the qualitative interviews their usage of mobile phones is limited to basic functions, such as making and receiving calls. On these grounds, we encountered a functional digital illiteracy that not only affects computer and Internet users but also mobile phone users.5.2 In light of RQ1 and the three major groups of factors (attitudinal, functional, and physical), we observed a prevalence of attitudinal and functional factors for non-usage and of attitudinal factors for usage. The main reasons given not to use mobile phones were attitudinal ('do not need it') and functional ('do not know how to use it' or 'it is expensive'); the main reasons given not to use computers were functional ('do not know how to use it') and attitudinal ('do not need it'); and the main reasons given not to use the Internet were functional ('do not have a computer'; 'do not know how to use it'). These results show that functional factors play a major role in ICT usage, especially in computer and Internet usage.
5.3 The primary reasons to use ICT were related to attitudinal factors: interest and perceived usefulness. For mobile phones, this meant communication with family members, family proximity, safety, and convenience. For computers, to go online and to write text documents. For the Internet, to search and to use email services.
5.4 To sum up, we found that attitudinal and functional factors are more predominant than physical factors for both ICT usage and non-usage. In particular, the Internet non-usage was only related to functional factors, i.e. lack of a computer and lack of literacy to use it.
Rich get richer? Differences between users and non-users
5.5 Our LCM estimation only defined a profile of the mobile phone and computer user. Nonetheless, we anticipate that our aggregated profiles can be extended to the Internet user. Generally, and answering RQ2, we can see that users are less than 75 years old, predominantly male, with higher education levels, active or retired but still working, and had or have occupations associated with a higher social standing (i.e. with more financial resources). This characterization is similar to the initial typical Internet user: younger, male, highly educated, and wealthier (Kwon 2005). But while this traditional type of Internet user is no longer dominant on the web (Kwon 2005), it seems it is still present in the cohort of older adults.
5.6 Our findings also show the heterogeneity of this age group and suggest a cohort effect (i.e. age differences in ICT usage within the group of older adults). We found an age divide within the cohort of older adults (between those greater than or less than 74 years of age).
5.7 The core profile of the non-user of our sample is consistent with the one found in the literature, with the exception of the religious characteristic: non-users were more likely to be Roman Catholic. We have insufficient data to make any claims about this result, but this group might be more traditional or critical in their adoption of new technology.
5.8 Our LCM results indicate that the main differences between older ICT users and non-users are mostly based on age and education.
The education factor
5.9 Age and education predicted mobile phone and computer usage, as we expected after the LCM profiling. On the one hand, per each year of age there is a lower chance of using mobile phones and computers. On the other hand, people with no education have a lower chance of using these two ICT when compared to people with a university degree.
5.10 One possible explanation for the negative relationship between age and mobile phones and computers is that most older-adults do not have ICT embedded in their lives. Children and teenagers learn to use ICT at school, while adults learn it through their offspring or as a condition for work. For older adults, these personal/professional conditions are not normally at stake (hence, the 'no need' answer or the prerequisite digital literacy). The only technological savvy user of our ten interviewees had previous experience with ICT and was highly educated: as an engineer he made full use of ICT before retiring. As our results suggest, education could compensate for the 'age factor': older adults with a university degree are more likely to use mobile phones and computers.
5.11 But the reported factors for not using these ICT were functional (e.g. education) and attitudinal (e.g. interest or self-confidence), and not physical (e.g. age-related limitations). These functional and attitudinal factors might be related to age, but we did not observe it statistically.
5.12 In the case of the Internet, only education predicts Internet usage. Once again, our results point to the importance of functional factors rather than just physical or age related.
5.13 Our findings validate the literature in some respects computer usage is influenced by age and education and the Internet is influenced by education. As with Rice & Katz's study (2003), mobile phone usage was also influenced by marital status. The LCM estimation showed that married people are more likely to use mobile phones than widowed and single people. The logistic regression analysis complemented these results by showing that widows are more likely to use mobile phones than singles. This might be related to the reasons reported by the respondents to own a mobile phone, which were to communicate with their relatives and for emergencies. Widowed people might have more extended families or be in a more fragile social position, since their close network was reduced or weakened by the loss of a spouse.
5.14 Contrary to the literature, mobile phone usage was influenced by age and, surprisingly, we did not find any significant statistical relationship between Internet usage and age. We can advance several tentative reasons for the Internet not being associated with age:
- There might be a type of 'Internet anxiety' related to levels of education;
- the Internet might require a specific type of literacy that is not as conditioned by age as mobile phones and computers;
- the Internet might be more immersive than other ICT, having something for everybody regardless of age (particularly if we consider the social affordances of the Internet, Wellman et al. 2003) but with a prerequisite literacy to use it;
- the adoption of computers or training in ICT might have occurred in a working phase, before retiring, and Internet use might be a more personal exploration that is related to confidence, inquisitiveness, self-reliance, and self-esteem, traits that usually correlate with education (Orth et al. 2010);
- perceived usefulness and interest of the Internet might be related to education: people with higher education would more easily grasp the usefulness of the Internet and would, therefore, be more interested in using the Internet regardless of age.
Conclusion
6.1 Our study shows that age and education are the main socio-demographic predictors of mobile phone and computer usage. While age seems to determine the likelihood of using mobile phones and computers, the main reasons for not using them were attitudinal and functional. In the case of the Internet, only education, i.e. a functional factor, was a significant predictor.6.2 From an operational and policy standpoint, functional factors, such as literacy and lack of a computer/Internet access, might be as important as age for technology adoption by older adults. Moreover, education seems to compensate for the 'age factor'.
6.3 Considering the social affordances of the Internet (such as its communication features, cf. Wellman et al. 2003; or the online availability of all Portuguese public services, cf. Eurostat 2010b), we have to make sure that the lack of access or of digital skills is not further excluding older adults. To prevent more age-based inequality, e-inclusion strategies have to be set in place. These strategies should involve training courses tailored to older adults, as well as public policies that facilitate access and usage. These public policies could include the availability of computers and the Internet in community centres, and programs with special conditions (with favourable terms of credit or a discounted price) for the acquisition of computers and Internet access by older adults. Education and other functional factors (having a computer and Internet access) seemed to be crucial factors for ICT adoption by older adults, and should be taken into account in any initiative to bridge the digital divide.
6.4 This study adds to the existing knowledge by supporting the literature, but also by presenting new findings on older adults and ICT. For instance, Internet usage was not predicted by age; and family members were the principal reason for ICT adoption by older adults. The need for being close to one's family and the intergenerational aspect the stimulus and the influence of grandchildren was visible in the majority of the interviewees' accounts.
6.5 These results are, however, limited by a cross-sectional design and by the possible idiosyncrasies of the Portuguese and the Lisbon setting. While Portugal follows similar demographic trends of other European countries, we cannot expect that other European countries will reach the same results. And while the survey data is representative of Lisbon's older adults, we cannot claim that it is representative of Portuguese older adults.
6.6 Future research should continue to investigate the relationship between ICT, age, and other socio-demographic variables, as well as to explore reasons for the non-existent relationship between the Internet and age. Research should also include the study of other research settings, such as transnational and rural. Additionally, besides users and non-users, it would be interesting to explore other typologies, such as faux users, dropouts (people that used these ICT before but do not use them anymore), and different types of non-users. A longitudinal study would also be of great value to the field, particularly one that could explore transitional social behaviour within a cohort of older adults.
Notes
1In the UK, for instance, the government has a strategy named 'digital by default' for public services, aiming to cut telephone and face-to-face services (cf. <http://www.publicservice.co.uk/news_story.asp?id=20813>).
2The aging ratio or index is the ratio of the number of people aged 65 and over per 100 young people under age 15: AR=[(P(65, +)/ P(0, 14)]*10^n
3The pseudo R-squares appear to be rather small in the models but these are pseudo R-squares, not equivalent to the R-squares of linear regression models (Menard 2002).
References
BAGOZZI, R. P. (2007) 'The legacy of the technology acceptance model and a proposal for a paradigm shift', Journal of the Association for Information Systems 8 (4) p. 12.
BOASE, J., Horrigan, J., Wellman, B., & Rainie, L. (2006) The strength of internet ties. Washington, DC: Pew Internet and American Life Project.
CARPENTER, B. D. & Buday, S. (2007) 'Computer use among older adults in a naturally occurring retirement community', Computers in Human Behaviour, 23 p. 30123024.
CHARNESS, N. & Holly, P. (2004) 'The new media and older adults', The American Behavioural Scientist 48(4) p. 416433.
CHUTTUR, M.Y. (2009) 'Overview of the technology acceptance model: Origins, developments and future directions', Working Papers on Information Systems 9(37), Indiana University.
CZAJA, S., & Lee, C. C. (2007) 'The impact of aging on access to technology', Universal Access in the Information Society (UAIS), 5(4) p. 341349.
CZAJA, S.; Charness, N.; Fisk, A. D.; Hertzog, C.; Nair, S.N., Rogers, W. A.; Sharit, J. (2006) 'Factors predicting the use of technology: findings from the Center for Research and Education on Aging and Technology Enhancement', Psychology & Aging, 21(2) p. 333352.
DAVIS, F.D. (1985) A technology acceptance model for empirically testing new end-user information systems: theory and results (Doctoral Dissertation). MIT Sloan School of Management: Cambridge, MA.
EASTMAN, J., & Iyer, R. (2005) 'The impact of cognitive age on internet use of the elderly: an introduction to the public policy implications', International Journal of Consumer Studies, 29(2) p. 125136.
EUROSTAT (2008) Use of mobile phone. <http://epp.eurostat.ec.europa.eu/portal/page/portal/product_details/dataset?p_product_code=ISOC_CIAS_MPH> (accessed 1 November 2012).
EUROSTAT (2010a) Demographic Report. Eurostat Statistics.
EUROSTAT (2010b) E-government availability. <http://appsso.eurostat.ec.europa.eu/nui/show.do?dataset=isoc_si_sseg&lang=en> (accessed 1 November 2012).
EUROSTAT (2012) Frequency of Internet use and frequency of computer use. <http://epp.eurostat.ec.europa.eu/tgm/table.do?tab=table&init=1&language=en&pcode=tin00092&plugin=0>
<http://appsso.eurostat.ec.europa.eu/nui/show.do?dataset=isoc_ci_cfp_fu&lang=en> (accessed 15 November 2012).
FONSECA, J. R. S. (2009) 'Customer satisfaction study via a latent segment model', Journal of Retailing and Consumer Services, 16 p. 352359.
FONSECA, J. R. S. (2010) 'On the performance of information criteria in latent segment models estimation with categorical segmentation base variables', Proceedings of ICMSE 2010.
FONSECA, J. R. S. (2012) 'Clustering in the field of social sciences: That's your choice', International Journal of Social Research Methodology, [DOI:10.1080/13645579.2012.716973]
HUDSON, Robert B. (2005) 'Contemporary challenges to age based policy', in Hudson, R. B. (Ed.), The New Politics of old age policy. Baltimore: The John Hopkins Univ. Press.
INE (2001) Census data 2001. Lisbon: INE.
INE (2010) Statistical yearbook of Portugal 2009. Lisboa: INE.
INE (2011) Sociedade da Informação e do Conhecimento. Inquérito à Utilização de Tecnologias da Informação e da Comunicação pelas Famílias. Lisboa: INE.
INE (2012) Sociedade da Informação e do Conhecimento. Inquérito à Utilização de Tecnologias da Informação e da Comunicação pelas Famílias. Lisboa: INE.
JAEGGI, S., Buschkuehl, M., Jonides, J., Perrig, W. (2008) 'Improving fluid intelligence with training on working memory', PNAS Proceedings of the National Academy Sciences USA, 105(19) p. 68296833.
KATZ, J. E., & Rice, R. E. (2002) 'Project syntopia: Social consequences of internet use', IT & Society 1 (1) p. 166179.
KING, N. & Horrocks, C. (2010) Interviews in qualitative research. London: Sage.
KOUVO, A. & Räsänen, P. (2005) 'Does the internet have an impact on sociability? A comparison of four European countries', in Wilska, T. & Haanpää, L. (Eds.), Lifestyles and social change, Turku: Turun kauppakorkeakoulun Julkaisuja.
KURNIAWAN, S., Nugroho, Y., & Mahmud, M. (2006) 'A study of use of mobile phones by older persons', CHI. Montréal: CHI.
KWON, N. (2005) 'Influences of demographic characteristics of community network users on their perceptions and use of the network', Proceedings of the American Society for Information Science and Technology, 39 (1) p. 326337.
LANSDALE, D. (2002) 'Touching lives: Opening doors for elders in retirement communities through email and the internet', in Morrell, R.W. (Ed), Older adults, health information, and the world wide web, New Jersey: Lawrence Erlbaum Associates, pp. 133151.
LOBET-MARIS, C. & Galand, J. (2004) 'Seniors and ICT's: A sense of wisdom', Communications & Strategies, 53(1) p. 87101.
MALTA, S. (2008) 'Intimacy and older adults: A comparison between online and offline romantic relationships', in Marjoribanks, T. et al. (Eds.), Re-imagining sociology. Refereed conference proceedings. The Australian Sociological Association.
MARQUIÉ, J. C., Jourdan-Boddaert, L., & Huet, N. (2002) 'Do older adults underestimate their actual computer knowledge?' Behaviour & Information Technology, 21(4) p. 273280.
MCMELLON, C. A., & Schiffman, L. G. (2000) 'Cybersenior mobility: Why some older consumers may be adopting the internet', Advances in Consumer Research, 27 p. 139144.
MCMELLON, C. A. & Schiffman, L. G. (2002) 'Cybersenior empowerment: How some older individuals are taking control of their lives', The Journal of Applied Gerontology, 21(2) p. 157175.
MENARD, S. W. (2002) Applied logistic regression analysis (Vol. 106). Thousand Oaks: Sage Publications.
MILLWARD, P. (2003) The grey digital divide: perception, exclusion and barriers of access to the Internet for older people, In First Monday, [online] Available from: < http://www.firstmonday.org/issues/issue8_7/millward/index.html> (accessed 3 April 2010).
MITZNER, T., Boron, J., Fausset, C., Adams, A., Charness, N., Czaja, S., Dijkstra, K., Fisk, A., Rogers, W., Sharit, J. (2010) 'Older adults talk technology: Technology usage and attitudes', Computers in Human Behavior 26 p. 17101721.
MORRIS, A., Goodman, J., & Brading, H. (2007) 'Internet use and non-use: views of older users', Universal Access in the Information Society, 6(1) p. 4357.
NEVES, B. B. (2013) 'Social capital and internet use: The irrelevant, the bad, and the good', Sociology Compass (in press).
NEVES, B. B. & Amaro, F. (2012) 'Too old for technology? How the elderly of Lisbon use and perceive ICT', The Journal of Community Informatics, 8 (1): <http://ci-journal.net/index.php/ciej/article/view/800/904> (accessed 20 March 2012).
NORRIS, P. (2001) Digital sivide: Civic engagement, information poverty, and the internet worldwide. Cambridge: Cambridge University Press.
OBERCOM. (2009) A Sociedade em Rede em Portugal 2008. Obercom.
ORTH, U., Trzesniewski, K. H., & Robins, R. W. (2010) 'Self-esteem development from young adulthood to old age: a cohort-sequential longitudinal study', Journal of Personality and Social Psychology, 98(4) p. 645658.
PORDATA. (2012) Base de dados de Portugal Contemporâneo. Fundação Francisco Manuel dos Santos: <www.pordata.pt> (Accessed 1 November 2012).
RICE, R., & Katz, J. (2003) 'Comparing Internet and mobile phone usage: digital divides of usage, adoption, and dropouts', Telecommunications Policy, 27(89) p. 597623.
RICHARDSON, M., Weaver, C. K. & Zorn, T. E. (2005) Getting on: older New Zealanders' perceptions of computing', New Media and Society, 7(2) p. 219245.
ROBINSON, J., Martin, S. (2010) 'IT use and declining social capital?', Journal of Social Science Computer Reviews, 28(1) p.4563.
SEIDMAN, I. (2006) Interviewing as Qualitative Research. A Guide for Researchers in Education and the Social Sciences. New York: Teachers College Press.
SHRESTHA, L. (2000) 'Population aing in developing countries', Health Affairs, 19 (3) p. 204212.
SWINDELL, R. (2000) 'Using the internet to build bridges to isolated older people', Australasian Journal on Ageing, 19(1) p. 3840.
TORP, S., Hanson, E., Hauge, S., Ulstein, I. & Magnusson, L. (2008) 'A pilot study of how information and communication technology may contribute to health promotion among elderly spousal carers in Norway', Health and Social Care in the Community, 16(1) p. 7585.
WELLMAN, B., Quan-Haase, A., Boase, J., Chen, W., Hampton, K., Isla de Diaz, I, & Miyata, K (2003) 'The social affordances of the Internet for networked individualism', Journal of Computer-Mediated Communication, 8(3): <http://jcmc.indiana.edu/vol8/issue3/wellman.html>
XIE, B. (2008) 'Multimodal computer-mediated communication and social support among older Chinese older Internet users', Journal of Computer-Mediated Communication, 13 p. 728750.